
Why Orion Stock Fell 4.3% Despite 47% Profit Growth in Q1
1 hr ago

U.S. equity markets swung violently between 20 April and 22 April 2026, with the Dow Jones whipsawing through a 500-point range as traders struggled to price in rapidly shifting signals from the Strait of Hormuz standoff. The three-day period encapsulated the fragility of the current market environment: a Monday selloff triggered by renewed U.S.-Iran hostilities, continued weakness on Tuesday as peace talks collapsed, and a sharp Wednesday recovery on news of limited shipping resumptions. Yet beneath the surface rally, the underlying drivers of volatility remain unresolved.
This analysis unpacks what drove the selloff, why the recovery may prove fragile, and what investors should monitor as geopolitical and inflationary crosscurrents continue to dominate price action.
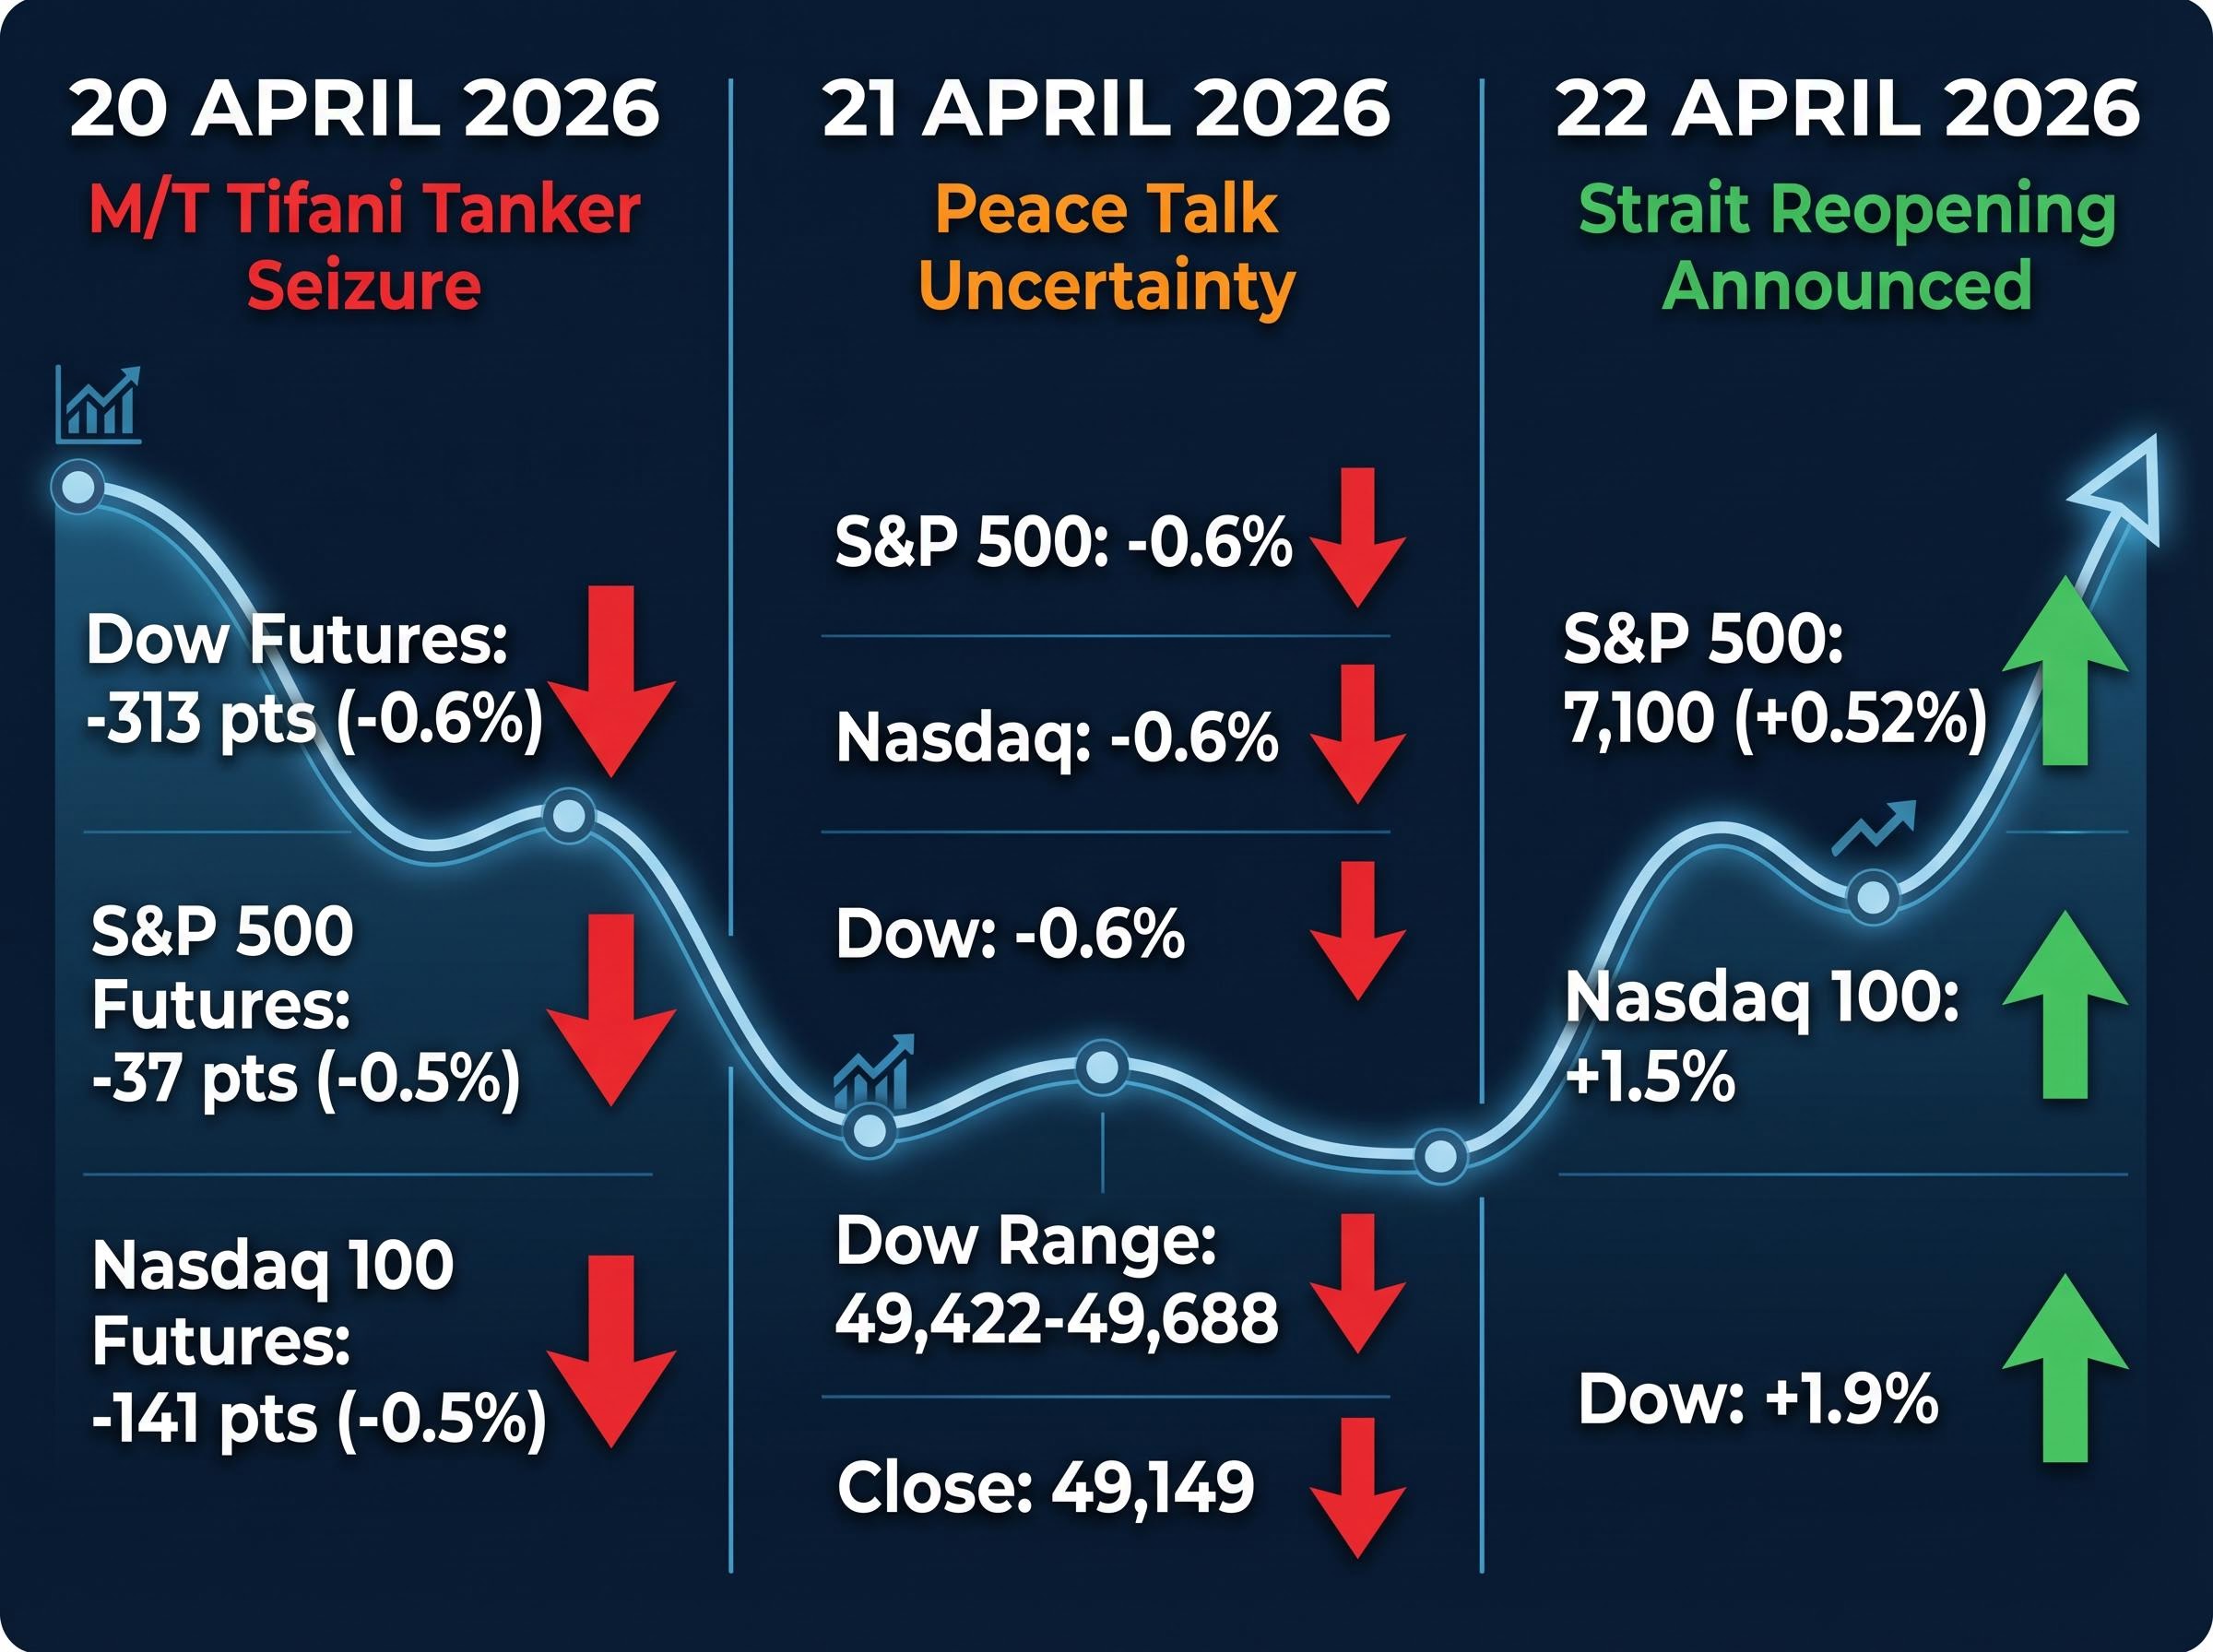
The selloff began on 20 April when reports emerged that the Trump administration had captured an Iranian crude oil tanker, the M/T Tifani, carrying approximately two million barrels of oil in the Indian Ocean. Dow futures dropped 313 points (0.6%), S&P 500 futures fell 37 points (0.5%), and Nasdaq 100 futures declined 141 points (0.5%) as investors fled to commodities and reassessed the risk of sustained conflict.
Tuesday brought no relief. The S&P 500, Nasdaq, and Dow all closed down approximately 0.6% as uncertainty over planned peace talks between U.S. and Iranian officials dominated sentiment. The Dow traded between 49,422 and 49,688 before settling at 49,149, a 270-point intraday range that revealed continuous repricing of risk. Bond and equity markets both registered negative sessions.
Wednesday reversed the losses in dramatic fashion. The S&P 500 rose to 7,100 points, gaining 0.52%. The Nasdaq 100 gained 1.5%. The Dow surged 1.9%. The catalyst was Iran’s announcement that the Strait of Hormuz had reopened for non-Iranian commercial vessels, easing immediate concerns about energy-driven stagflation.
The pattern across the three sessions tells the story. Markets rallied on any de-escalation headline but demonstrated no conviction. ING analysts observed that “apparent de-escalation rapidly shifted to re-escalation,” a dynamic that suggests the next negative catalyst could reverse gains quickly.
Three-day chronology:
ING Analysts: “Apparent de-escalation rapidly shifted to re-escalation.”
Oil price movements have become the primary driver of equity sentiment since the conflict began in late February. Brent crude traded around $98 per barrel on 22 April, having briefly surpassed $100 earlier in the week. WTI crude traded near $90 per barrel. The $85-100 range has become the transmission mechanism through which geopolitical risk flows into stock prices.
For readers wanting to understand the transmission mechanism linking oil prices to broader inflation, our dedicated guide to why energy prices control inflation in 2026 examines how crude price movements cascade through transportation, manufacturing input costs, and consumer goods pricing across the entire economy.
The IEA April 2026 oil market analysis of Strait of Hormuz supply disruptions tracks the physical impact of the naval blockade on global crude flows, with detailed data on the reduction in Persian Gulf exports and the resulting inventory draws across OECD countries that underpin the price moves observed during the 20-22 April volatility window.
Investment bank forecasts reveal genuine uncertainty about where prices settle. Goldman Sachs trimmed its Q2 2026 Brent forecast to $90 per barrel from $99, but warned that risks remain skewed to the upside. If the ceasefire fails and persistent Middle East production losses reach approximately two million barrels per day, Brent could average $115 in Q4. If the Strait remains mostly shut for another month, Brent could average $120 in Q3 and $115 in Q4.
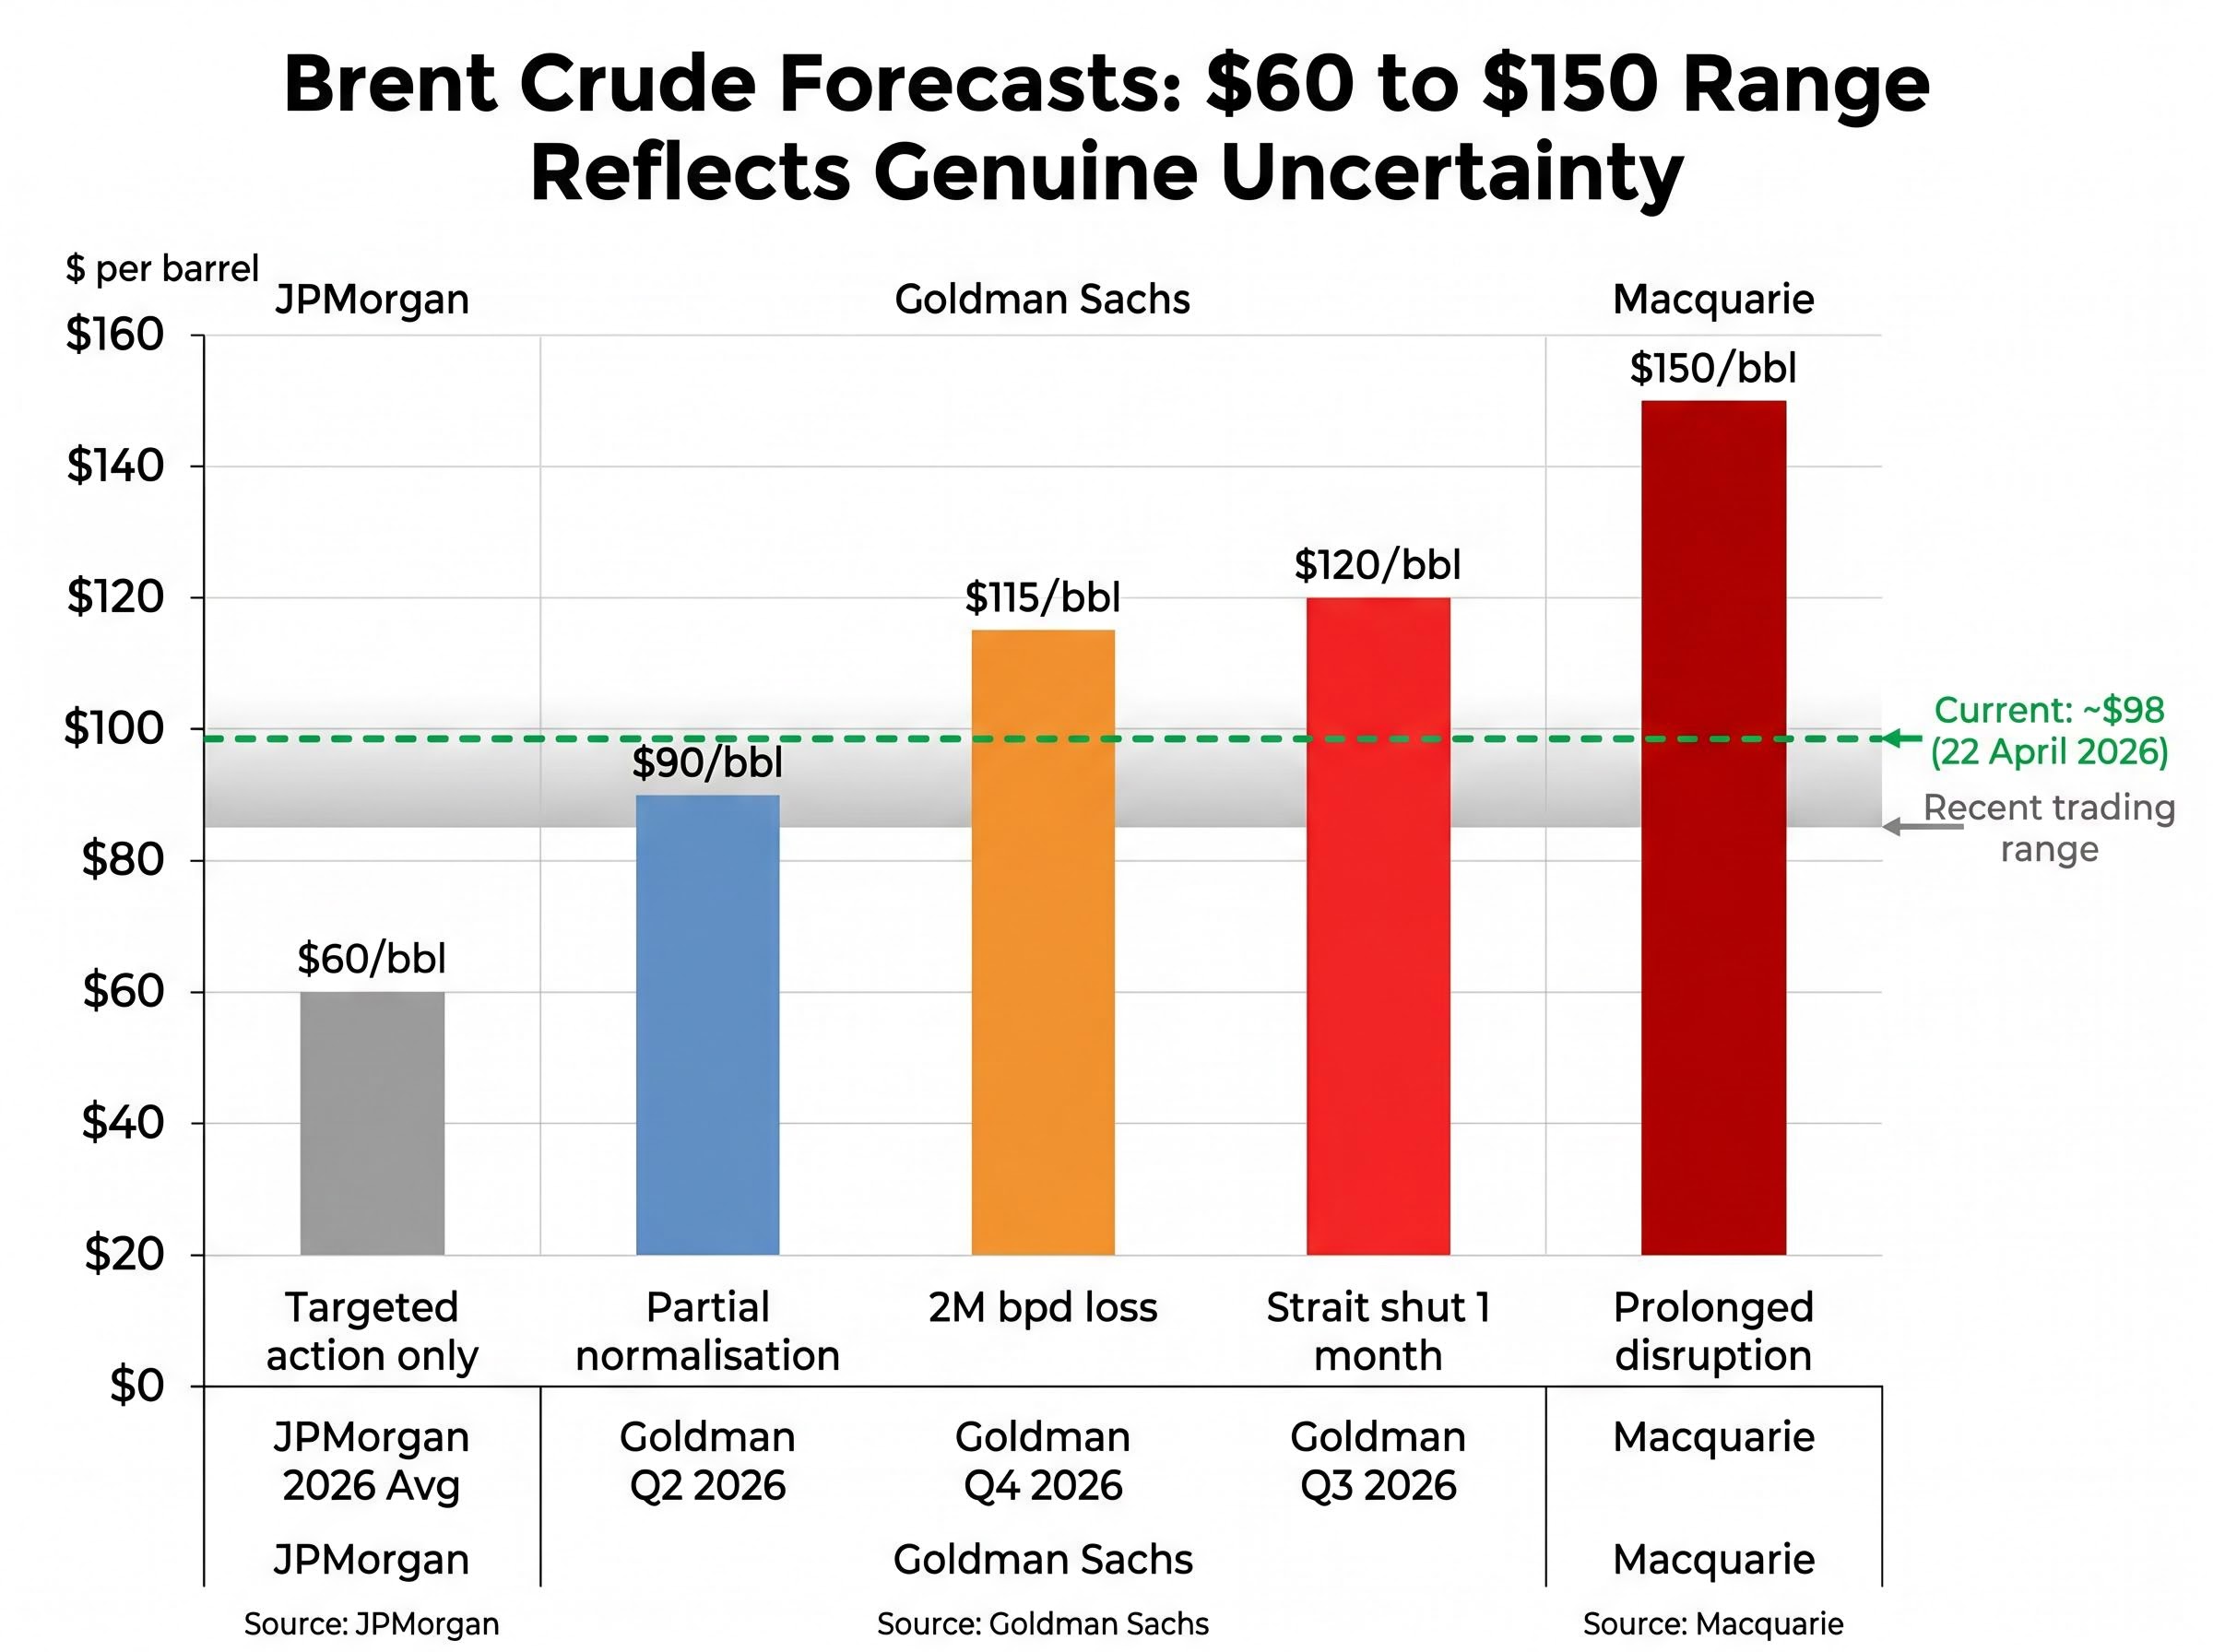
JPMorgan takes a bearish long-term view, expecting Brent to average around $60 per barrel for 2026 overall despite the recent spike. Natasha Kaneva, head of Global Commodities Strategy, noted that “oil surplus was visible in January data and is likely to persist.” JPMorgan does not anticipate protracted oil supply disruptions and expects any military action to be targeted, avoiding Iran’s oil infrastructure.
Macquarie expects crude prices to stay supported in the $85-90 range, with a gradual move towards $110 as flows normalise. However, if disruptions continue through April, Brent could spike to $150 per barrel.
Even a diplomatic resolution would not immediately normalise oil flows. 61 non-Iran-related supertankers are currently trapped inside the Persian Gulf. 50 of these vessels are laden with cargoes of up to two million barrels each. The backlog will take considerable time to clear.
| Bank | Scenario | Brent Forecast | Key Assumption |
|---|---|---|---|
| Goldman Sachs | Q2 2026 Base | $90/bbl | Partial normalisation |
| Goldman Sachs | Q4 2026 Upside | $115/bbl | 2M bpd production loss |
| Goldman Sachs | Q3 2026 Strait Shut | $120/bbl | Strait mostly shut 1 month |
| JPMorgan | 2026 Average | $60/bbl | Targeted military action only |
| Macquarie | Prolonged Disruption | $150/bbl | Disruptions continue through April |
Goldman Sachs: “Risks to our price forecast are skewed to the upside.”
The divergence between Goldman’s upside scenarios and JPMorgan’s baseline forecast reflects a market that cannot price a binary geopolitical outcome. Equity volatility will persist until the oil market finds equilibrium.
March 2026 CPI jumped to 3.3%, up from 2.4% in February. That single data point changed everything. Stagflation refers to the simultaneous occurrence of rising prices and slowing economic growth, a scenario that forces central banks to choose between fighting inflation by raising rates and supporting employment by cutting rates. The Federal Reserve now faces exactly this dilemma.
Energy-driven inflation is particularly difficult to address with monetary policy because it stems from supply disruption rather than excess demand. The Fed cannot drill more oil or reopen the Strait of Hormuz. Traditional rate hikes that cool demand do little to address supply-side price shocks, yet if energy costs become embedded in wage-setting behaviour, the inflationary spiral becomes structural.
The Fed’s March meeting minutes reveal policymakers explicitly discussing this risk. “Several participants noted a prolonged conflict in the Middle East would likely lead to more persistent increases in energy prices and that these higher input costs would be more likely to pass through to core inflation.” Front-month crude oil futures increased approximately 50% over the intermeeting period. Longer-dated futures rose less, suggesting market expectations that most of the increase would be relatively short-lived, but the risk of pass-through to core inflation remains.
Fed rate cut expectations reversed in March 2026 as oil-driven inflation forced markets to reprice the policy trajectory from anticipated easing to rate holds through year-end.
The Federal Reserve March 2026 FOMC minutes on Middle East inflation risks document the shift in central bank thinking, with several participants noting that a prolonged conflict would likely lead to more persistent increases in energy prices and that these higher input costs would be more likely to pass through to core inflation.
KPMG Chief Economist Diane Swonk warned that “the only clear way out of stagflation is a deep recession.” She noted the Iran conflict has driven multiple supply shocks extending well beyond energy and crude oil. “The closing of the Strait of Hormuz is more than an oil shock,” Swonk said, pointing to flows of other critical economic inputs like helium and fertiliser that also pass through the Strait.
The Fed’s policy dilemma:
KPMG Chief Economist Diane Swonk: “The closing of the Strait of Hormuz is more than an oil shock.”
The minutes state that “many participants pointed to the risk of inflation remaining elevated for longer than expected amid a persistent increase in oil prices, which could call for rate increases to help bring inflation down to the Committee’s 2 percent objective and keep longer-term inflation expectations firmly anchored.” This language signals a meaningful shift from the rate-cut expectations that dominated early 2026.
Markets have responded accordingly. Two-year nominal Treasury yields increased, driven primarily by higher inflation compensation. The market-implied expected path for the federal funds rate moved higher, largely reflecting a shift in anticipated timing of easing toward the end of the year. Investors now price in a rate hold for the remainder of 2026 rather than previously anticipated cuts.
If energy-driven inflation becomes embedded in wage-setting behaviour, the policy response will likely involve rate hikes that further pressure equity valuations. The San Francisco Federal Reserve has already revised down growth projections for the first half of 2026, reflecting the impact of higher oil prices on real incomes and economic activity.
Cleveland-Cliffs reported a narrower-than-expected loss for Q1 2026, posting EPS of -$0.40 against a forecast of -$0.41. The stock fell 10.17% in premarket trading to $8.93, hovering near its 52-week low of $5.63. The company beat earnings, yet the stock cratered. High energy costs were explicitly identified as an operational challenge, and investors focused on forward-looking concerns rather than the marginal beat.
UnitedHealth delivered a different outcome. Adjusted EPS came in at $7.23, beating the $6.59 forecast by 9.7%. Total revenues reached $111.7 billion, exceeding the $109.44 billion forecast by 2.07%. UnitedHealthcare earnings from operations jumped 9% year-over-year to $5.7 billion. The stock rose 8.83% in premarket trading to $352.04.
The contrast is sharp. Cleveland-Cliffs beat estimates but saw its stock fall because energy cost exposure undermines forward earnings power. UnitedHealth beat estimates and rallied because its business model is positioned to absorb or pass through cost inflation. Sector positioning now matters more than the earnings number itself.
Tesla delivered 358,023 vehicles in Q1 2026, missing the consensus of 365,645 by approximately 7,600 units. Energy storage deployment registered 8.8 GWh, a 38% drop from Q4 2025’s record 14.2 GWh and well below analyst consensus of 12-14 GWh. The energy storage weakness is particularly concerning given current energy dynamics and suggests either weakened demand for storage products or supply chain disruptions constraining production.
| Company | EPS vs. Forecast | Stock Reaction | Key Concern |
|---|---|---|---|
| Cleveland-Cliffs | -$0.40 (beat -$0.41) | -10.17% to $8.93 | High energy costs undermine forward earnings |
| UnitedHealth | $7.23 (beat $6.59 by 9.7%) | +8.83% to $352.04 | Business model absorbs cost inflation |
| Tesla | Deliveries missed by 7,600 units | TBD (earnings 22 April) | Energy storage down 38% quarter-on-quarter |
Tesla operational data:
Earnings beats no longer guarantee positive stock reactions. Investors must evaluate whether a company’s business model is positioned to absorb or pass through energy cost inflation. Management commentary on forward guidance now carries more weight than the reported numbers.
President Trump extended the ceasefire indefinitely on 22 April, stating he would do so “until such time as their leaders and representatives can come up with a unified proposal.” He described the Iranian administration as “seriously fractured.” The extension sounds like progress. It is not.
The broader timeline of the Hormuz crisis entering its seventh week reveals a pattern of escalation-deescalation cycles that have whipsawed markets since late February, with each apparent diplomatic breakthrough collapsing within days.
The naval blockade remains in place. Trump stated “the US will not lift the Hormuz blockade until a deal is made,” demanding Iran give up its uranium stockpile and end attempts to control the strategic waterway. Iran’s UN envoy Amir-Saeid Iravani responded that “blockading Iranian ports is an act of war and thus a violation of the ceasefire.”
Vice President JD Vance was scheduled to travel to Islamabad on 22 April to participate in negotiations with Iranian representatives. The trip was cancelled after Iranian leadership failed to commit to participating in talks. Iran skipped the peace talks in Pakistan entirely. A White House official confirmed: “In light of President Trump’s TRUTH Social post confirming the United States is awaiting a unified proposal from the Iranians, the trip to Pakistan will not be happening today.”
Physical disruption to shipping traffic remains severe. Only 3 ships passed through the Strait of Hormuz in the 24 hours ending 21 April. U.S. Central Command had directed 27 vessels to turn around or return to Iranian ports since the blockade began. The Strait typically carries approximately 20% of global oil and liquefied natural gas supplies.
One limited exception has emerged. The first Iraqi-laden crude tanker transited the Strait on 5 April, the first since 28 February. The cargo was expected to discharge at Malaysia’s Pengerang refinery on 18 April. Iraq’s State Organisation for Marketing of Oil requested lifting schedules from buyers on 22 April, noting all loading terminals including Basrah were “fully operational.” However, Iraq has shut in approximately 3.4 million barrels per day of crude production from a pre-conflict level of 4.25 million bpd. Iran appears to have granted Iraq a de facto exemption for oil shipments, likely contingent on payment of a transit fee.
U.S. position vs. Iranian position:
President Trump: “The US will not lift the Hormuz blockade until a deal is made.”
The ceasefire extension sounds like progress, but the naval blockade and collapsed talks mean the fundamental dispute remains unresolved. Markets rallied on the headline. The underlying conditions for another selloff persist.
The 20-22 April volatility demonstrated how geopolitical headlines now dominate equity price action, with the Strait of Hormuz status functioning as a real-time sentiment indicator. Oil prices in the $85-100 range reflect unresolved binary risk. The wide dispersion of bank forecasts, from JPMorgan’s $60 per barrel long-term expectation to Macquarie’s $150 spike scenario, signals genuine uncertainty about both the duration of geopolitical tensions and the timeline for normalisation of global energy flows.
The Fed is cornered by supply-side inflation it cannot easily combat without risking recession. March CPI jumping to 3.3% has shifted market expectations from rate cuts to rate holds. If energy-driven inflation becomes embedded in wage-setting behaviour, rate hikes become the likely policy response, further pressuring equity valuations.
Corporate earnings are diverging based on energy exposure. Cleveland-Cliffs beat estimates yet fell 10.17% on energy cost concerns. UnitedHealth beat estimates and rose 8.83% on business model resilience. Stock selection is critical in this environment. Investors must evaluate whether management can absorb or pass through input cost inflation rather than focusing solely on reported numbers.
Monitor diplomatic developments closely. The ceasefire extension without blockade removal is an unstable equilibrium. Watch for signs of oil price stabilisation below $90 as a potential signal that the worst supply fears are being priced out. Evaluate portfolio exposure to energy-intensive sectors and consider whether current holdings can pass through input cost inflation. The market’s trajectory in the coming weeks will be determined primarily by developments in U.S.-Iran relations and the Strait of Hormuz situation.
For investors seeking to position portfolios for continued geopolitical uncertainty, our comprehensive walkthrough of what investment strategies work during market volatility in 2026 examines sector rotation approaches, options strategies for downside protection, and cash allocation frameworks that remain effective when traditional diversification breaks down.
This article is for informational purposes only and should not be considered financial advice. Investors should conduct their own research and consult with financial professionals before making investment decisions.
The selloff was triggered by reports that the Trump administration had seized an Iranian crude oil tanker, the M/T Tifani, carrying approximately two million barrels of oil, which sent Dow futures down 313 points and pushed investors toward commodities.
Stagflation is the simultaneous occurrence of rising prices and slowing economic growth, which forces the Federal Reserve to choose between raising rates to fight inflation or cutting rates to support employment, creating uncertainty that pressures equity valuations.
Markets recovered sharply on 22 April after Iran announced the Strait of Hormuz had reopened for non-Iranian commercial vessels, with the S&P 500 rising 0.52%, the Nasdaq 100 gaining 1.5%, and the Dow surging 1.9%.
Oil prices in the $85-100 range act as a transmission mechanism for geopolitical risk, driving up inflation through transportation and manufacturing costs, which in turn pressures corporate earnings and shifts Federal Reserve rate policy expectations.
Energy-intensive industries face the greatest headwinds, as demonstrated by Cleveland-Cliffs falling 10.17% despite beating earnings estimates, while companies with resilient business models like UnitedHealth rose 8.83% by absorbing or passing through cost inflation.


