Most dividend investors spend more time picking individual stocks than they spend asking the one question that determines whether their income plan actually works: will this portfolio generate enough cash by the time I need it?
The answer depends on two numbers almost no individual investor calculates before building a portfolio: weighted average yield and weighted average dividend growth rate. These two figures, combined with a target income goal and a time horizon, reveal whether a current allocation is structurally capable of producing the income required, or whether it is quietly drifting toward a shortfall. Dividend portfolio modelling is the process of calculating both figures across a mixed set of holdings, interpreting what they mean at different life stages, and stress-testing the results against a specific dollar target. This guide walks through that process step by step, using worked examples, real ETF data, and a framework that applies whether retirement is five years away or thirty.
The two numbers that determine whether your dividend plan works
Every dividend portfolio produces two outputs that matter: what it pays today and how fast that payment grows. The first is captured by weighted average yield, a single figure that blends the current yield of every holding according to its portfolio weight. The second is weighted average dividend growth rate, the same weighted calculation applied to each holding’s historical rate of distribution growth. Together, they answer a deceptively simple question: if this portfolio compounds at these rates, will it reach my income target by the time I need the money?
Without a specific income target, allocation decisions become arbitrary. A $60,000 annual income goal on a $1 million portfolio, for example, requires a 6% weighted average yield at the point of retirement, or a lower starting yield paired with enough growth to reach that figure over time. The choice between those two paths is what Charles Schwab’s Kevin J. Freeman described as “income now vs. income later” (Schwab Insights, April 2024).
The capital required to live off dividends varies sharply with portfolio yield: generating $60,000 annually requires anywhere from $1.5 million to $3 million depending on the blend of holdings, and Social Security income can cut that figure substantially if factored into the model from the outset.
The life-stage implications are direct. Research from Seeking Alpha’s life-stage modelling framework (February 2025) shows a younger investor in their 30s might target a yield of roughly 2-2.5% with an expected dividend growth rate near 9-10%, prioritising compounding over current cash flow. A retiree, by contrast, needs a starting yield in the 4-6% range with more modest growth, because the income must begin immediately.
The CFA Institute discounted dividend valuation framework establishes that a stock’s intrinsic value is the present value of all future distributions, which is the theoretical basis for why dividend growth rate carries more long-run weight than current yield in a portfolio designed to compound income over a 20-30 year horizon.
| Metric | What it measures | Who should prioritise it |
|---|---|---|
| Weighted average yield | The blended current income a portfolio produces today, expressed as a percentage of total value | Retirees and near-retirees who need income now |
| Weighted average dividend growth rate | The blended annual rate at which portfolio distributions are expected to increase over time | Younger investors with 20+ year horizons who need income later |
Understanding these two metrics is the foundation. The next step is calculating them for a real portfolio.
When big ASX news breaks, our subscribers know first
How to calculate weighted average yield and growth rate across a mixed portfolio
The arithmetic is straightforward. A free weighted average calculator found through a basic internet search is sufficient; no paid software is required. The process follows five steps.
- List every holding in the portfolio alongside its allocation as a percentage of total value.
- Find each holding’s current yield (trailing twelve-month distribution yield or 12-month distribution rate, depending on the issuer’s terminology).
- Multiply each holding’s allocation percentage by its current yield. This produces the holding’s weighted yield contribution.
- Sum all weighted yield contributions. The result is the portfolio’s weighted average yield.
- Repeat steps 2-4 using each holding’s estimated 10-year annualised dividend growth rate instead of current yield.
The yield calculation is the simpler of the two, because current yield figures are published on every issuer’s fact sheet. The growth rate calculation is where the process gets harder.
Where to find yield and growth data for common holdings
Current yield data is available directly from issuer pages, though the terminology varies. Schwab reports a “Distribution Yield (TTM)” for SCHD of 3.29% as of April 2026. J.P. Morgan Asset Management reports a “12-month rolling distribution yield” for JEPI of 8.40% as of March 2026. Invesco reports a “12-Month Distribution Rate” for DJD of 2.43% as of May 2026. Each label measures a slightly different slice of the same concept, but all serve as reasonable current-yield inputs.
Dividend growth rates are a different matter. Ten-year annualised dividend growth rates for SCHD, JEPI, JEPQ, and DJD are not published as named metrics by issuers, Morningstar, or ETF.com. Morningstar and Dividend.com can serve as starting points for deriving a historical proxy from raw distribution data, but the figure will be an estimate, not an official metric. For newer funds like JEPI (launched 2020) and JEPQ (launched 2022), no 10-year history exists at all.
Assumptions used in place of published growth rates must be clearly labelled and stress-tested. A historical proxy is a planning input, not a guarantee.
The modelling examples later in this guide use approximately 10% growth for SCHD, approximately 9% for DJD, and approximately 3% for JEPQ, all drawn from historical distribution data and explicitly flagged as assumptions rather than issuer-published figures.
Understanding what high yield actually costs you
A portfolio yielding 8% sounds better than one yielding 3%. The instinct is reasonable, and it is also the source of the most common modelling error individual investors make. Instruments offering yields significantly above market averages typically achieve those yields through financial engineering, specifically covered-call options strategies or leverage, rather than through underlying earnings growth. That distinction matters enormously, because financial engineering generates current income at the expense of future compounding.
Covered-call ETFs are the clearest case study. JEPI and JEPQ generate distributions from two sources: dividends paid by their underlying stock holdings and premiums collected from selling call options against those holdings. Option premium income rises when market volatility is elevated and falls when volatility normalises. The result is a distribution that fluctuates month to month rather than growing steadily.
Morningstar’s Daniel Sotiroff noted in July 2024 that covered-call ETF distributions are a direct function of volatility levels and are not guaranteed. Barron’s reported in September 2024 that the double-digit yields some investors observed during 2022-2023 reflected elevated volatility during that period and should be expected to decline as conditions normalise.
J.P. Morgan Asset Management (JEPI Prospectus, November 2024): Distribution amounts may be affected by market volatility and the level of option premiums. Distributions are not fixed and may vary or be zero in a given period.
Fidelity’s June 2024 guidance specifically warned that very high-yield closed-end funds and leveraged products carry sustainability risks for retirees. Yields in the 7-10% range typically require financial engineering rather than originating from underlying business earnings.
The practical implication for modelling is direct:
Covered call ETF selection turns on reinvestment capacity in ways that raw yield figures obscure: an investor spending distributions needs to screen for NAV stability and organic income ratios, while a reinvestor should prioritise total return relative to benchmark and out-of-the-money call strategies that preserve equity upside.
- Growth-oriented dividend holdings: Lower current yield (typically 1.5-3.5%), higher expected distribution growth (8-10% annually), suited to investors with long time horizons
- High-yield engineered income products: Higher current yield (7-11%), limited or zero expected distribution growth, suited to retirees supplementing income from other sources
- Appropriate investor profile: Growth holdings for accumulators; engineered income as a supplement (not a core) for retirees who understand the variability
Treating a 10% current yield as a stable, growing income stream is the modelling equivalent of planning a budget around overtime pay. It may arrive, but the model should not depend on it.
Building a portfolio for two different investors: worked examples from accumulation to retirement
Two portfolios, two investors, the same $1 million balance, and the same $60,000 income target. The numbers reveal why allocation decisions cannot be made by intuition alone.
The growth-oriented portfolio is designed for an investor in their 30s with a 20-40 year horizon before income is needed. The goal is not current income but maximum dividend growth compounding.
| Holding | Allocation | Current yield | Growth rate | Weighted yield |
|---|---|---|---|---|
| SCHD | 40% | 3.29% | ~10% | 1.32% |
| DJD | 50% | 2.43% | ~9% | 1.22% |
| Waste Management | 5% | ~1.5% | ~8% | 0.08% |
| Microsoft | 5% | ~0.85% | ~10% | 0.04% |
| Total | 100% | ~2.5% |
Weighted average yield: approximately 2.5%. Weighted average dividend growth rate: approximately 9.5%. That 2.5% starting yield is not the point; the 9.5% growth rate is. At that rate, distributions roughly double every seven to eight years.
The retiree portfolio tells a different story. A preliminary allocation of 40% SCHD, 10% EDV, and 40% dividend ETF produced a weighted yield of approximately 3.7%, generating only $37,000 annually, well short of the $60,000 target. The allocation had to be restructured.
| Holding | Allocation | Current yield | Growth rate | Weighted yield |
|---|---|---|---|---|
| SCHD | 40% | 3.29% | ~10% | 1.32% |
| JEPQ | 20% | ~11.16% | ~3% | 2.23% |
| JEPI | 15% | 8.40% | ~0% | 1.26% |
| DJD | 20% | 2.43% | ~9% | 0.49% |
| Closed-end fund | 5% | ~16% | 0% | 0.80% |
| Total | 100% | ~6.1% |
On a $1 million portfolio, a 6.1% weighted average yield produces approximately $61,000 in annual income, meeting the target.
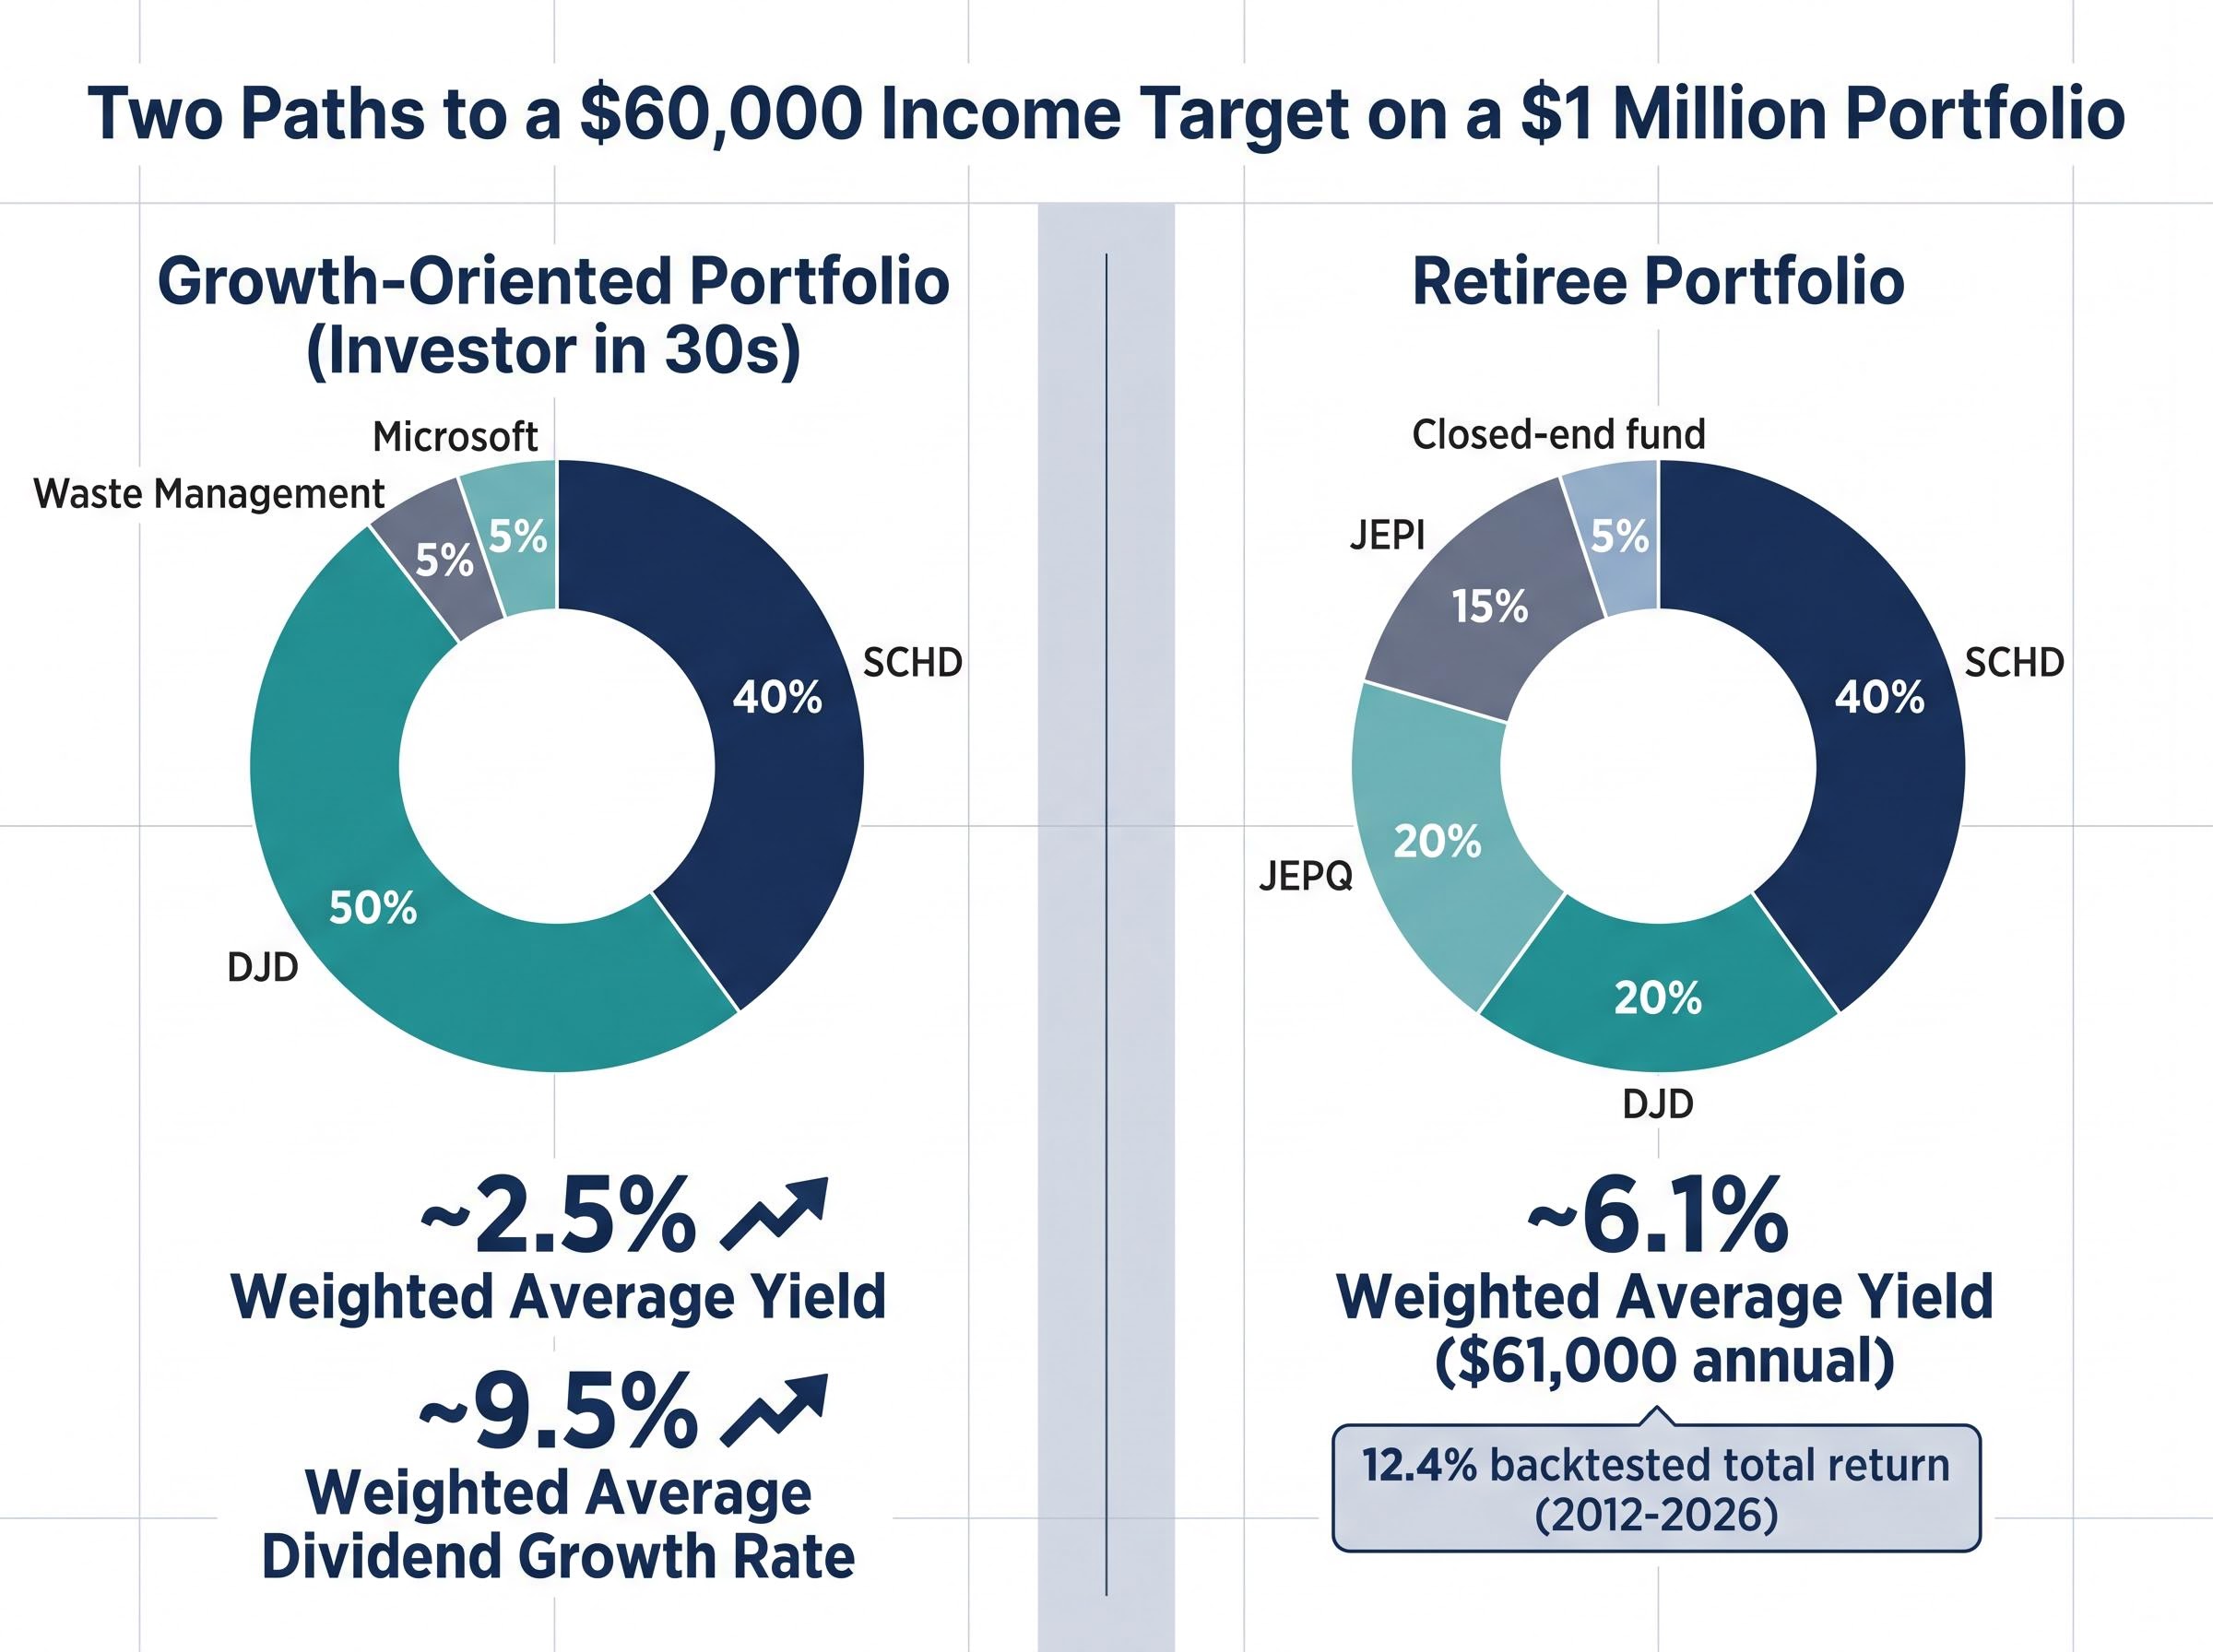
The backtested total return for this retiree-oriented portfolio, including distributions, came in at 12.4% over the 2012-2026 period. The modelling framework was inspired by Brad Ashcroft Green via Seeking Alpha and presented by channel host Jake.
The process is iterative. Investors who fall short of their income target after the first calculation have three levers:
Implicit sector concentration is a structural risk that weighted average yield calculations do not capture: high-dividend ETFs including VYM and SCHD allocate less than 6% to Technology while concentrating over 18-24% in Financials, creating a large sector bet that can skew a model’s growth rate assumptions without appearing in any yield figure.
- Accept reduced spending in retirement
- Extend working years to allow further portfolio accumulation
- Increase portfolio yield by incorporating higher-yielding assets
The model tells investors exactly how much each lever matters. That precision is the point.
Stress-testing your model and knowing when the numbers no longer hold
A model built on historical assumptions is a starting point, not a forecast. The value of the exercise is not the single output number; it is the ability to run the same calculation under worse conditions and see what happens.
Stress-testing a dividend model means reducing assumed growth rates below historical averages and recalculating income at retirement under slower-growth scenarios. It also means understanding what the 6% yield target in the worked example actually implies. That 6% figure exceeds standard safe withdrawal rate guidance, which clusters around 3.5-4% for a 30-year horizon according to Vanguard (February 2024) and Schwab (August 2024). T. Rowe Price (October 2024) recommends 3-5% with 4% as the central benchmark.
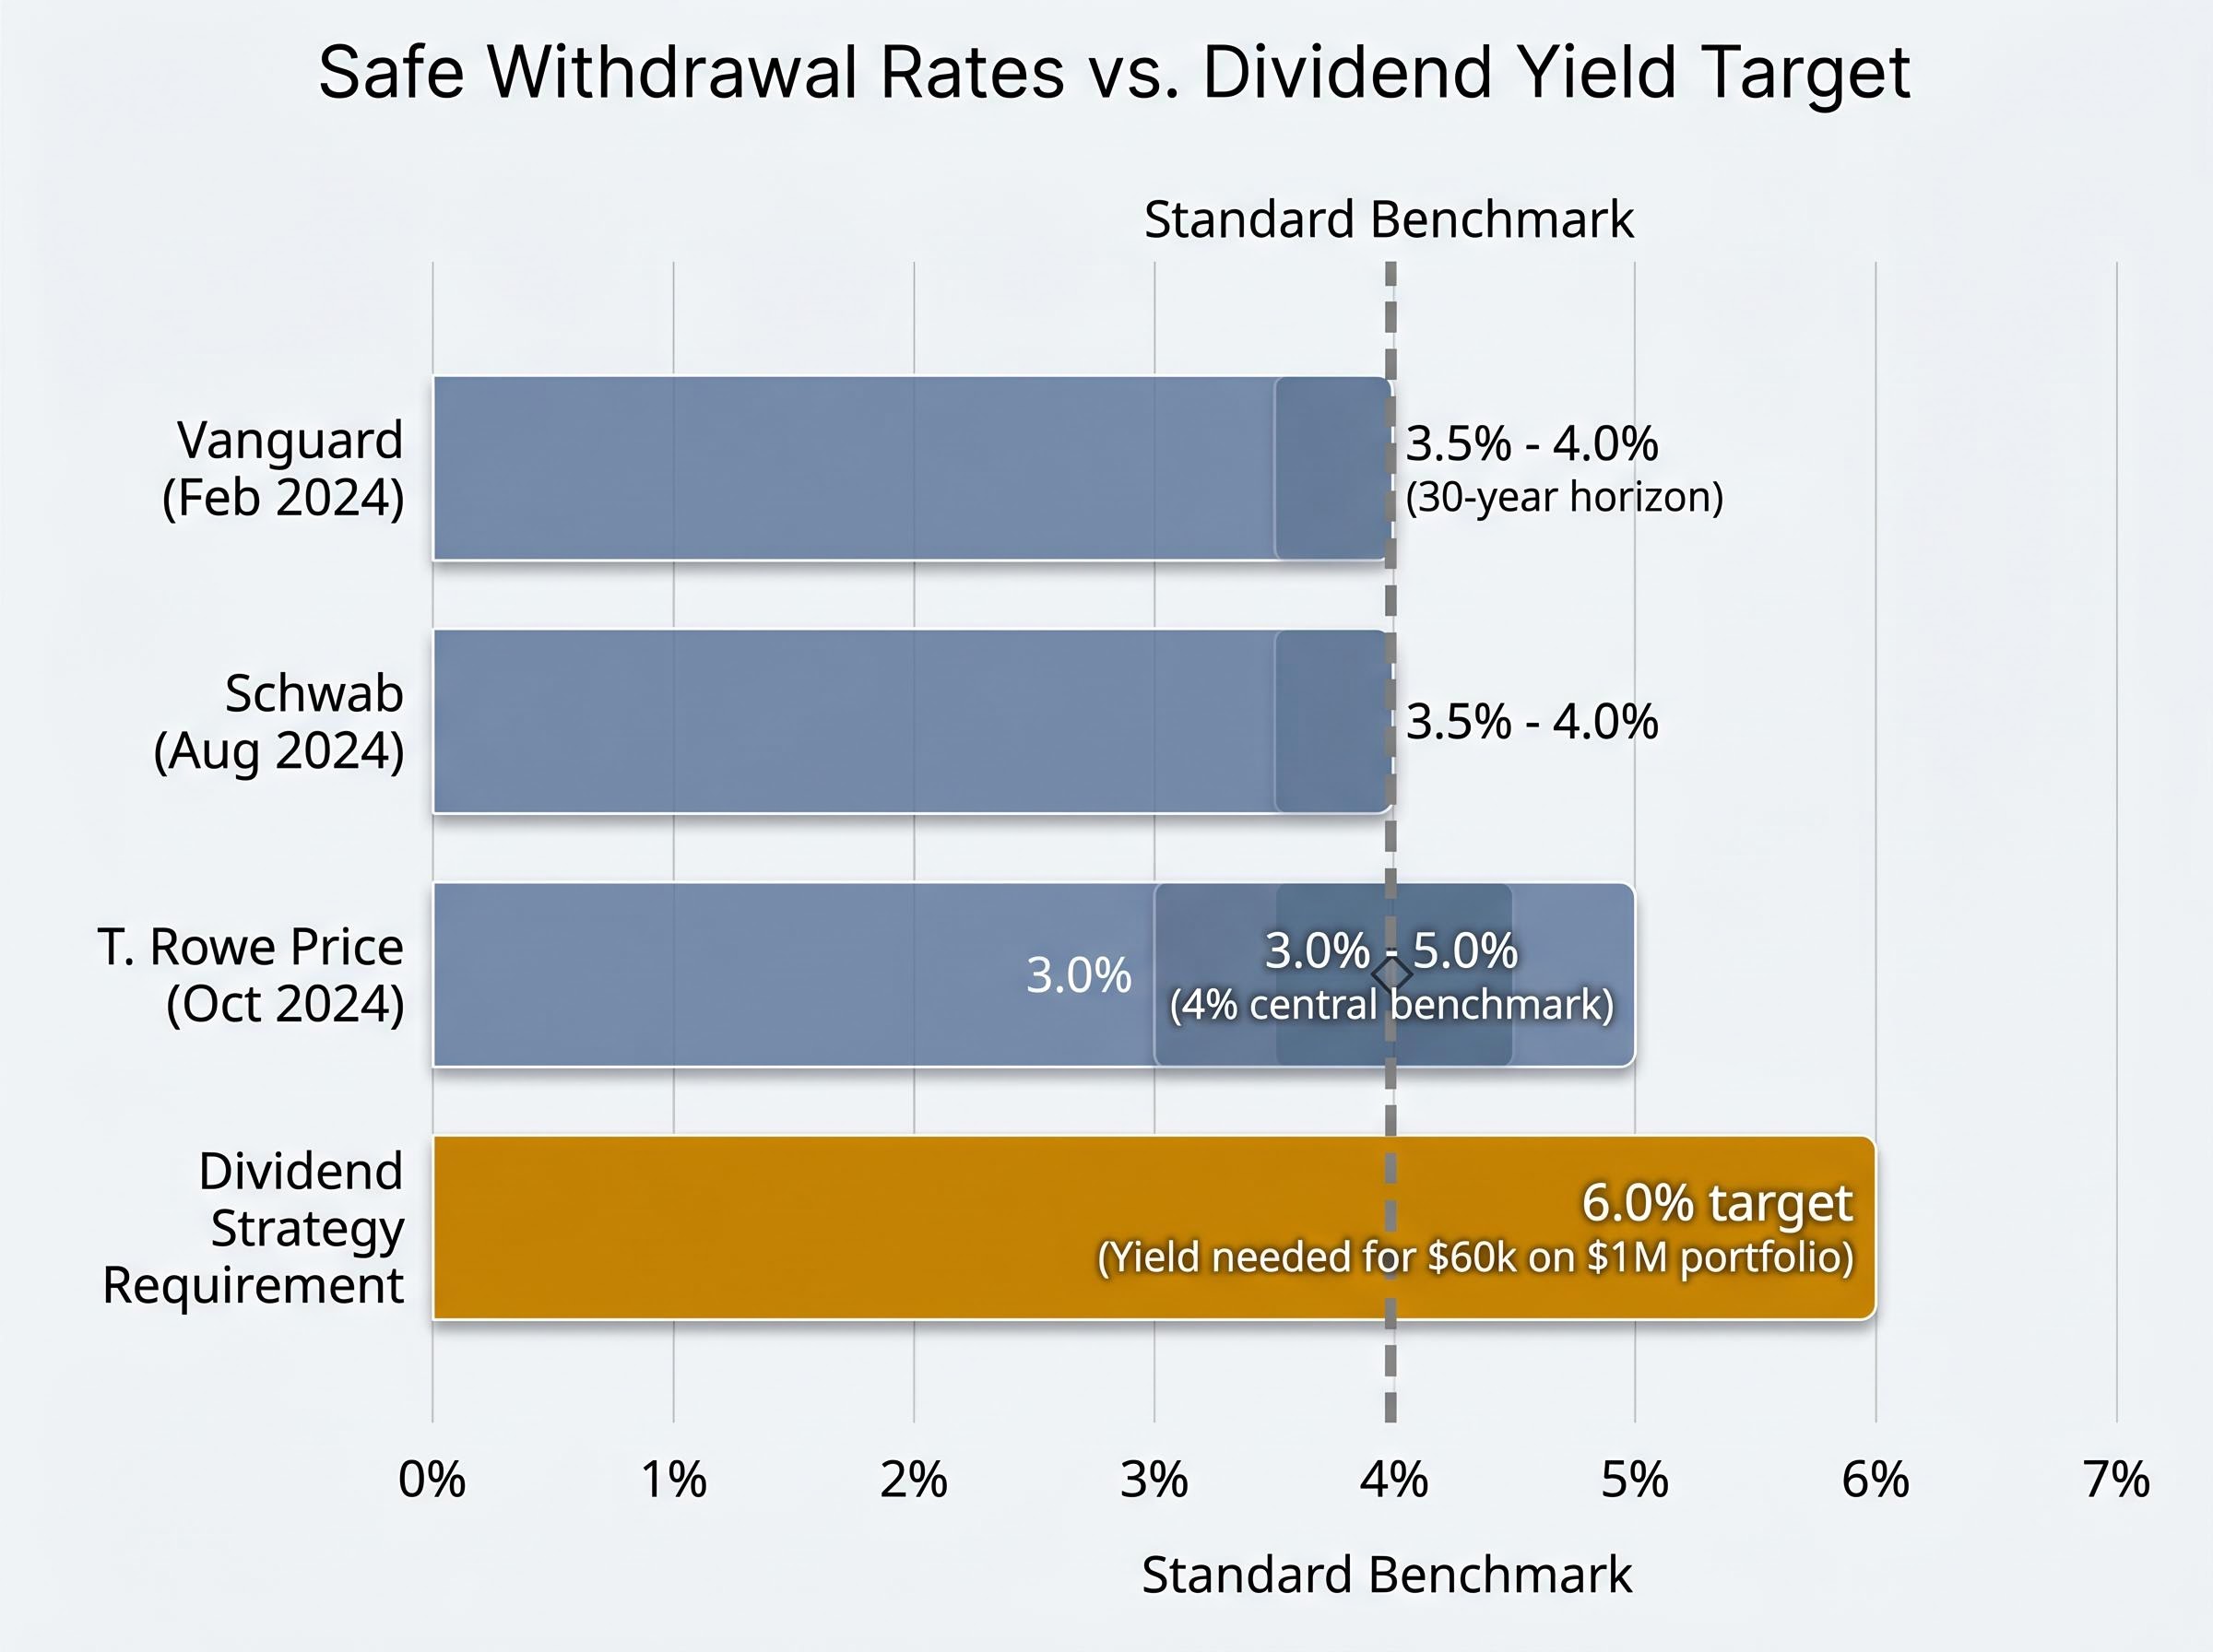
The distinction matters: a dividend yield coverage strategy draws income entirely from distributions without selling assets, while a total-return withdrawal framework assumes periodic asset sales to fund spending. The 6% model works only if distributions are sustained at that level.
Fidelity (March 2025) recommends targeting replacement of approximately 55-80% of pre-retirement income from savings plus Social Security, with 75-80% as a general planning figure. Any modelled income figure should be compared against this range.
The specific conditions under which model assumptions break down are identifiable. Prolonged low-volatility environments reduce covered-call ETF distributions, because option premiums decline with volatility. Dividend cuts during economic downturns reduce portfolio yield directly. Inflation erodes real income if growth rates do not keep pace with rising costs.
A practical stress-test checklist for your own model
Run these checks before treating any model output as a planning figure:
- Confirm that all growth rates used are historical proxies, not guarantees, and label them as such in any written plan
- Model a scenario where JEPI and JEPQ yields fall to 50% of their current levels, reflecting a sustained low-volatility environment
- Test whether the weighted average yield still meets the income target if the single largest holding cuts its dividend by 30%
- Reduce all growth rate assumptions by 3 percentage points and recalculate projected income at retirement
- Compare modelled annual income against Fidelity’s 55-80% income replacement range to verify the target itself is reasonable
If the model survives these scenarios with only modest shortfalls, the allocation is structurally sound. If the model collapses under any one of them, the portfolio is carrying concentration risk that the headline weighted average yield conceals.
The model is the starting point, not the answer
The act of building a dividend income model changes how an investor thinks about portfolio decisions, regardless of what the numbers say on day one. The process makes implicit assumptions explicit: which holdings are contributing income, which are contributing growth, and whether the blend produces enough of each to meet a specific target.
Morningstar’s Amy Arnott wrote in January 2025 that younger savers should focus on total return and dividend growth, while retirees may tilt toward higher current income but must consider payout sustainability. That life-stage distinction is the framework’s core. An accumulator with a 25-year horizon who weights growth rate heavily is making a structurally different bet than a retiree who weights current yield, and the model quantifies that difference.
The tools to start are free. Fidelity Retirement Income Planner projects future income streams using user-entered yield and growth assumptions. Vanguard Retirement Income Calculator models cash flow under varying withdrawal rates. Schwab Income Allocation Calculator balances current income against growth across ETFs, mutual funds, and bonds. Portfolio Visualizer allows historical backtesting and forward income projections using ticker weights. A basic weighted average calculator, available through any search engine, is sufficient for the core exercise.
The SEC Investor.gov free financial planning tools include government-backed calculators for retirement income planning, Social Security projections, and required minimum distributions, providing a no-cost starting point for investors building out the income modelling steps described above.
The sequence to begin is three steps:
- Calculate the portfolio’s weighted average yield using current holdings and issuer-reported data
- Calculate the weighted average dividend growth rate using historical proxies, clearly labelled as assumptions
- Compare projected annual income against a personal dollar target and adjust allocations where the model falls short
All assumptions are historical proxies and require periodic recalibration as market conditions, personal income needs, and portfolio composition change.
For investors who reach their income target through modelling but want to understand how to structure withdrawals to protect against sequence-of-returns risk in the early retirement years, our dedicated guide to the retirement bucket strategy covers bucket sizing based on income gaps, Bucket 1 liquidity instruments yielding 3.35-3.57% in 2026, and the transition timeline that prevents forced equity liquidation in a bear market.
This article is for informational purposes only and should not be considered financial advice. Investors should conduct their own research and consult with financial professionals before making investment decisions. Past performance does not guarantee future results. Financial projections referenced in this guide are subject to market conditions and various risk factors.