
A stock paying $0.63 per share in fully franked dividends looks very different depending on which assumptions feed into the valuation model. Change the growth rate from 2% to 4% and the estimated fair value can shift by thousands of dollars per hundred shares held. That sensitivity is the Dividend Discount Model in a nutshell: simple in theory, treacherous in practice.
For Australian retail investors, the DDM is one of the most commonly referenced valuation tools, and ASX bank stocks are the canonical teaching example. Banks pay large, predictable, fully franked dividends, a combination that makes them natural candidates for a dividend-based valuation approach. But Australian investors face a complication that most overseas DDM textbooks ignore: franking credits. Understanding how to handle them correctly is the difference between a disciplined estimate and a flattering illusion.
This guide explains how the Dividend Discount Model works, why ASX bank stocks are particularly suited to it, and how franking credits must be treated consistently to avoid overstating fair value. It then walks through a complete worked example using Bendigo and Adelaide Bank (ASX: BEN) and its confirmed FY2024 dividend, building an assumption matrix that produces a range of estimates rather than a false single number.
What the Dividend Discount Model actually does (and why banks are the ideal teaching example)
The DDM, in its most widely used form, is the Gordon Growth Model. It values a stock as the present value of all future dividends, compressed into a single formula:
P = D1 / (r – g)
D1 = next year’s expected dividend per share
r = the investor’s required return (cost of equity)
g = the assumed perpetual dividend growth rate
The formula only makes sense when dividends are the primary way a company returns value to shareholders. That requirement narrows the field considerably, and it is why ASX banks are the natural teaching example.
A stock makes a strong DDM candidate when it demonstrates:
- Consistent dividend payments over a long history
- A high payout ratio (most ASX banks sit at 70-80% or higher)
- Fully franked distributions
- A stable underlying earnings base with limited reinvestment complexity
BEN reported a full-year FY2024 dividend of $0.63 per share, fully franked, split between an interim of $0.30 and a final of $0.33. That confirmed figure anchors the worked example later in this guide. With major and regional ASX banks distributing the bulk of their earnings as dividends, the income stream itself becomes the dominant mechanism through which shareholders receive returns, precisely the condition under which a DDM produces its most meaningful output.
When big ASX news breaks, our subscribers know first
How franking credits change the equation for Australian investors
Most international DDM frameworks assume dividends are simply cash payments. In Australia, fully franked dividends carry attached imputation credits representing corporate tax already paid at the 30% company tax rate. For a tax-resident Australian investor who can fully utilise those credits, the effective pre-tax yield is materially higher than the cash dividend alone. Ignoring this, or handling it inconsistently, is where most retail DDM errors originate.
Two methodologically valid approaches exist for treating franking inside a DDM.
The ATO imputation system rules confirm that franking credits represent corporate tax already paid at the 30% company rate and can be used as a tax offset by eligible resident shareholders, which is why the grossed-up dividend calculation divides the cash amount by 0.70 rather than simply adding an arbitrary loading.
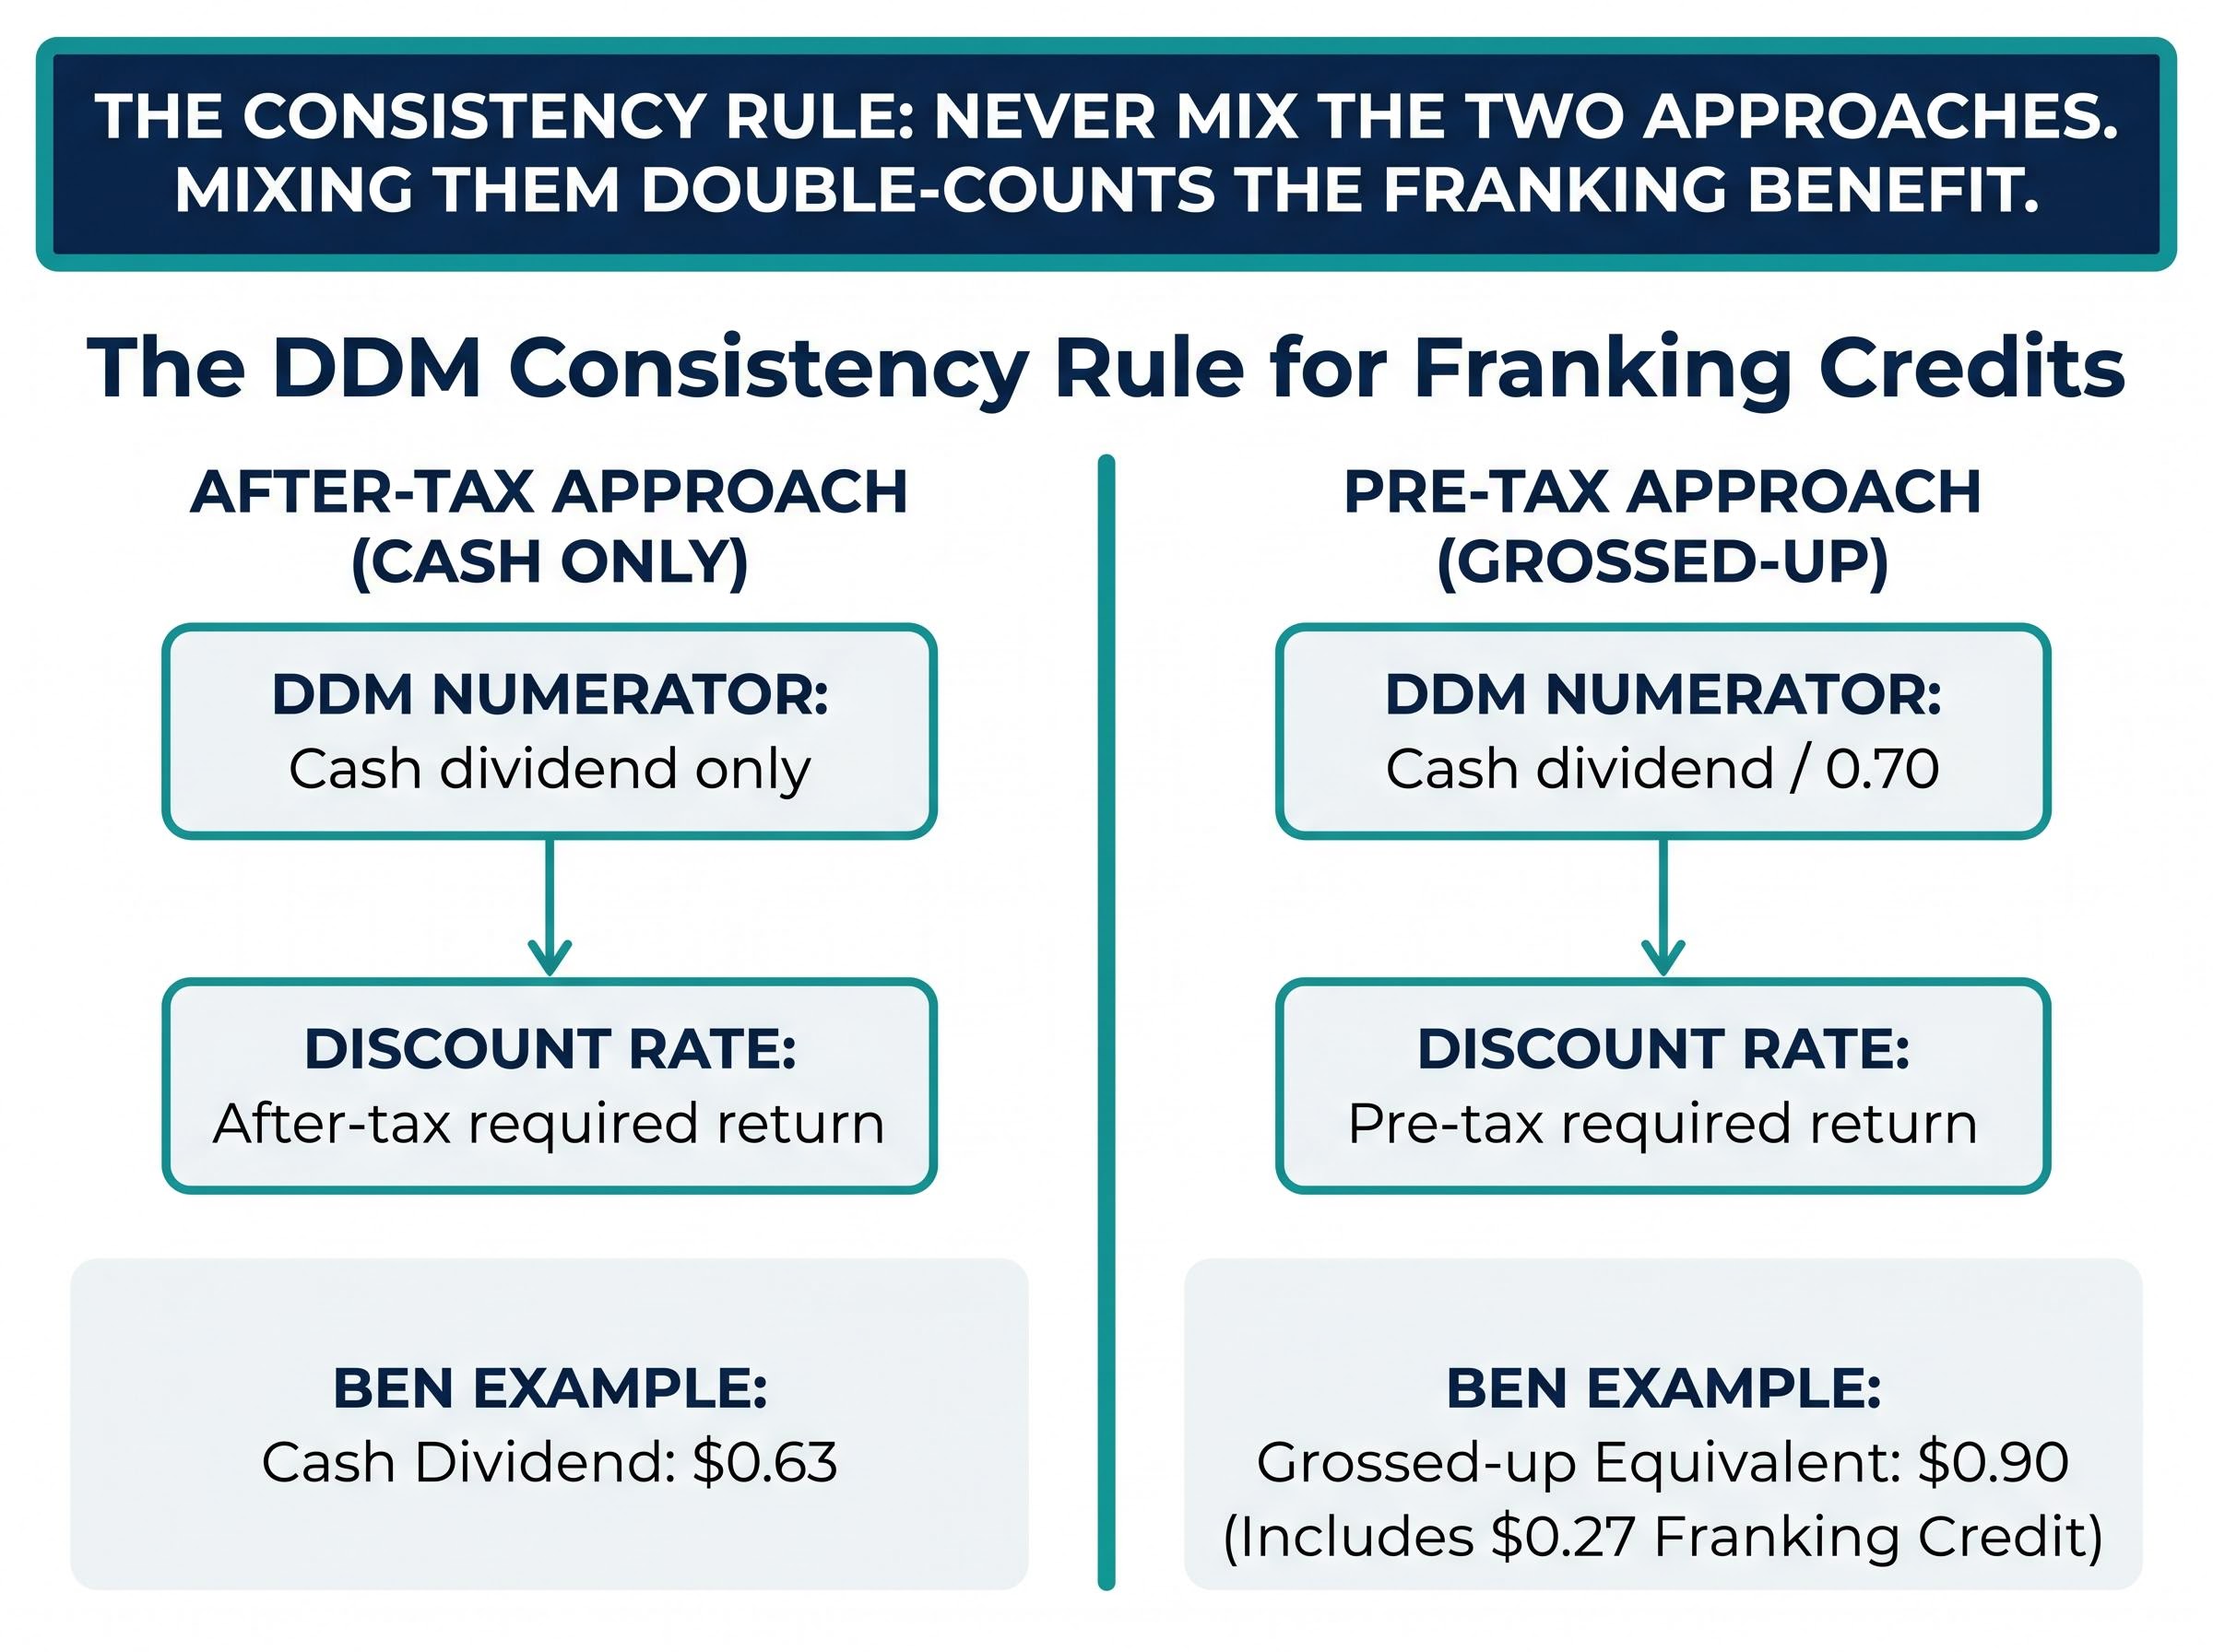
| Approach | DDM numerator (D1) | Discount rate (r) | Common mistake |
|---|---|---|---|
| After-tax (cash only) | Cash dividend only | After-tax required return | Using a pre-tax discount rate with a cash dividend |
| Pre-tax (grossed-up) | Cash dividend / 0.70 | Pre-tax required return | Using an after-tax discount rate with a grossed-up dividend |
Applied to BEN’s confirmed FY2024 figures: the cash dividend is $0.63 per share, the grossed-up equivalent is $0.63 / 0.70 = $0.90 per share, and the franking credit per share is $0.27.
The franking credit formula, cash dividend multiplied by 30 then divided by 70, reflects the 30% corporate tax rate already paid at the company level, and applying it correctly to BEN’s $0.63 cash dividend produces the $0.27 credit and $0.90 grossed-up figure used throughout this guide.
The consistency rule: A grossed-up dividend must be paired with a pre-tax required return. A cash dividend must be paired with an after-tax required return. Never mix the two. Mixing them double-counts the franking benefit and overstates fair value. This is the single most common retail investor error in Australian DDM applications.
Professional fund managers typically model after-tax cash flows rather than mechanically grossing up dividends. The reason is practical: investors face different marginal tax rates, and superannuation funds in accumulation phase, pension phase, and individual retail investors all derive different value from franking credits. A single grossed-up figure implies all investors benefit equally, which is not accurate. The after-tax approach avoids that assumption.
Choosing your inputs: growth rate, required return, and where investors go wrong
The DDM formula has only three inputs. Each one is a judgment call, and small changes in any of them produce large swings in the output. Understanding why requires working through each decision in sequence.
1. Dividend growth rate (g)
For mature ASX banks, professional consensus clusters around 2-3% as the practical ceiling for a conservative terminal growth rate. This range roughly aligns with long-run nominal GDP or inflation plus modest real growth.
The theoretically grounded anchor is the ROE times retention rate formula: g = ROE x (1 – payout ratio). For BEN, with a reported ROE of 7.9% and an approximate payout ratio of 75%, the calculation produces g = 7.9% x 0.25 = approximately 2.0%. Higher figures are not necessarily wrong, but they require specific justification beyond recent dividend history.
2. Forward dividend estimate (D1)
The next period’s expected dividend is derived from the confirmed base dividend adjusted for the assumed growth rate: D1 = D0 x (1 + g). For BEN, using a $0.63 base and a 2% growth assumption, D1 equals approximately $0.64.
3. Required return (r)
Setting a required return for an ASX regional bank
The required return represents an investor’s minimum acceptable return given the stock’s risk profile. It should sit above the risk-free rate (approximately the 10-year Australian government bond yield) by a margin reflecting equity risk. For ASX regional banks, indicative cost of equity figures from analyst commentary sit in the 9.5-10.5% range, with 10% as a reasonable working midpoint. Investors with different risk tolerances may reasonably use different figures within or around this range.
The denominator sensitivity is where discipline matters most. At r = 10% and g = 2%, the denominator (r – g) = 8%. Shifting g to 4% compresses the denominator to 6%, increasing the implied valuation by approximately 33% with no change to the dividend itself.
The CFA Institute discounted dividend valuation framework identifies the sensitivity of Gordon Growth Model outputs to small changes in the spread between the required return and the growth rate as one of the model’s defining characteristics, explaining why a two percentage point shift in g can move the estimated fair value by more than a third.
The circularity trap: Retail investors often select growth and return assumptions that make the DDM output match the current share price, which defeats the purpose of the model. DDM should produce an independent valuation estimate, not reverse-engineer a justification for the market price.
Building the assumption matrix: a worked example using Bendigo and Adelaide Bank
Rather than producing a single estimate and treating it as an answer, a disciplined DDM exercise builds an assumption matrix. This section uses BEN’s confirmed FY2024 dividend to demonstrate.
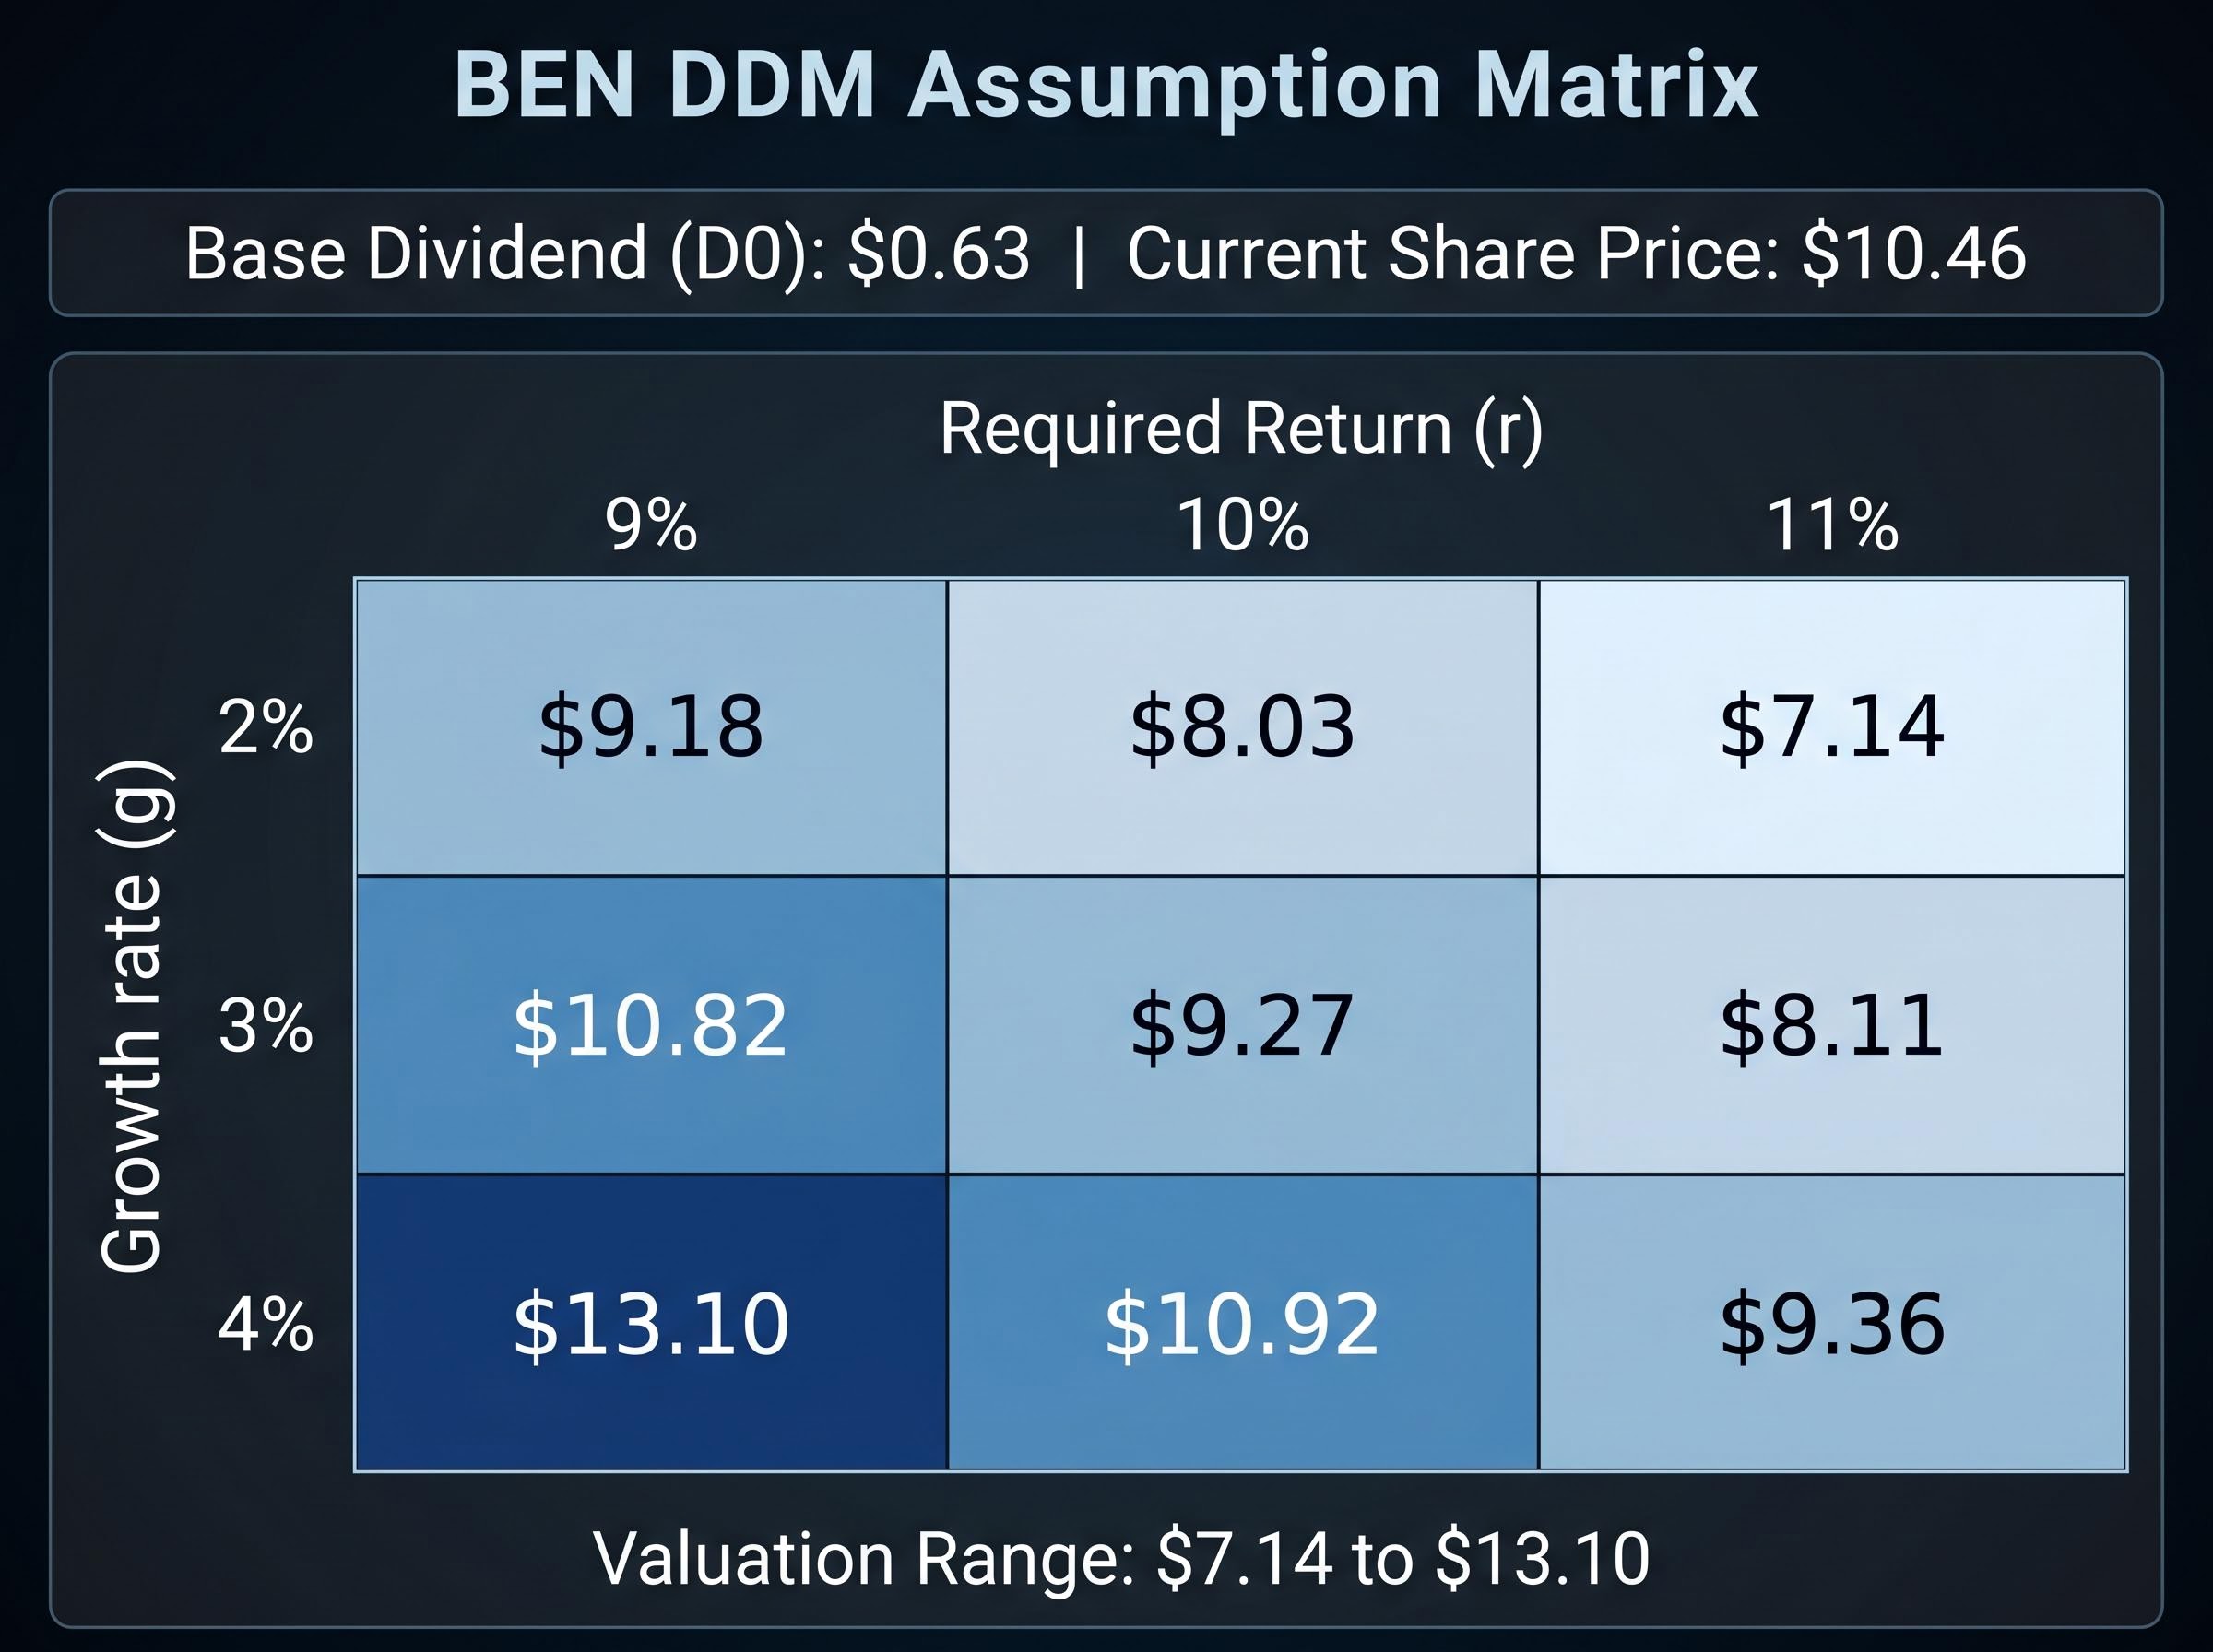
The base inputs: D0 = $0.63 per share (confirmed, fully franked). The worked example uses the cash dividend approach with an after-tax required return for methodological consistency. D1 is calculated as D0 x (1 + g) for each growth scenario.
The matrix below varies dividend growth rate across the rows (2%, 3%, 4%) and required return across the columns (9%, 10%, 11%), producing nine fair value estimates.
| Growth rate (g) | r = 9% | r = 10% | r = 11% |
|---|---|---|---|
| 2% | $9.18 | $8.03 | $7.14 |
| 3% | $10.82 | $9.27 | $8.11 |
| 4% | $13.10 | $10.92 | $9.36 |
The cash-dividend estimates range from approximately $7.14 to $13.10 depending on assumptions. Using a forward dividend of $0.65 and a broader assumption range, one Australian financial education source derived an average valuation of approximately $13.32 and a revised estimate of approximately $13.75. Separately, incorporating the grossed-up dividend of $0.90 produced an estimate of approximately $19.64 per share.
The grossed-up estimate of $19.64 uses pre-tax inputs throughout and must not be compared directly to the cash-dividend estimates. Mixing the two bases produces a meaningless comparison. If using the grossed-up approach, every input, including the required return, must be expressed on a pre-tax basis.
Relative to BEN’s share price of $10.46 at the time of initial analysis, several matrix cells suggest a potential valuation gap. That gap is a starting point for further investigation, not a buy signal. The width of the range, from $7.14 to $13.10 on a cash basis alone, demonstrates precisely why a single DDM estimate implies false precision.
What DDM cannot tell you about a bank stock (and what to check instead)
A valuation model that produces an attractively wide range of estimates can still mislead if its structural limitations go unexamined. The one-stage Gordon Growth Model assumes dividends grow at a fixed rate forever. Bank dividends do not behave this way. They are shaped by credit cycles, net interest margin movements driven by RBA rate decisions, and APRA capital adequacy requirements, none of which produce smooth perpetual growth.
The high payout ratio that makes a bank look attractive in a DDM can itself be a warning signal. A bank maintaining elevated distributions while ROE is declining may appear undervalued in the model while actually being in a structurally deteriorating position. BEN’s ROE of 7.9% sits below the indicative cost of equity range of 9.5-10.5%, a tension worth noting. A bank earning less than its cost of equity is, on an economic basis, destroying value, and a DDM with optimistic growth assumptions can obscure that dynamic entirely.
The NIM, ROE and CET1 framework functions as a practical pre-screen before applying a DDM, because a bank with deteriorating net interest margin or a CET1 ratio approaching regulatory minimums may show a superficially attractive DDM valuation while carrying risks that the income-stream model cannot capture.
APRA’s ‘unquestionably strong’ CET1 benchmarks add a further constraint. Capital adequacy requirements can cap payout ratios and therefore constrain dividend growth, directly affecting DDM inputs. During stress events, APRA has the authority to restrict dividend payments entirely.
A quick checklist before you trust the number
Before acting on any DDM output for a bank stock, the following checks provide a practical filter:
- Payout ratio stability: Is the current payout ratio sustainable given earnings? Look for the payout ratio trend in the annual report over three to five years. A rising ratio alongside flat or falling earnings is a concerning signal.
- CET1 capital adequacy: Is the CET1 ratio comfortably above APRA’s ‘unquestionably strong’ benchmark? BEN’s CET1 of 11.3% (most recent full year) sits below the sector average, warranting attention.
- Earnings per share coverage: Does EPS comfortably cover the dividend? If the dividend per share is approaching or exceeding EPS, the payout may not be sustainable. The ASX results announcement is the primary source.
- Bad and doubtful debt trends: Are provisions for credit losses trending upward? Rising bad debts erode the earnings base that supports dividends. Provision coverage ratios appear in the annual report’s credit quality disclosures.
- ROE versus cost of equity: Is the bank creating or destroying value? BEN’s ROE of 7.9% versus a sector average of 9.35% and an indicative cost of equity of 10% suggests value destruction on a pure economic basis, even as BEN’s net interest margin of 1.90% compares favourably to the major bank average of 1.78%.
The DDM is a starting point, not a verdict: using it well as an ASX investor
The reader who has worked through the formula, the franking treatment, the assumption matrix, and the pre-DDM checklist now has the foundation to position DDM within a broader valuation toolkit. Three complementary approaches add the most value:
Balance sheet valuation metrics, including non-performing loan ratios, deposit funding composition, and price-to-book multiples calibrated against sustainable ROE, provide the structural context that resolves ambiguity in a DDM output, particularly when the assumption matrix spans a wide range and a single fair value estimate cannot be defended.
- Price-to-book versus sustainable ROE framework: A bank earning ROE equal to its cost of equity should trade at approximately 1x book value. ROE above cost of equity justifies a premium; ROE below cost of equity implies the stock should trade at a discount. BEN’s ROE of 7.9% versus an indicative cost of equity of 9.5-10.5% illustrates this dynamic directly, suggesting that a valuation above book value would need to rest on an expectation of improving returns.
- Multi-stage DDM: For banks with uncertain near-term dividend paths, a two-stage model uses specific analyst or scenario estimates for a 3-5 year explicit forecast period before applying a conservative terminal growth rate of 2-3%. This avoids the one-stage model’s assumption that current conditions persist indefinitely.
- Excess return on equity (residual income) model: This professional complement makes visible what the DDM can obscure: whether the bank is creating or destroying value relative to its cost of capital. It explicitly ties value to the spread between ROE and cost of equity.
The assumption matrix built in the previous sections is the appropriate output of a DDM exercise. A single point estimate implies false precision. A range of estimates under different scenarios is what a disciplined investor actually produces and uses.
Putting it to work: your DDM template for the next ASX bank you assess
The complete DDM process, from confirmed dividend to defensible valuation range, follows six steps:
- Confirm the base dividend (D0) from the most recent ASX full-year results announcement, noting whether the dividend is fully franked, partially franked, or unfranked.
- Choose a franking treatment approach and apply it consistently. Use cash dividends with an after-tax required return, or grossed-up dividends with a pre-tax required return. Never mix the two.
- Set a growth rate anchored to the ROE x retention rate formula (g = ROE x (1 – payout ratio)) and cross-checked against inflation expectations and consensus earnings forecasts. For mature ASX banks, 2-3% is the conservative ceiling.
- Set a required return based on the risk-free rate plus an equity risk premium appropriate to the bank’s risk profile. For regional ASX banks, the indicative range is 9.5-10.5%.
- Build the assumption matrix across at least a 3×3 grid of growth and return combinations to capture the range of plausible outcomes.
- Run the pre-DDM checklist (payout ratio stability, CET1 adequacy, EPS coverage, bad debt trends, ROE versus cost of equity) before drawing any conclusion from the output.
The full BEN example parameters provide a summary reference: D0 = $0.63, growth range 2-4%, required return range 9-11%, resulting in a cash-basis valuation range of approximately $7.14 to $13.10 (with the grossed-up approach producing estimates up to approximately $19.64, using pre-tax inputs throughout).
The goal is not to produce a number that confirms a pre-existing view on any stock. The goal is to establish a range of defensible fair value estimates under different reasonable assumptions and compare those estimates to the current price as one input into a broader investment decision. DDM is especially well-suited to income investors valuing ASX bank stocks as dividend streams, but it remains a model built on assumptions and should be treated as a hypothesis to test, not a verdict to act on.
The DDM is a hypothesis-generating tool. The best investors use it to find questions, not answers.
The model rewards discipline, not optimism
The DDM’s sensitivity to small assumption changes is not a flaw. It is a feature that rewards careful input selection. Investors who understand why the formula is sensitive to (r – g) will anchor their assumptions more conservatively and produce more defensible estimates. A 2 percentage point shift in growth rate can move the output by a third. Knowing that is the first step toward using the model honestly.
For an ASX bank like BEN, where the assumption matrix suggests potential undervaluation relative to the current share price, the appropriate response is deeper fundamental investigation, examining earnings coverage, capital adequacy, and credit quality, rather than immediate action on the model output alone. A DDM number that looks attractive but sits alongside an ROE below cost of equity is asking a question, not providing an answer.
The investor who builds a 3×3 assumption matrix, runs the pre-DDM checklist, and positions DDM alongside a price-to-book sanity check is doing what professional analysts do, at a fraction of the cost of a subscription research service. That process, applied with discipline, is the skill this guide set out to deliver.
For investors who want to apply this framework to the broader ASX dividend-paying universe rather than a single bank stock, our full explainer on DDM and current ASX valuations examines how the ASX 200 yield of approximately 3.3% compares to its 10-year historical average, which sectors look stretched on an income-based valuation, and why the current rate environment complicates the required return assumptions used throughout this guide.
This article is for informational purposes only and should not be considered financial advice. Investors should conduct their own research and consult with financial professionals before making investment decisions. Past performance does not guarantee future results. Financial projections are subject to market conditions and various risk factors.