Every day in August 2026, the number of tankers clearing the Strait of Hormuz has been counted in the single digits. Before the Iran-US confrontation turned the world’s most critical oil chokepoint into a contested military zone, more than 120 vessels made that crossing daily.
That collapse in traffic has done something months of OPEC+ production negotiations could not: it has forced a structural risk premium into global crude benchmarks, lifting Brent toward $92 per barrel and pulling commodity-linked currencies, particularly the Canadian dollar, into an analytically complicated moment. The conventional view says higher oil prices mean a stronger CAD. The current evidence says it is considerably more complicated than that.
Here is the framework for reading that complexity in real time: the exact transmission channels connecting Hormuz shipping data to Canadian dollar positioning, where the oil-CAD relationship is holding, and the structural forces working against a clean rally.
What the Hormuz traffic collapse is telling oil markets
The numbers tell the story before any analysis does. Pre-conflict, the Strait of Hormuz handled roughly 120 daily vessel transits, the single most important artery for Persian Gulf crude and liquefied natural gas exports. That baseline has been obliterated.
- Reuters-documented worst days: only 3-9 commodity vessel crossings
- Separate reporting: around 14 daily transits recorded at one point, compared to a pre-conflict norm of 120 per day
- BBC and Lloyd’s List Intelligence: weekly traffic down approximately two-thirds from pre-escalation levels
- Maritime intelligence firms: days when only 4-5 large vessels were tracked, with others halted or turning back
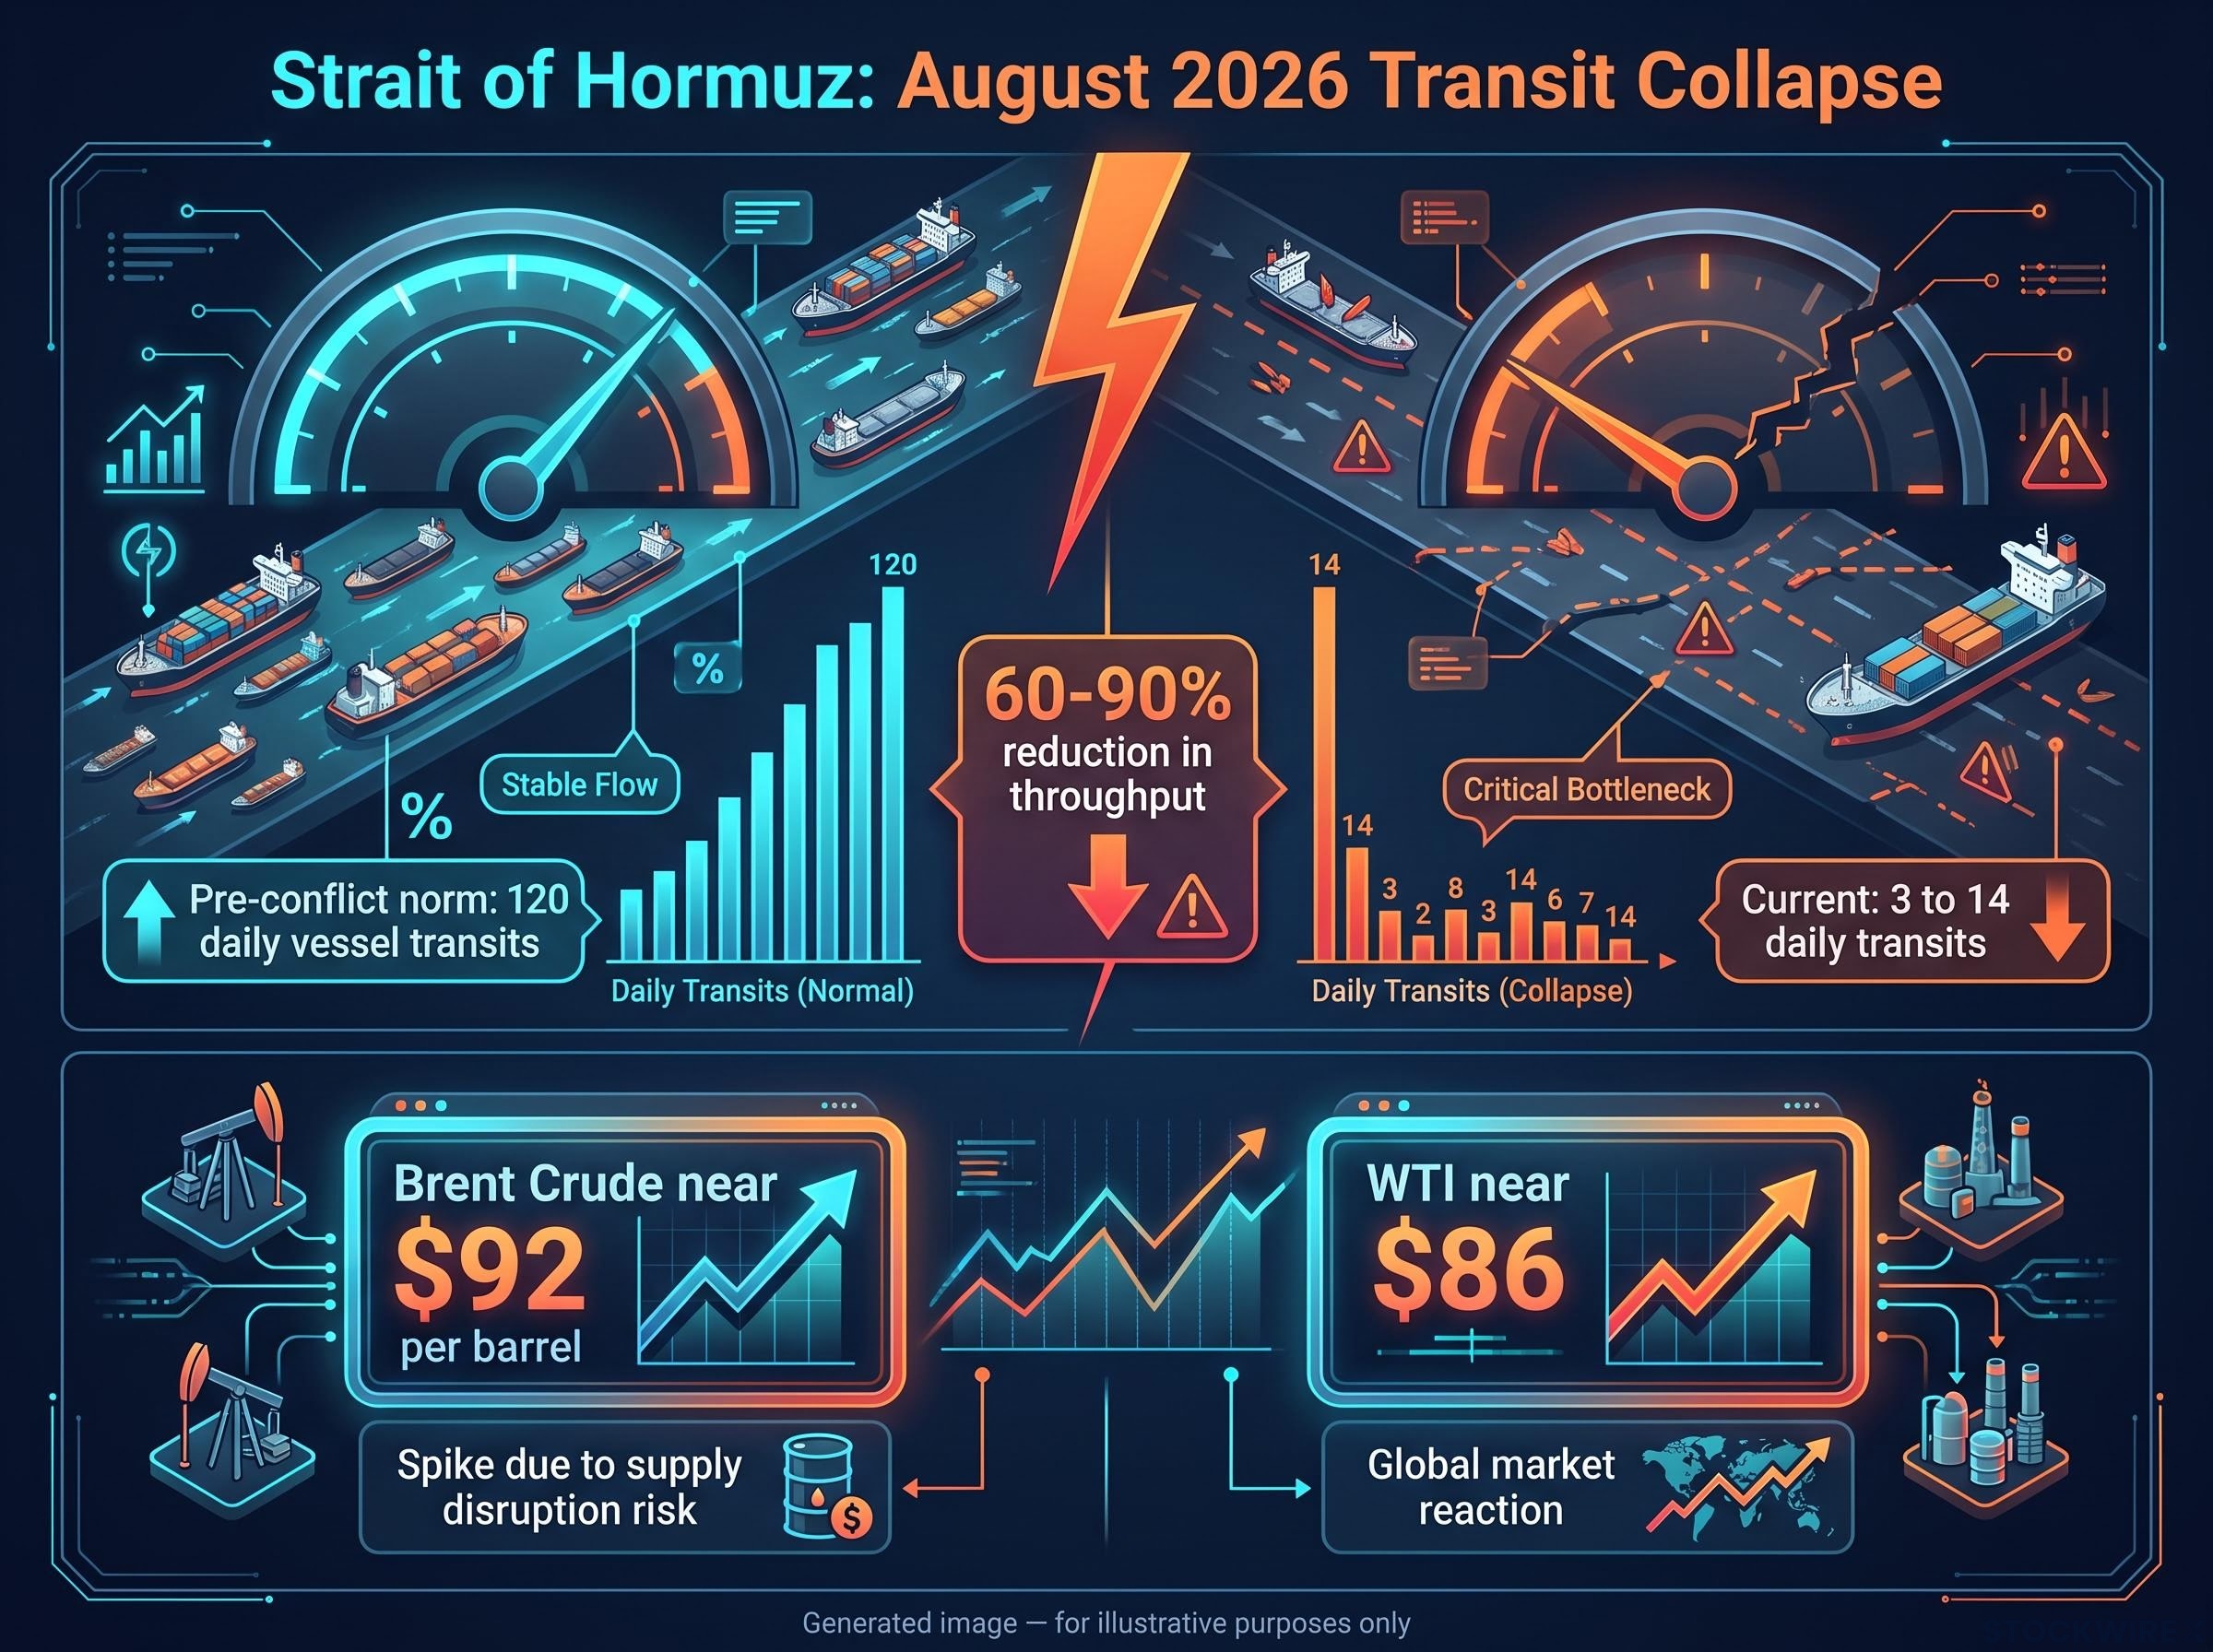
That is not a logistics inconvenience. It is a 60-90% reduction in throughput at the chokepoint through which a substantial share of globally traded crude must pass.
The gap between Iran’s official declarations and the underlying Hormuz shipping data is significant: war-risk insurance premiums are running at approximately 30 times normal rates, and maritime unions have classified the strait as an active war zone, conditions that no diplomatic statement alone can reverse.
Markets have priced it accordingly. Brent crude sits near $92 per barrel, WTI near $86, and the term structure tells you the premium is not a one-session spike. Elevated front-month prices, deepening backwardation, and higher implied volatility all signal that traders have embedded the disruption into their forward pricing rather than treating it as a passing scare.
TD Securities identifies the Iran conflict as a leading factor shaping crude oil market conditions, with the bank noting that ongoing regional instability is likely to keep the geopolitical risk premium in Brent pricing supported.
The reason the premium has moved from transient to structural is that neither side holds uncontested control of the strait. Iran has demanded transit permissions and floated bans on vessels linked to the US and Israel. The US has asserted that no vessel may enter or exit without Navy authorisation. Diplomatic negotiations have reached an impasse with no clear resolution timeline. When daily crossings fall by 85-90% and the standoff carries no visible endpoint, futures markets have no choice but to price the risk of further disruption into every forward curve. A single session of flat or falling crude does not mean the risk has resolved.
When big ASX news breaks, our subscribers know first
How oil prices reach the Canadian dollar: the transmission chain
Canada’s oil sector sits at the core of its export economy, and that structural reality is what transforms a Persian Gulf shipping crisis into a North American currency event: movements in crude benchmarks feed directly into CAD valuation, not merely as a background influence but as a primary input.
The mechanism works through three sequential channels, each reinforcing the others:
- Export revenue conversion: Higher benchmark prices raise the value of Canadian oil exports, boosting corporate revenues that must ultimately be converted into CAD, creating direct demand for the currency.
- Trade balance improvement: When energy export values rise, Canada’s trade balance strengthens against its import bill, lending the currency support as net foreign receipts increase.
- Petro-currency positioning: Global investors often express bullish oil views partly through FX markets, buying CAD as a liquid proxy for oil exposure and for Canada’s resource sector, amplifying the direct revenue effect.
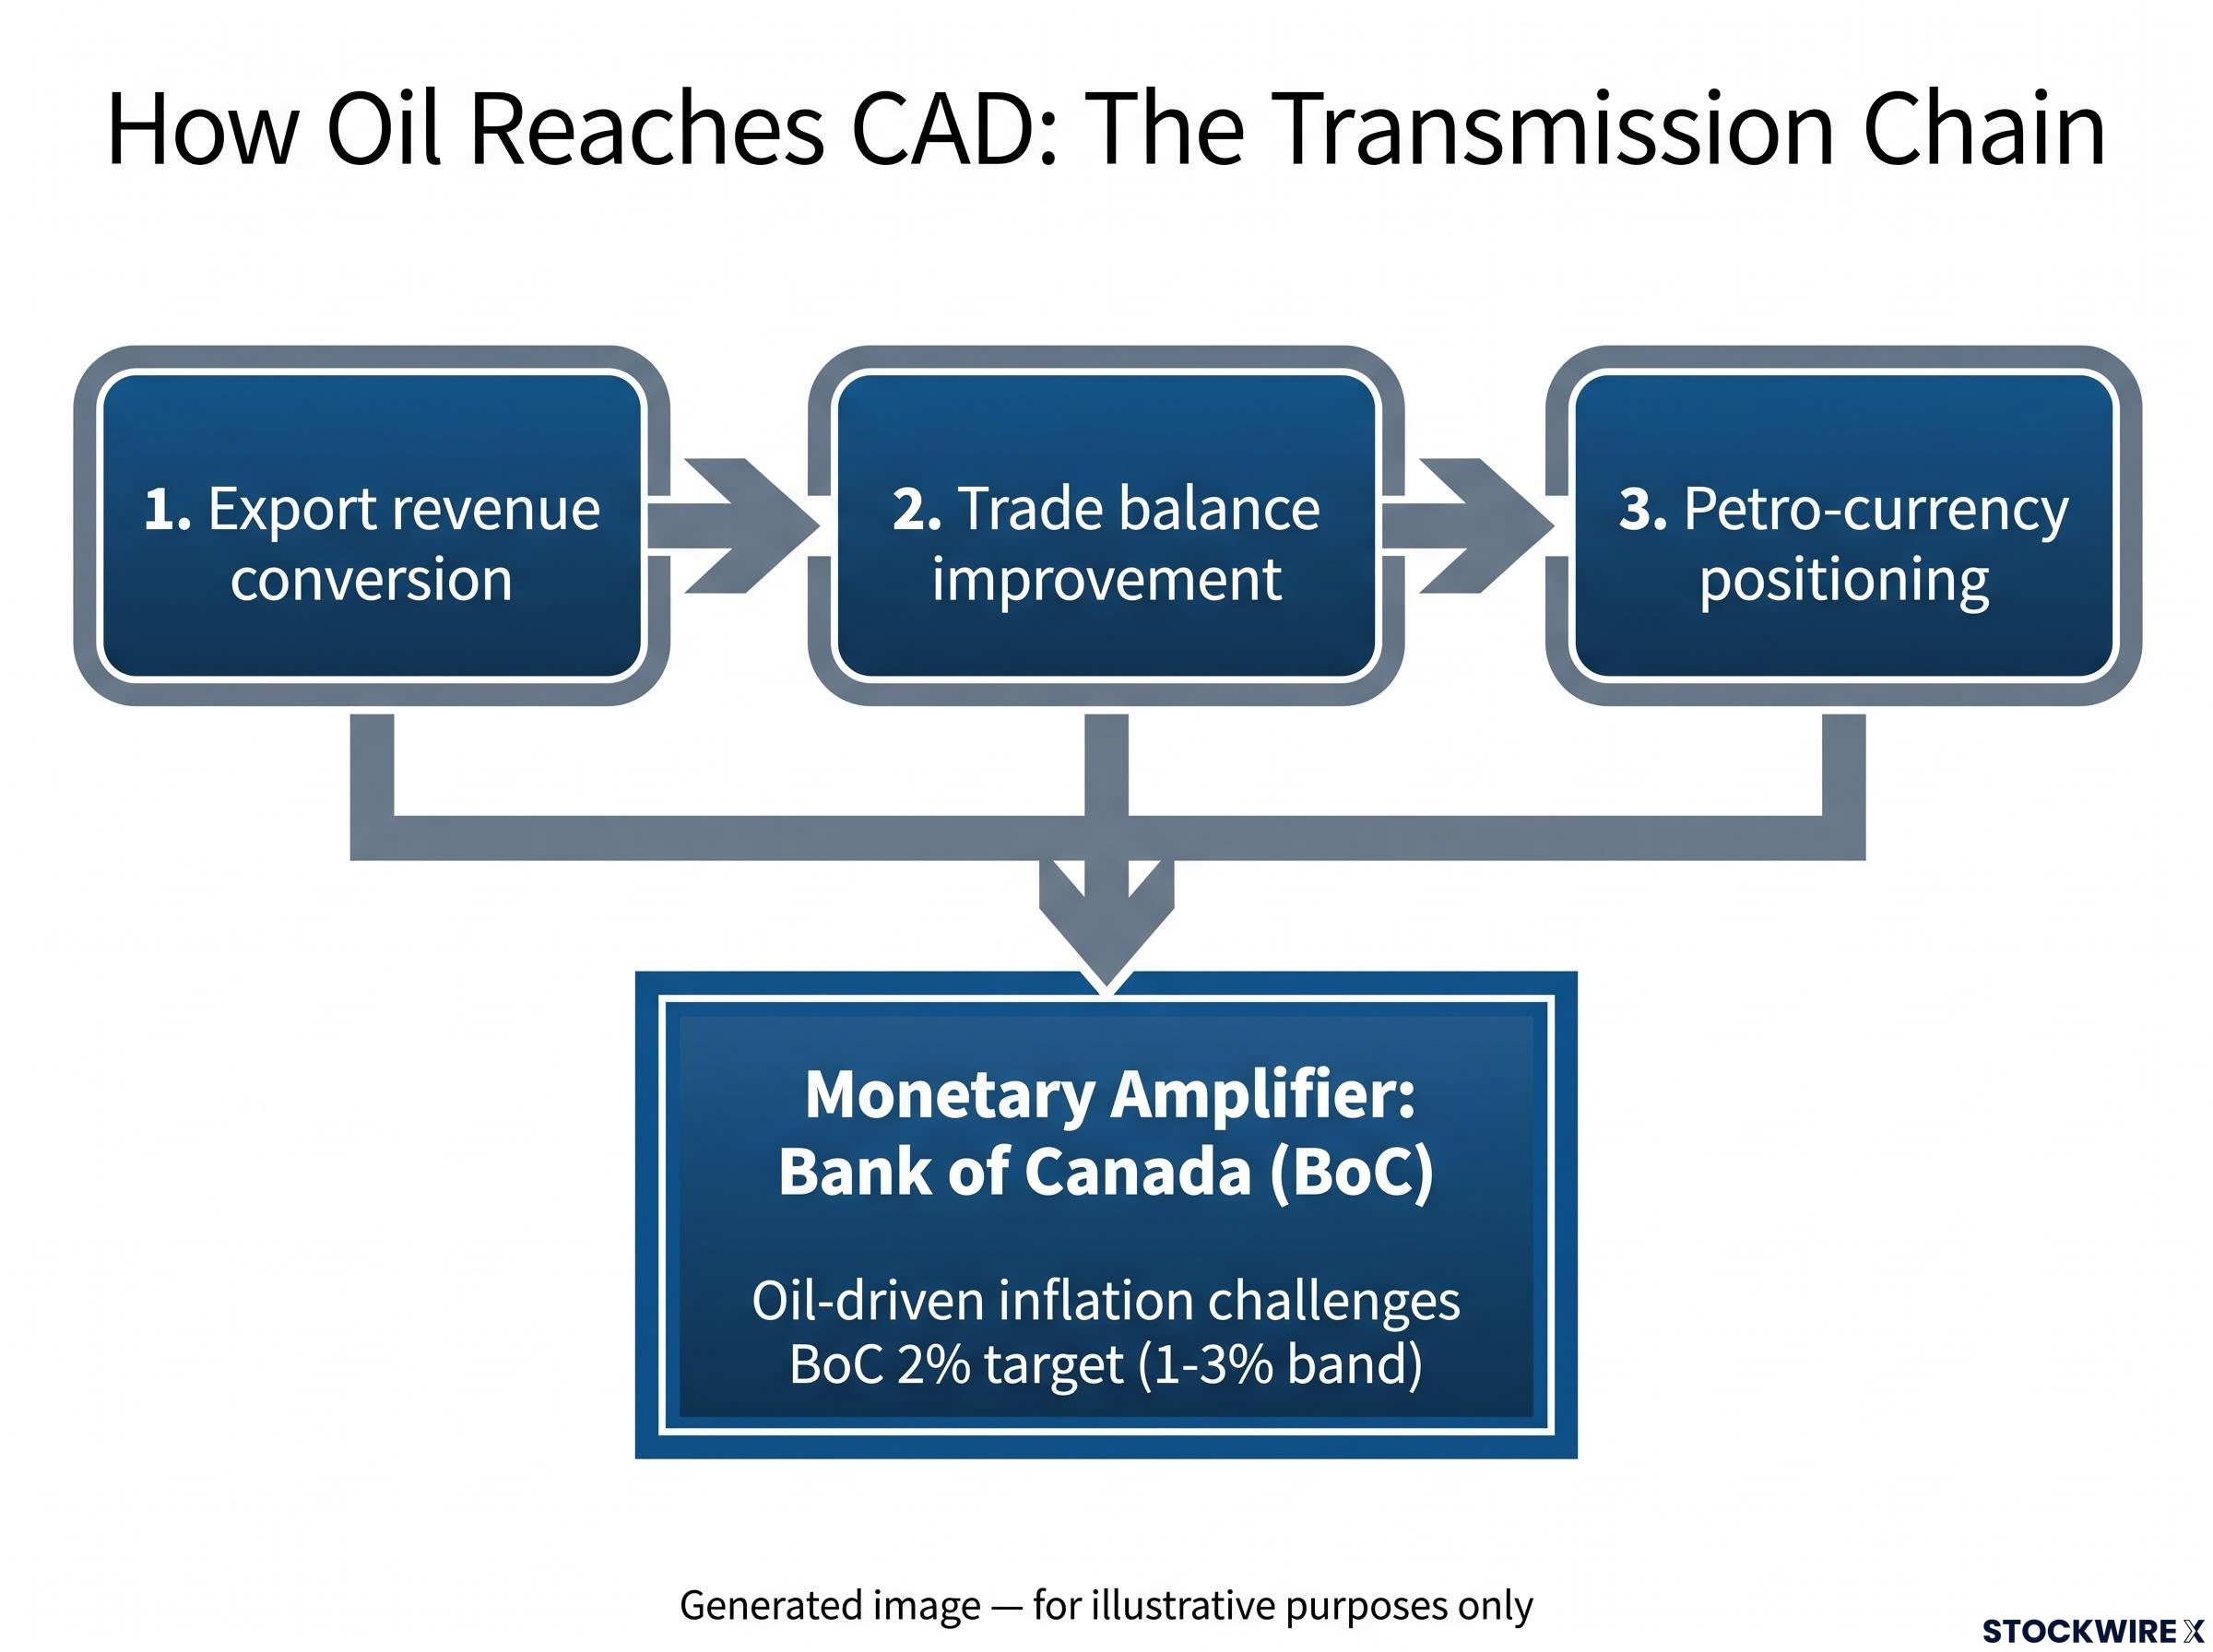
All three channels push in the same direction when oil rises. That is the reason a Persian Gulf shipping disruption is not a purely regional story for anyone with CAD exposure.
The broader shift in petro-currency dynamics since the US became a net energy exporter means the traditional oil-dollar linkage has fractured at the global level, with ING strategists identifying NOK/SEK and AUD/NZD rather than EUR/USD or DXY as the pairs now most reliably tracking Gulf-driven energy risk.
There is an additional macro layer. Given that the United States absorbs the bulk of Canada’s exports, the condition of the American economy shapes CAD performance as much as any other single variable. A broad range of US indicators, from output and industrial activity through to jobs data and household spending surveys, all register in CAD alongside the commodity channel. Historically, the CAD-oil correlation was one of the most studied and reliable in the G10 FX complex, particularly through the 2000s and early 2010s, when rising Brent or WTI coincided with sustained CAD strength against the US dollar.
The Bank of Canada as a second amplifier
Most market participants focus on the commodity channel and stop there. The monetary policy layer is the second-order consequence that sharpens the relationship, and it is the one most often missed.
Elevated oil prices push Canadian headline inflation above the Bank of Canada’s 2% target (set within a 1-3% band), both directly through energy costs and indirectly through transport and input prices across the economy. Markets interpret persistent oil-driven inflation as a signal that the BoC will maintain a more hawkish rate path, either slowing cuts or holding rates higher for longer relative to peers.
The Bank of Canada monetary policy framework sets the inflation-control target at 2%, held within a 1-3% band renewed jointly with the federal government, a commitment that anchors the rate expectations markets must price when oil-driven inflation persistently tests those boundaries.
The sequencing here is straightforward: oil-driven inflation keeps prices above target, which leads central banks to hold rates firmer for longer, and firmer rates pull in foreign capital from investors seeking better returns, with those investors needing to purchase the local currency to access those assets.
That second step is where the monetary amplifier reinforces the commodity channel. Higher relative Canadian rates attract foreign capital that must be converted into CAD, creating a demand layer that sits on top of the export revenue effect.
The counterfactual matters equally. If the BoC were to pivot toward aggressive easing or renewed asset purchases, that would dilute the oil-driven currency support. The balance-sheet policy stance either reinforces or undermines the commodity tailwind.
What this means practically: anyone watching CAD should monitor BoC communication for any language shift around “oil-driven inflation” or “geopolitical risks.” Those phrases can reprice rate expectations and move CAD independently of where crude trades on a given day.
Why the oil-CAD relationship is not playing out cleanly
Here is where the analysis earns its edge. The transmission chain described above is real. All three channels are active. The monetary amplifier is engaged. And yet, the Canadian dollar’s response to this episode has been largely muted.
Scotiabank research indicates that the relationship between the Canadian dollar and oil prices has weakened materially over the past decade, and that the current episode is no exception: despite a sharp rise in oil prices amid the Iran confrontation, the CAD response has been subdued. (This finding has been flagged as directionally supported but not independently verified.)
Scotiabank’s observation that CAD’s reaction to the Iran conflict and higher oil has been muted should change how you assess the currency’s upside from here. The historical beta is not what it was.
Two forces are suppressing the relationship that the transmission chain would otherwise predict.
Safe-haven flows into the US dollar are the primary counterweight. The USD remains the dominant reserve currency during conflict and uncertainty. Higher oil prices are inflationary for the US as a large energy consumer, which can push the Federal Reserve toward a more hawkish stance or delay rate cuts, supporting the dollar through higher yields. A stronger USD mechanically compresses any CAD gains.
USD reserve currency mechanics explain why the safe-haven bid is structurally durable rather than episodic: the dollar appears on one side of 89.2% of all global FX trades, a network effect so deeply embedded in trade settlement and debt issuance that crisis periods reliably trigger dollar demand regardless of US-specific economic conditions.
Risk-off sentiment is the second. When investors view the Hormuz situation as a broad geopolitical shock rather than a targeted positive for energy exporters, funds flow into Treasuries and safe havens rather than commodity currencies.
The balance between these forces is path-dependent. Chronic tension with contained conflict tends to let the commodity channel dominate over time. Sudden escalation or open warfare favours risk-off USD strength even when oil is simultaneously spiking.
| Dimension | Expected mechanism | Observed CAD response | Key suppressing force |
|---|---|---|---|
| Export revenue channel | Higher oil lifts CAD via trade balance | Muted; CAD not rallying proportionally | Safe-haven USD bid absorbs the tailwind |
| Monetary policy channel | Oil-driven inflation keeps BoC hawkish, attracting capital | Partially active but offset | Fed hawkishness on inflation reinforces competing USD strength |
| Investor positioning channel | Global investors buy CAD as oil proxy | Weakened; alternative instruments preferred | Structural macro concerns (debt, housing, productivity) weigh on CAD positioning |
Canada’s broader macro fundamentals, including household debt, housing dynamics, productivity, and diversification away from concentrated energy dependence, now carry more weight for CAD than in prior decades. The Hormuz premium is necessary but not sufficient for CAD strength, and the USD safe-haven bid can absorb a significant portion of the commodity tailwind during active conflict.
Reading the live signals: what to watch and why
The analytical framework above converts into a practical monitoring system built around four signal categories. Watching these together, rather than reacting to individual oil headlines in isolation, gives you a functional early-warning system for whether the Hormuz premium is intensifying, stabilising, or being absorbed by competing dynamics.
- Hormuz vessel transit counts: The primary leading indicator. Daily crossing counts falling sharply below the 120-per-day pre-conflict norm, whether into the current 3-14 range or lower, typically foreshadow renewed upward pressure on crude benchmarks. A stabilisation or recovery in those counts would be the first indication that the risk premium may begin to fade.
- Brent and WTI term structure: Elevated front-month prices, deepening backwardation (where near-term contracts trade above longer-dated ones, signalling traders expect scarcity to persist), and rising implied volatility are the market’s own assessment of how durable the premium is. Flattening curves or falling volatility would signal that traders are beginning to price resolution.
- BoC and Fed communication: The rate-expectations indicator. BoC language around “oil-driven inflation” or “geopolitical risks” reprices the monetary amplifier for CAD. Fed rhetoric that leans hawkish on inflation reinforces the competing USD bid. Watch the gap between the two central banks’ stances, not either one in isolation.
- USD index and broad risk sentiment: DXY direction, credit spread movement, and equity performance are the real-time arbiters of whether the commodity channel or the safe-haven channel is dominant on any given day. A rising DXY alongside widening credit spreads and weaker equities points to risk-off conditions that typically cap CAD even when oil is firm.
Together, these four categories tell you whether the oil premium is reaching CAD or being intercepted by competing forces before it arrives.
What the Hormuz standoff has actually changed about the oil-CAD calculus
The standoff has converted a latent geopolitical vulnerability into an active, priced risk premium with structural characteristics. Persistent backwardation, sharply reduced transit counts, and a diplomatic impasse with no resolution timeline all point to a premium that will not dissipate on its own.
TD Securities has flagged persistent regional instability as a force likely to keep the Brent risk premium intact, a position consistent with the shipping data and the lack of any credible diplomatic path toward restoring normal strait access.
For the Canadian dollar, the premium is real and supportive in principle. All three transmission channels are engaged. The monetary amplifier is active. But the currency’s response will remain partial and path-dependent as long as safe-haven flows and a structurally weaker CAD-oil beta constrain the upside.
The forward-looking implication is that the indicators worth tracking are not just crude benchmarks. The intersection of shipping data, central bank posture, and USD safe-haven demand determines how much of the oil premium actually reaches CAD. Leaning on the oil-CAD correlation alone will systematically overestimate the currency tailwind in this episode.
That is the durable analytical takeaway. The Hormuz standoff is not just a story about tankers and crude prices. It is a live demonstration that commodity-currency relationships are more conditionally valid than conventional wisdom assumes, and that reading them accurately requires a three-variable view: oil, the dollar, and the central bank sitting between them.
For readers wanting to understand the longer-term structural forces shaping the USD safe-haven bid, our deep-dive into dollar reserve risk examines the OMFIF finding that central banks now plan to reduce rather than increase dollar allocations, a shift that, if it accelerates, would gradually erode the safe-haven counterweight this article identifies as the primary cap on CAD upside.
This article is for informational purposes only and should not be considered financial advice. Investors should conduct their own research and consult with financial professionals before making investment decisions. These statements are speculative and subject to change based on market developments and geopolitical conditions.