
What ASML’s High NA EUV Actually Does to Chip Manufacturing
50 mins ago

At $165.67 per share, Commonwealth Bank of Australia is trading roughly 34% above the average broker target and approximately 65% above what a standard Dividend Discount Model produces. One of those numbers reflects what analysts think the stock is worth. The other reflects what investors are willing to pay. This analysis applies a DDM framework to CBA in real time, using the bank’s most recently declared dividend data, a matrix of growth and discount rate assumptions, and a franking credit adjustment to show how intrinsic value estimates are constructed, where the sensitivities lie, and how Australia’s dividend imputation system shifts the picture. The result is a live case study against a current share price, published on 23 May 2026, that readers can replicate for any dividend-paying ASX stock.
The gap between what CBA trades at and what the broker community thinks it is worth is not a rounding error. It is a valuation question that demands a framework.
The verified data points tell the story quickly:
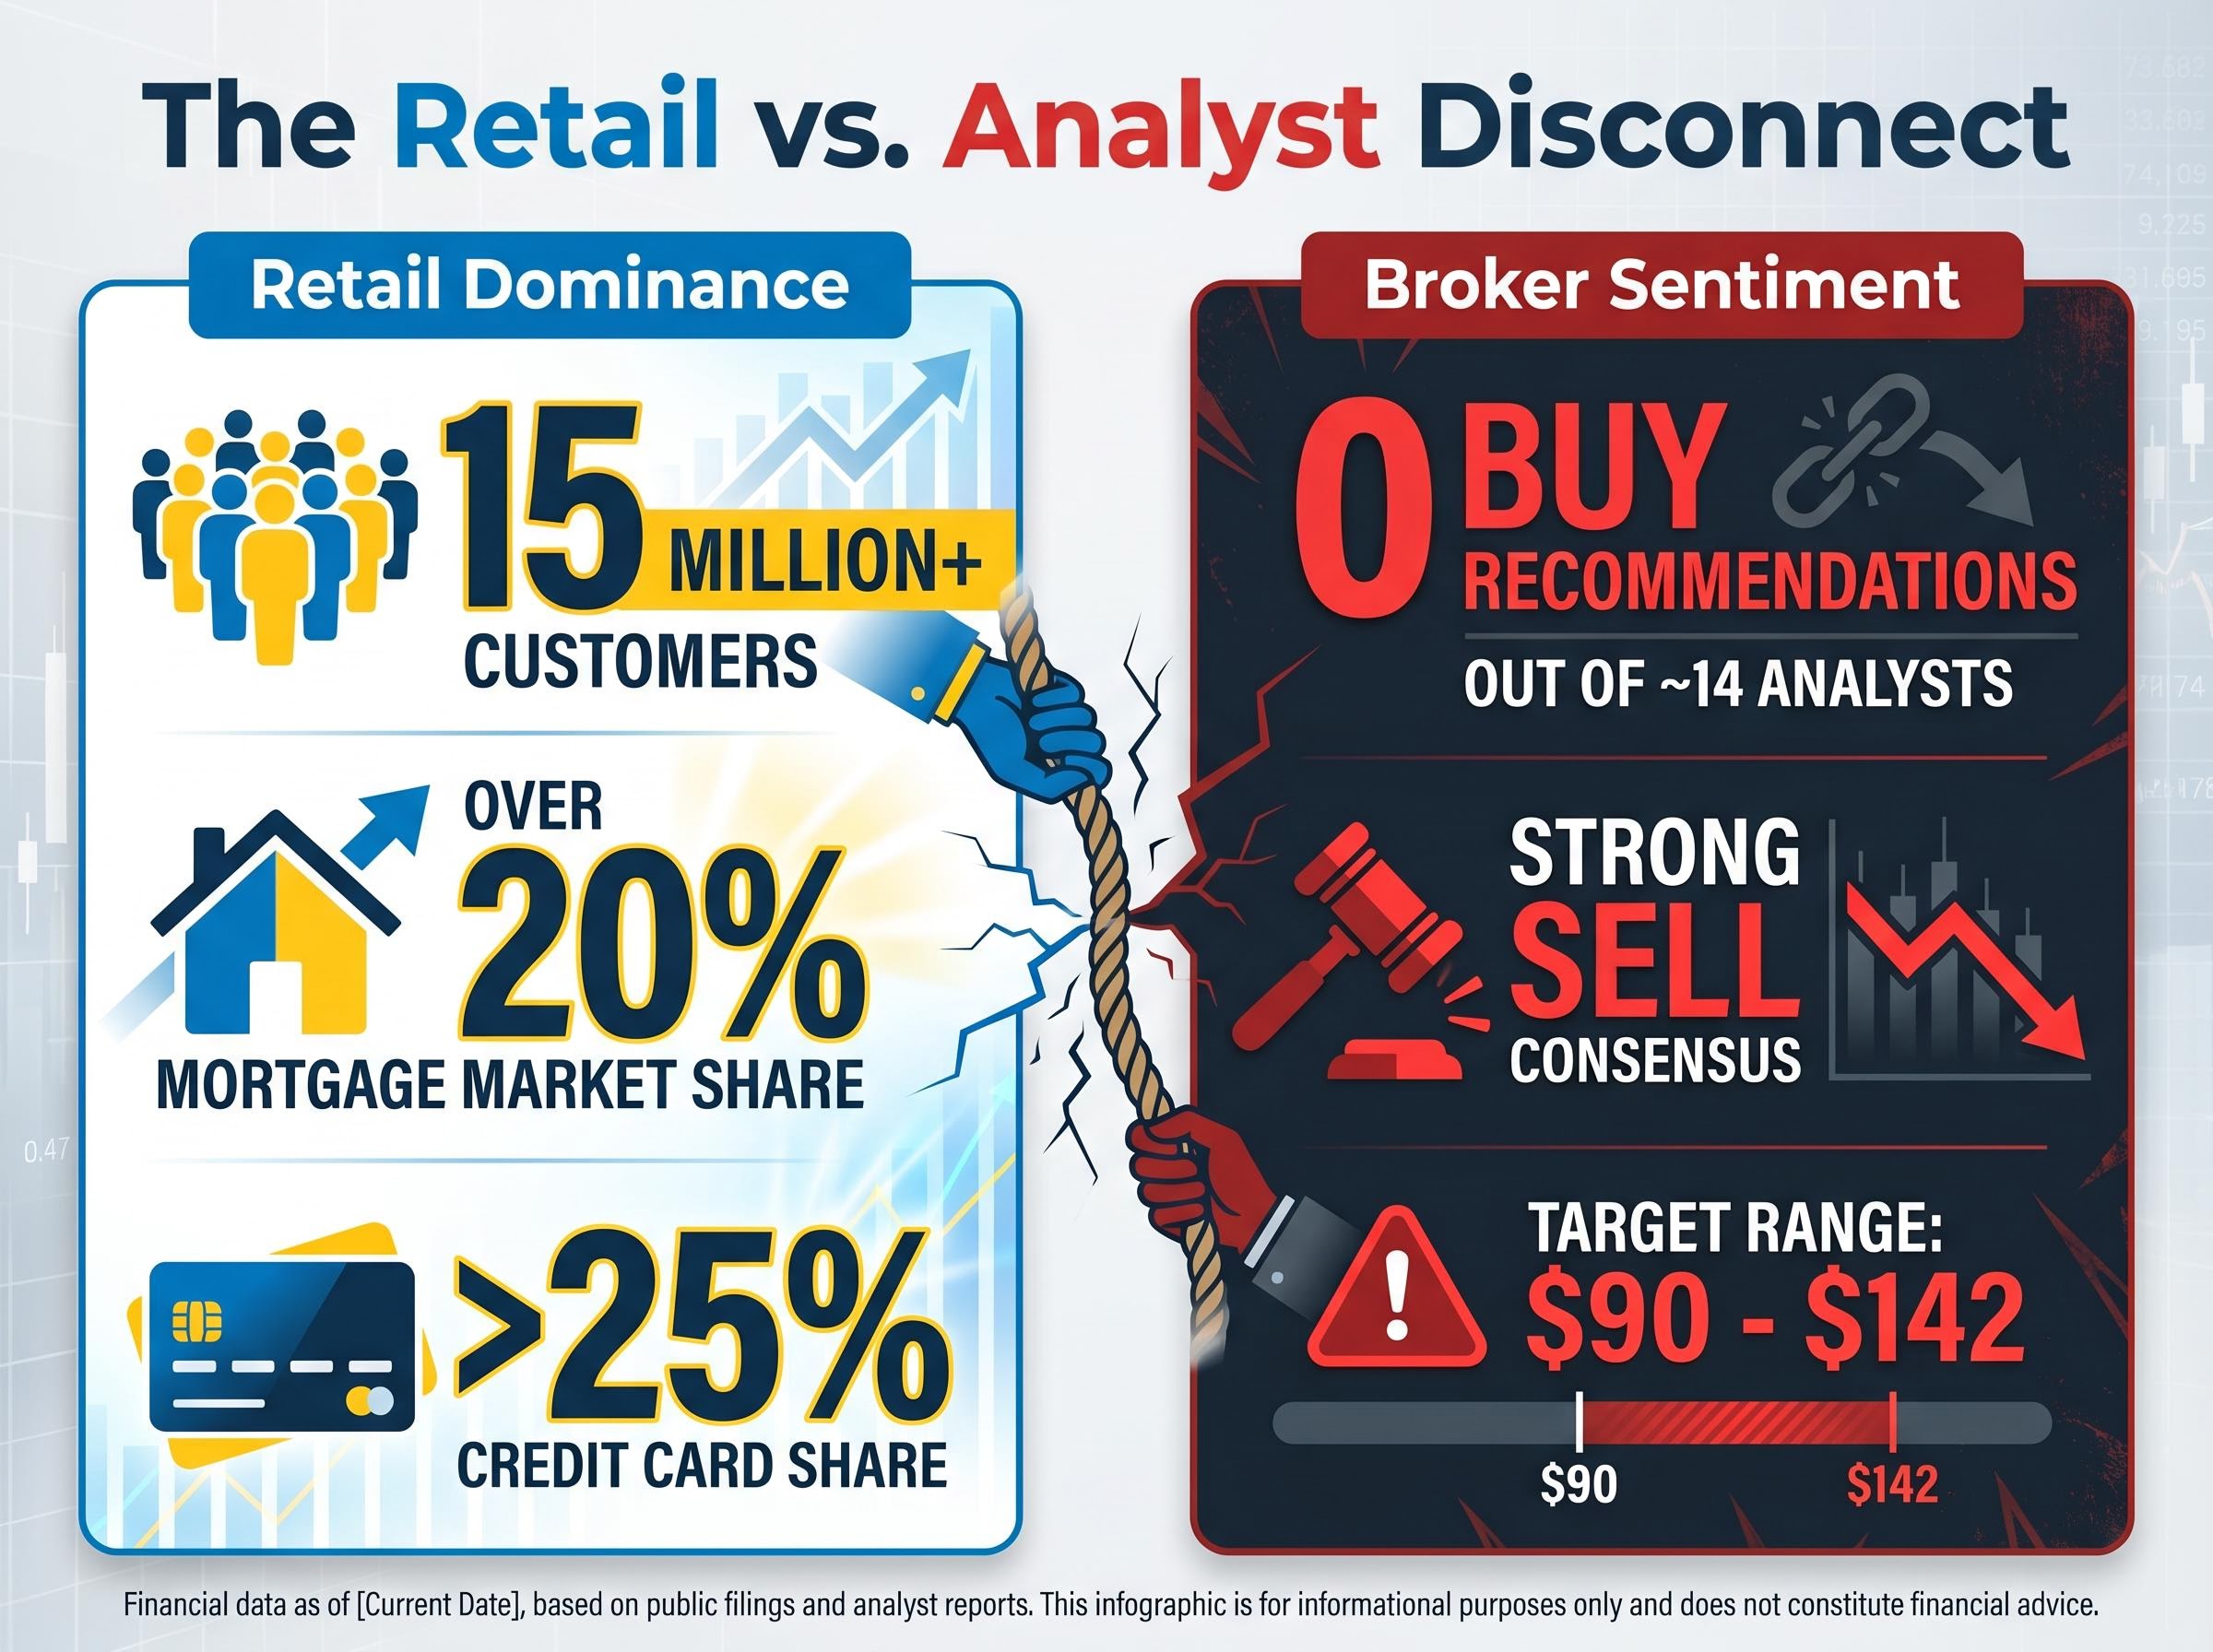
CBA trades at $165.67. The average broker target sits at approximately $124.80. No verified Buy recommendations exist across the aggregate.
Zero Buy recommendations across approximately 14 analysts is an unusual positioning for a stock that more than 15 million customers interact with, that holds over 20% of the Australian mortgage market, and that exceeds 25% share in credit cards. Retail investors treat CBA as a default portfolio anchor. The broker community, almost unanimously, sees it as overpriced.
The structural limits of broker consensus are visible beyond CBA: CSL’s share price fell approximately 67% from its all-time high while every covering broker maintained a buy rating throughout the decline, illustrating how analyst incentives and institutional herding can produce persistent gaps between consensus targets and market reality across multiple sectors.
So what would CBA need to deliver to justify the current level? That question requires a model, not an opinion.
The DDM rests on a single premise: a share is worth the sum of all the future dividends it will pay, discounted back to today’s value. If an investor plans to hold a stock for its income stream, the model asks what that stream is worth in present terms.
The Gordon Growth Model version of the DDM compresses this into one formula:
Share price = Annual dividend / (Discount rate – Dividend growth rate)
The discount rate reflects the return an investor requires to compensate for risk. The dividend growth rate captures how fast dividends are expected to grow over time. Change either assumption by a single percentage point and the output moves materially.
Two inputs drive the model. Everything else is arithmetic.
Not every stock suits a DDM. The model works best when three conditions hold:
The dividend discount model for income stocks works most reliably when three structural conditions align: high and stable payout ratios, predictable earnings cycles, and limited reinvestment complexity, which is why Australian banks, utilities, and infrastructure companies consistently appear in DDM-based valuation work while technology and early-stage growth companies do not.
CBA meets all three. Lending income accounts for approximately 85% of total revenue. The bank’s most recently declared full-year dividend was $4.65 per share, with broker consensus forecasting approximately $4.74-$4.75 for FY2026, fully franked. The payout ratio has been consistent for years. The dividend stream is the dominant source of investor return, which is precisely what the DDM is built to value.
A single DDM calculation with one growth rate and one discount rate produces a single number. A sensitivity matrix produces a range, and the range is where the analytical value lives.
The steps to apply the base case are straightforward:
Repeating that calculation across growth rates of 2% to 4% and discount rates of 6% to 11% produces the full matrix below (current price of $165.67 shown for reference):
| Growth Rate / Discount Rate | 6% | 7% | 8% | 9% | 10% | 11% |
|---|---|---|---|---|---|---|
| 2% | $116.25 | $93.00 | $77.50 | $66.43 | $58.13 | $51.67 |
| 3% | $155.00 | $116.25 | $93.00 | $77.50 | $66.43 | $58.13 |
| 4% | $232.50 | $155.00 | $116.25 | $93.00 | $77.50 | $66.43 |
The average output across all 18 scenarios is $98.33 per share. Using an estimated next-year dividend of $4.76 rather than the trailing $4.65 lifts the average to $100.66.
The matrix average of $98.33 sits approximately 41% below CBA’s current market price of $165.67. Even the most generous combination tested (4% growth, 6% discount rate) produces $232.50, the only scenario that exceeds the current price, and it requires assumptions most analysts would consider aggressive for a mature bank.
The overvaluation signal is not a product of one pessimistic assumption. It holds across the majority of the matrix. CBA’s current price exceeds every output where the discount rate is 7% or above, regardless of the growth rate applied.
Earnings growth expectations for CBA sit in the low-to-mid single digits, with net interest margins under pressure from potential RBA rate cuts and intensifying mortgage competition. That environment makes the 2-3% growth row more representative than the 4% row for most analysts.
Standard DDM models value cash dividends only. For a significant portion of CBA’s shareholder base, that understates the actual return.
Australia’s dividend imputation system attaches franking credits to dividends paid from profits on which corporate tax has already been paid. For investors on low or zero marginal tax rates, particularly retirees and self-managed super funds (SMSFs) in pension phase, these credits are refundable. The effective dividend is larger than the cash amount.
The mechanics are direct: gross dividend equals cash dividend divided by (1 minus the corporate tax rate of 30%). For CBA’s $4.65 cash dividend, the grossed-up figure is approximately $6.64. Applying this grossed-up dividend to the same DDM matrix and averaging the outputs produces a franking-adjusted fair value of approximately $143.80.
Investors who cannot benefit from franking refunds, including foreign investors and those on higher marginal tax rates, would apply a lower or zero adjustment, producing estimates closer to the unadjusted figures.
| Valuation Scenario | Estimated Fair Value |
|---|---|
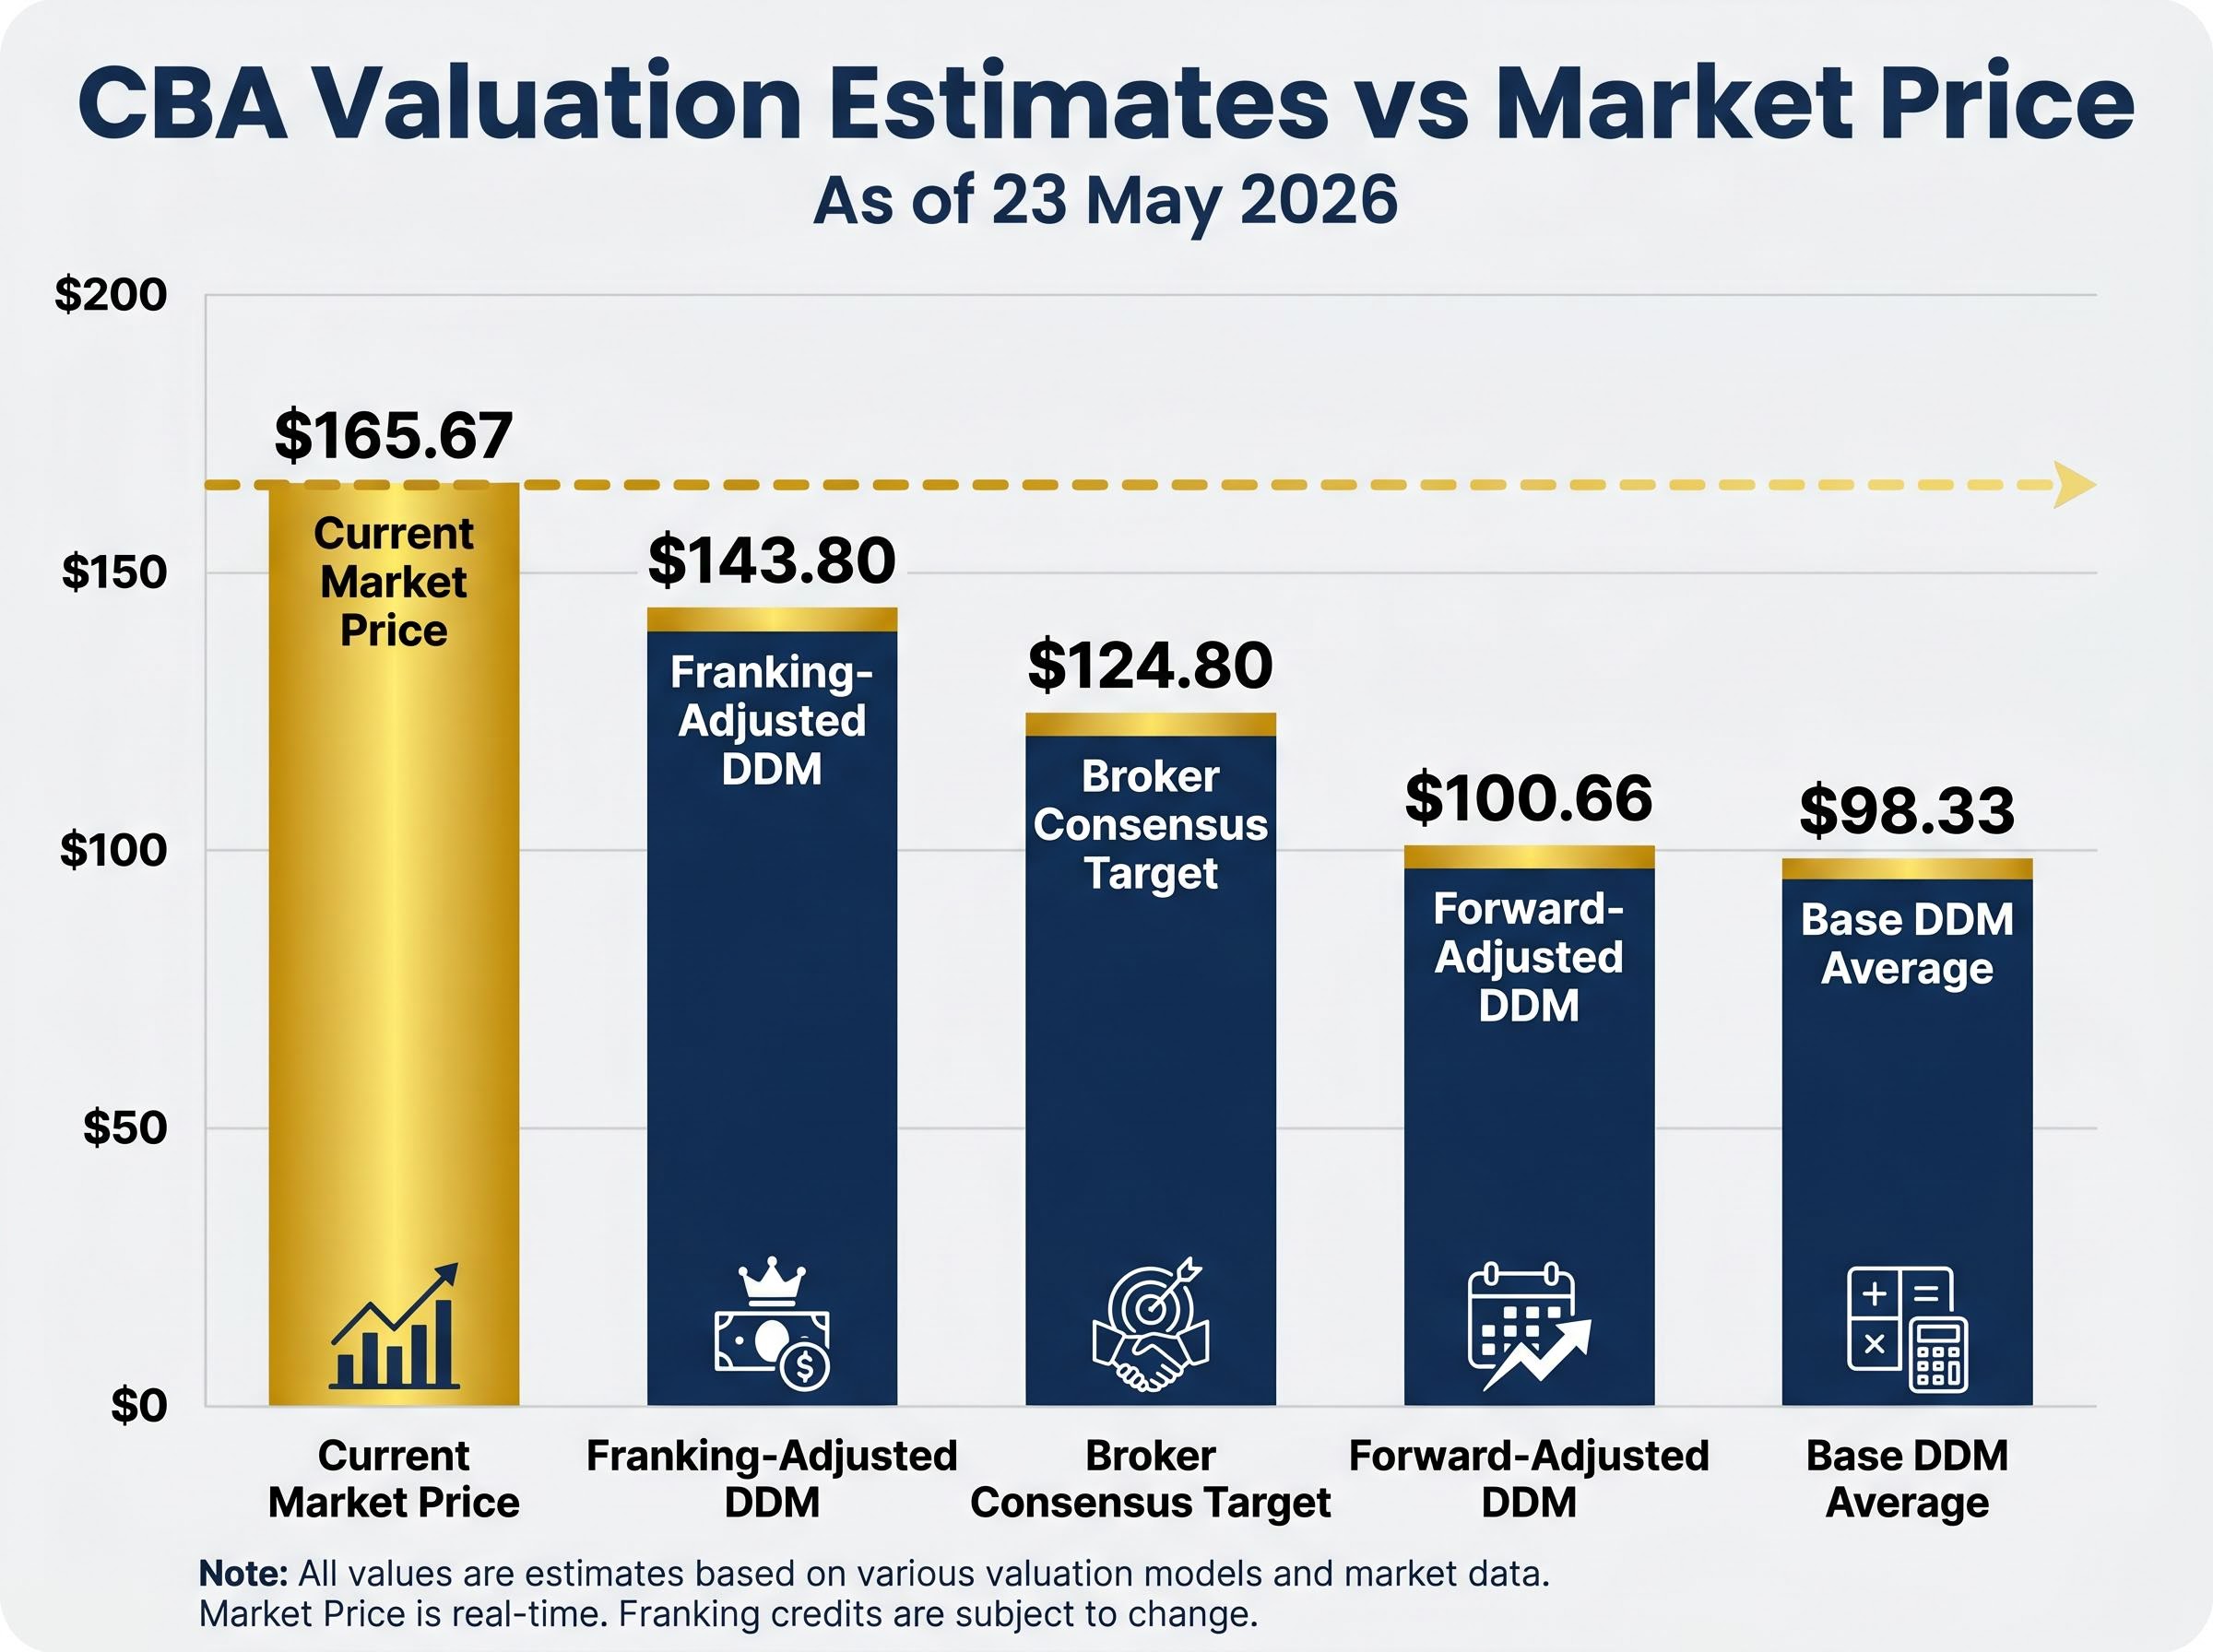
| Base DDM average (cash dividends only) | $98.33 |
| Forward-adjusted DDM ($4.76 DPS) | $100.66 |
| Franking-adjusted DDM (grossed-up dividends) | $143.80 |
| Current market price | $165.67 |
The franking adjustment narrows the gap materially, from roughly 65% above the base case to approximately 13-15% above the franking-adjusted figure. According to Morningstar analysis, franking credits can add approximately 1.5-2.0 percentage points to effective yield for pension-phase SMSFs versus headline cash figures. That is a genuine, quantifiable source of value for a specific investor cohort, and it partly explains why CBA’s market price has persistently exceeded broker fair value estimates.
It does not, however, close the gap entirely. Even after franking, the current price sits approximately $22 above the adjusted valuation.
The DDM outputs are only as credible as the assumptions behind them. CBA’s operating metrics provide the context for judging what growth and discount rates are realistic.
| Metric | CBA | Sector Average |
|---|---|---|
| Return on equity (ROE) | 13.1% | 9.35% |
| Net interest margin (NIM) | 1.99% | 1.78% |
| CET1 capital ratio | 12.3% | Below 12.3% |
| Workplace culture score | 3.4 / 5 | 3.1 / 5 |
CBA leads on every measure. The 13.1% ROE sits nearly four percentage points above the sector average. The NIM of 1.99% and the CET1 ratio of 12.3% reflect both pricing discipline and capital strength. These metrics support the argument that CBA deserves a premium to peers, with forward P/E reported at approximately 18-19x versus 13-14x for other majors, and price-to-book at approximately 2.2x versus 1.3-1.5x.
The APRA capital framework for ADIs establishes the “unquestionably strong” CET1 benchmark that major banks must maintain, setting the regulatory floor against which CBA’s 12.3% ratio represents genuine capital headroom rather than mere compliance.
The question is whether the premium has stretched beyond what the fundamentals can sustain. Three headwinds constrain aggressive growth assumptions:
ASX bank stock valuation ultimately requires combining quantitative outputs with qualitative interrogation of loan book quality, NIM trajectory, and APRA capital constraints, because DDM and PE ratios both measure earnings as an output without examining whether the provisioning judgements and funding costs behind those earnings are sustainable.
If dividend growth is realistically 2-3% rather than 4% or above, the DDM outputs cluster in the lower half of the matrix. The fundamentals support CBA’s quality premium but do not easily support the growth assumptions embedded in a $165.67 share price.
The DDM, across every assumption combination tested, produces an intrinsic value estimate below CBA’s current price. The base average sits at $98.33. The forward-adjusted figure reaches $100.66. The franking-adjusted estimate, which captures the real tax benefit for a specific investor cohort, reaches $143.80. None matches $165.67.
That output is consistent with the verified broker consensus: an average target of approximately $124.80, a Strong Sell rating, and zero Buy recommendations across approximately 14 analysts. Morningstar has assigned CBA a 2-star rating, indicating an assessment of overvaluation. The convergence across different methodologies strengthens the signal.
What the DDM result tells investors:
What the DDM result does not tell investors:
Every DDM output tested sits below CBA’s current market price of $165.67. The franking-adjusted figure of $143.80 narrows the gap to approximately 13-15% but does not close it.
Across the full range of assumptions tested, the DDM produces estimates of $98.33 to $143.80 for CBA, all below the current $165.67 market price. That finding aligns with the direction of broker consensus rather than contradicting it. The model and the market’s professional analysts are pointing the same way.
The DDM does not tell an investor what to do. It tells them what the market is currently pricing in, and whether they agree with those embedded assumptions. For an investor in pension-phase SMSF receiving fully franked dividends, the gap is smaller than the headline figures suggest. For an investor without franking benefits, the gap is wider.
The most durable takeaway is the framework itself. The same DDM matrix applied here can be replicated for any dividend-paying ASX stock, producing a structured, assumption-transparent view of fair value that sharpens the buy, hold, or sell question rather than answering it with false precision.
For investors who want to apply the same income-focused lens to portfolio construction more broadly, our dedicated guide to ASX dividend income investing covers payout ratio sustainability, ex-dividend date mechanics, dividend reinvestment plan compounding, and the warning signs that distinguish a genuine high-yield opportunity from a dividend trap.
This article is for informational purposes only and should not be considered financial advice. Investors should conduct their own research and consult with financial professionals before making investment decisions. Past performance does not guarantee future results. Financial projections are subject to market conditions and various risk factors.
The Dividend Discount Model (DDM) values a share by summing all future expected dividends and discounting them back to today's value using the formula: share price equals annual dividend divided by the difference between the discount rate and dividend growth rate. For CBA, applying this formula across a range of growth and discount rate assumptions produces fair value estimates between $98.33 and $143.80, all below the current market price of $165.67.
Franking credits attached to CBA's fully franked dividends allow eligible investors, such as retirees and self-managed super funds in pension phase, to claim a refund of corporate tax already paid, effectively grossing up the $4.65 cash dividend to approximately $6.64. Applying this grossed-up figure to the DDM matrix raises the franking-adjusted fair value estimate to approximately $143.80, narrowing but not closing the gap to the current $165.67 share price.
Approximately 14 brokers covering CBA have set an average target price of around $124.80 with a Strong Sell consensus rating, and no verified Buy recommendations exist across the group. The target range spans $90 at the low end to $142 at the high end, all below CBA's current trading price of $165.67.
Bank stocks suit the DDM because they typically have high and stable payout ratios, predictable earnings cycles, and limited reliance on large capital expenditure reinvestment, all conditions that make long-term dividend forecasts credible. CBA's lending income accounts for approximately 85% of total revenue and it has maintained a consistent dividend payout ratio, making its dividend stream the dominant source of investor return that the DDM is specifically designed to value.
The only DDM scenario in the tested matrix that produces a value exceeding $165.67 is a 4% dividend growth rate combined with a 6% discount rate, which yields $232.50. Most analysts consider both assumptions aggressive for a mature bank facing NIM compression from potential RBA rate cuts, intensifying mortgage competition, and moderating housing credit growth.