One Canadian covered call ETF raised its monthly payout by 36% in a single month, while another cut its distribution by roughly a third. So what does a number like that actually tell you about the fund behind it?
Less than you might think. Canadian covered call ETF distributions are formula outputs, shaped by option premiums, dividends, leverage and fund structure, and a change in direction is not a verdict on quality.
This piece uses the September-October 2025 changes as a historical case study of how those formulas react. It is not a guide to what any fund pays today.
Here is a way to judge whether a raise or cut reflects a lasting shift or a one-month artefact.
How covered call mechanics turn volatility into a payout
A payout from these funds is a moving output, not a promise. The mechanics explain why, and they build in layers.
Covered calls and capped upside
A covered call strategy means a fund holds shares and sells call options on them. A call option is a contract giving the buyer the right to purchase a share at a set price. The fund collects a fee, called the premium, and in return agrees to cap some of its upside above that price.
Say a fund holds a share trading at $100 and sells a call at $105. It banks the premium, but gains above $105 go to the option buyer. When markets are calm, buyers pay less for those options, so premiums shrink.
What leverage and 0DTE options add
Some funds add light leverage, meaning borrowed money. Global X’s enhanced suite (EACL, RNCL and BCCL) borrows roughly 25% to hold about 125% exposure, which is permitted because they are classed as alternative mutual funds under National Instrument 81-102 (NI 81-102). That amplifies income and losses alike.
Hamilton’s BDAY goes further. It uses 25% leverage and writes zero-days-to-expiry (0DTE) options, which expire the same day, on QQQM, while holding full Bitcoin exposure through IBIT. Premium is harvested daily, so income tracks realised volatility closely.
Three ingredients feed the payout:
- Equity dividends and bond coupons, where the fund holds bonds
- Option premium
- Possible return of capital, meaning some of your own money handed back
Overwrite ratios (how much of the portfolio is covered by options) and exact 0DTE strike and tenor details are not publicly specified.
Your fund’s overwrite ratios decide how much of the portfolio is exposed to capped upside, and a partial overwrite of 30-50% leaves you far more room to participate in rallies than a full one.
Issuer language Global X states that the payment of distributions, if any, “is not guaranteed and may fluctuate at any time.”
Because option income rises and falls with volatility, treat any single month’s payout as a reading of recent conditions, not a salary.
When big ASX news breaks, our subscribers know first
What the September-October 2025 raises and cuts reveal
Start with the raises. According to a covered call ETF tracker used by one presenter, a CI fund rose 36%, and Global X’s EACL rose 22.86%, its first raise ever. Those are the headline numbers, and they sit with the leveraged and Bitcoin-linked names.
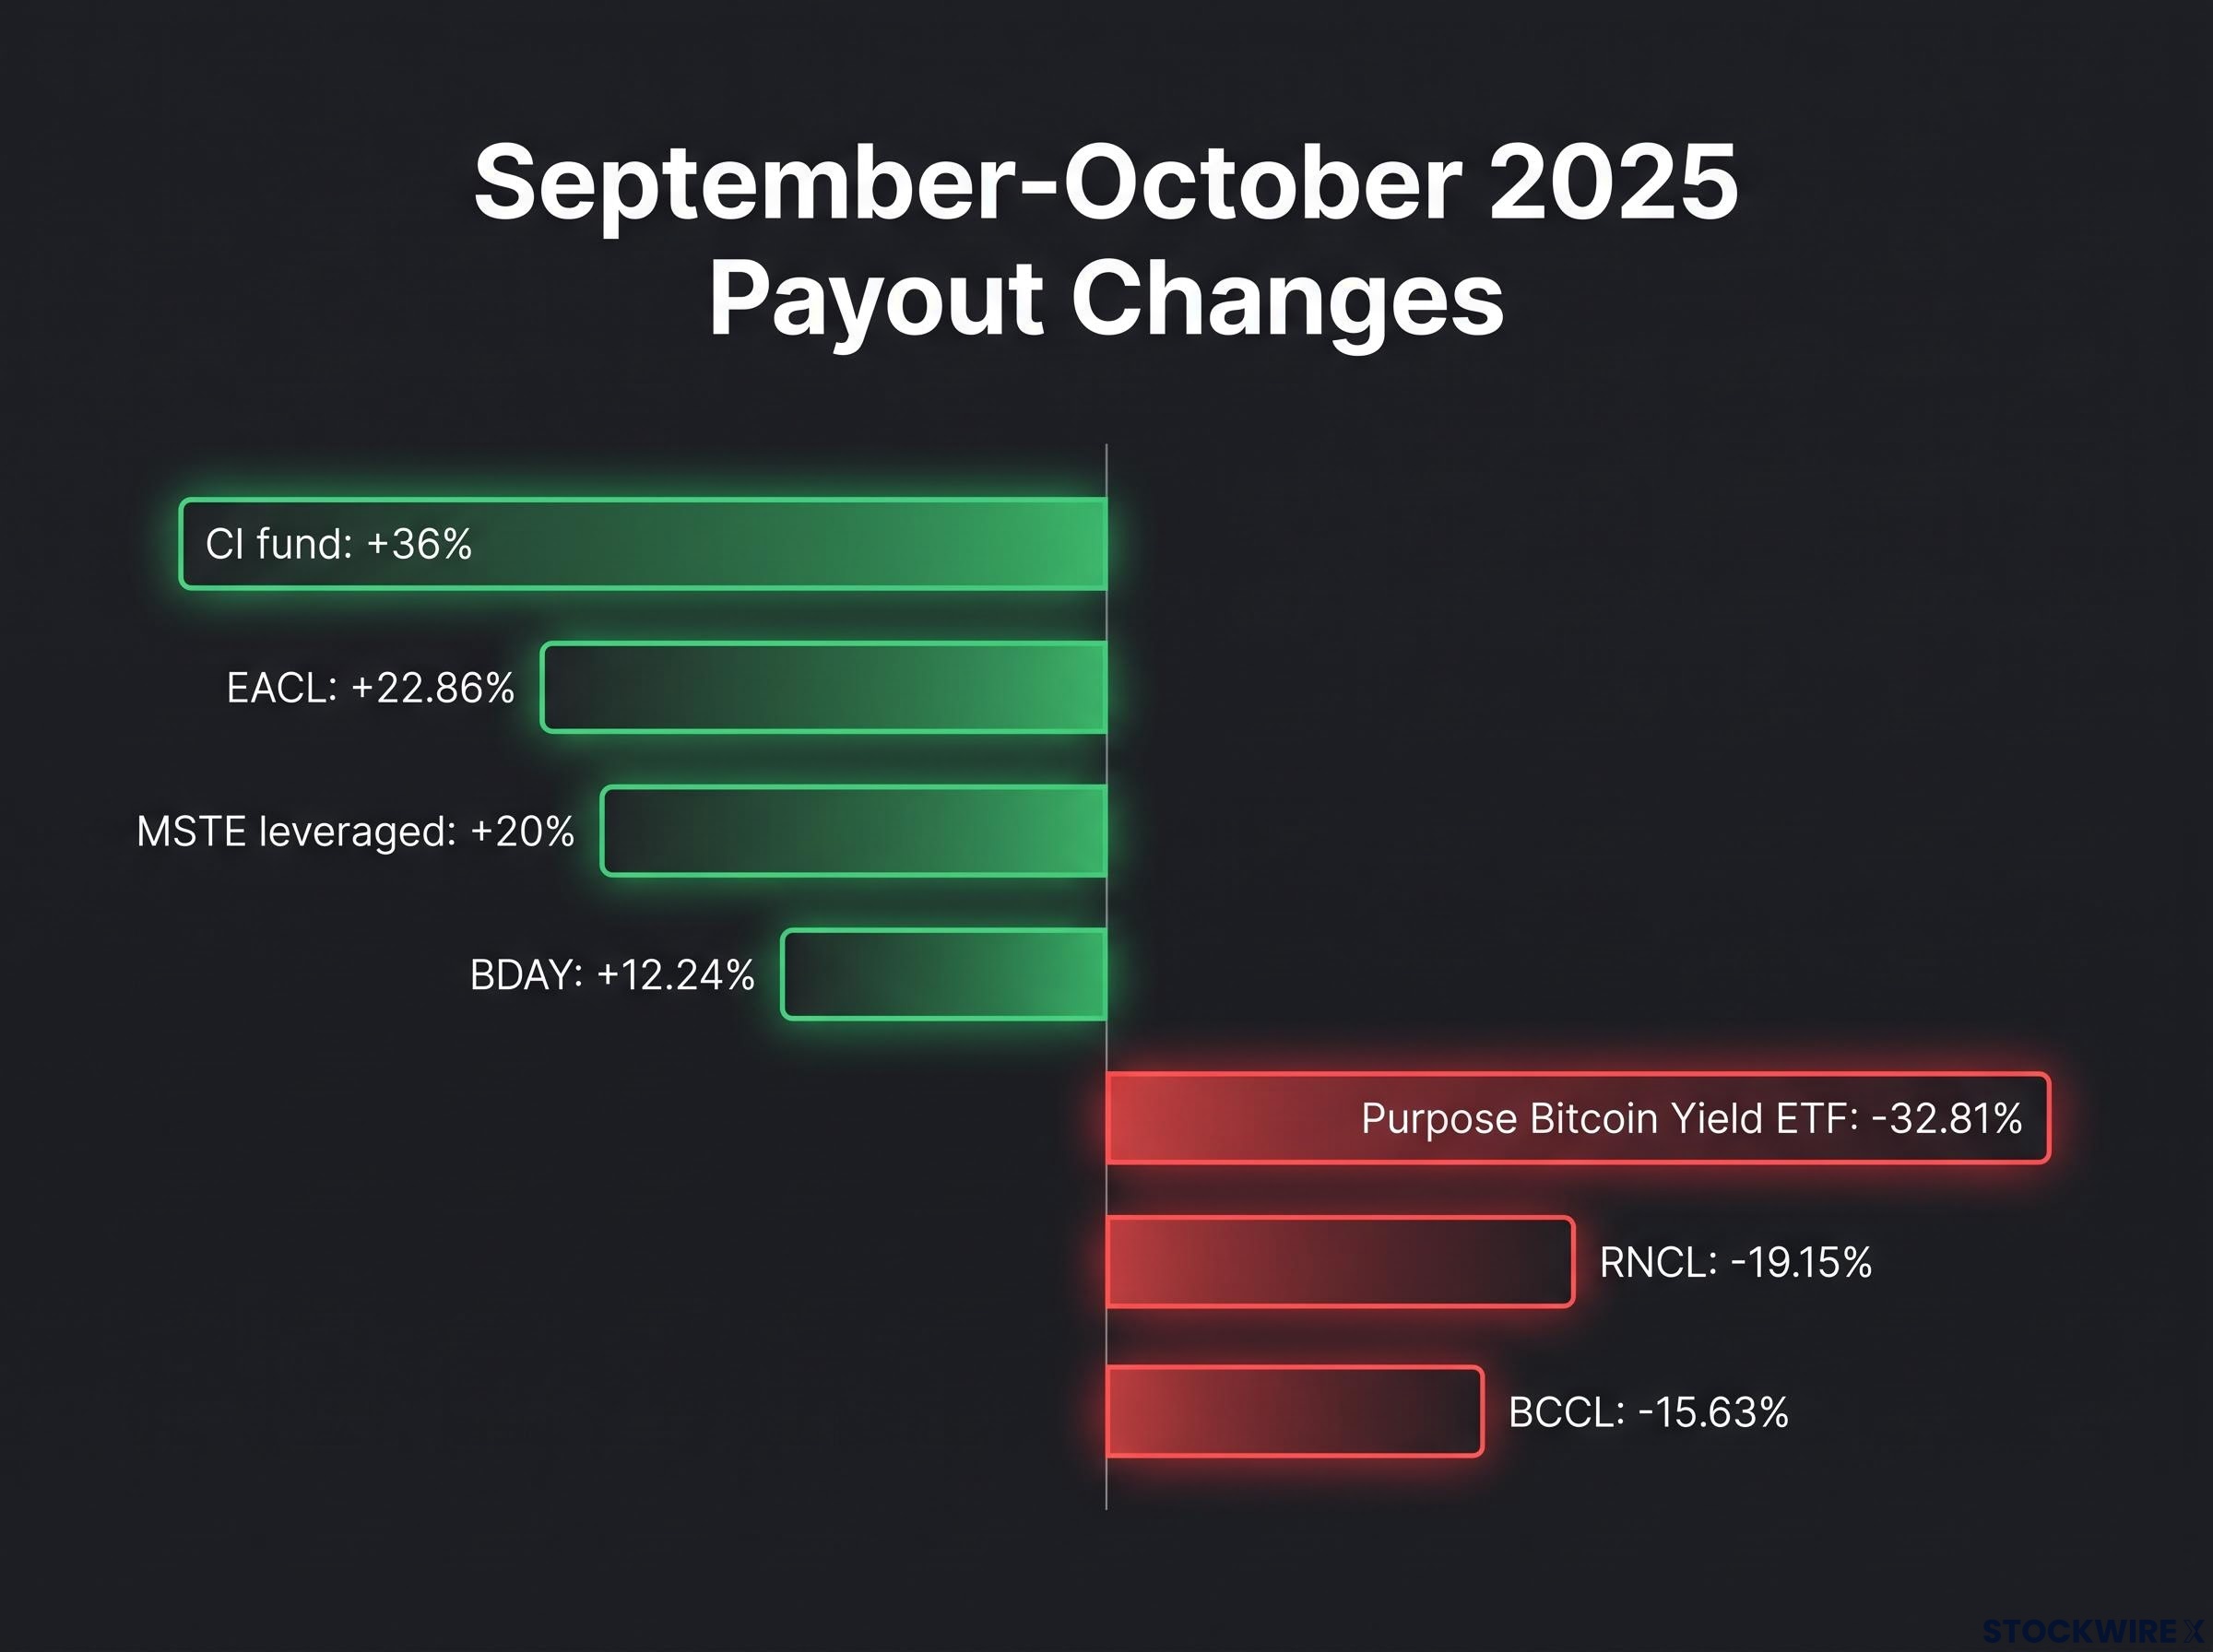
Where payouts rose
MSTE’s leveraged version rose 20% and its non-levered version 14.29%. The Global X emerging markets fund added 13.04%, and BDAY gained 12.24%, helped by its 0DTE structure and a Bitcoin rally.
One caution: issuer per-unit data shows EACL moving from $0.16 to $0.175, about 9.4%, not the tracker’s figure. The gap may reflect timing or calculation differences the tracker does not specify.
Where payouts were cut and why
Then the cuts. The Purpose Bitcoin Yield ETF fell 32.81%, RNCL 19.15% (23.08% over its lifetime), BCCL 15.63%, and Hamilton’s UMAX is down 21.14% over its lifetime.
The presenter ties utility and telecom cuts to rate sensitivity: lower volatility means thinner premiums, and rising bond yields pressure valuations. That is opinion, and dated issuer announcements of these cuts are limited.
Bitcoin funds cutting while Bitcoin rose looks odd, but a steady uptrend lowers realised volatility. Managers may also set strikes further out of the money or overwrite less, so different strategies diverge.
| Fund | Change | Direction | Likely driver |
|---|---|---|---|
| EACL | +22.86% (tracker) | Raise | Leverage, first raise ever |
| MSTE (leveraged) | +20% | Raise | Bitcoin rally |
| BDAY | +12.24% | Raise | 0DTE income on volatility |
| RNCL | -19.15% | Cut | Low telecom volatility, yields |
| BCCL | -15.63% | Cut | Call-writing strategy |
| Purpose Bitcoin Yield ETF | -32.81% | Cut | Call-writing strategy, steadier trend |
A cut in a defensive fund and a raise in a Bitcoin fund can be the same mechanism working normally. Ask what volatility and strategy sit behind a change before calling it good or bad news.
Leveraged covered call ETFs nearly matched index fund returns over 2023-2026, yet the same structures fell sharply in the 2022 bear market, a reminder that the amplification you get on income also applies to losses.
Why fund structure makes some payouts steady and others swing
Concentrated, option-heavy funds such as EACL, RNCL, BCCL, BDAY, MSTE and the CI funds swing. Hamilton’s HDIV and HWLD are funds of funds, holding several covered call ETFs, which smooths the result.
In the case study, HWLD moved 0.61% and HDIV 0.5%. Hamilton’s Maximizer sector funds typically vary only 1-2% either way.
| Fund type | Examples | Typical payout movement | Why |
|---|---|---|---|
| Concentrated, option-heavy | EACL, RNCL, BCCL, BDAY, MSTE | Large swings | Tied to one sector or asset’s volatility |
| Fund of funds | HDIV, HWLD | Small changes | Spread across several covered call ETFs |
Steady is not guaranteed. HDIV is monthly and not guaranteed, paying $0.1900 on 29 May 2026, within a range of roughly $0.183-$0.195 across 2025-2026.
Variability also continued after the case study. BDAY’s semi-monthly payout went from $0.185 in July 2026 to $0.196 from late August to mid-September, then $0.220 on 29 September and 15 October 2026.
Timing can distort comparisons too:
- Semi-monthly payers can make short-term changes look larger than they are annualised
- EDHI and USHI paid only half their distribution in September 2025, with the full schedule from October
Match a fund’s payout stability to how much income variability your plans can absorb.
Can you plan income around a one-month jump?
A 36% raise looks like a pay rise. It is not one, because the following month could bring a steep drop, which makes it a poor basis for planning.
Reversal risk A large jump driven by unusually high volatility may not recur, and a cut can follow just as quickly.
Return of capital (ROC) matters here. It reduces your adjusted cost base, the figure used to calculate your gain when you sell, and if payouts exceed sustainable income it can erode net asset value (NAV).
Return of capital is only one of several T3 distribution categories a covered call ETF can report, and the mix determines how much of each payout you actually keep after tax.
Leverage of 25% amplifies both directions, and managers may cut to preserve capital. Global X warns payouts “may fluctuate at any time,” and Hamilton’s BDAY history shows amounts changing over time.
Before relying on a change, ask:
- What is the fund’s stated distribution policy?
- How much leverage does it use?
- What option strategy sits behind the payout?
- Is volatility unusually high or low right now?
- Does the annualised view match the one-month view?
Base income plans on a multi-month average and the stated policy, treating spikes as information about conditions, not a new baseline. This article describes historical mechanics and makes no projections.
Reading the next distribution change with a clearer lens
Distributions follow volatility, leverage, strategy and structure, so direction alone says little. A raise can be a one-month artefact, and a cut can be a defensive fund behaving normally.
The habit is simple: identify the driver, check the stated policy, and look past a single month. At the next change, compare your holding’s trailing distributions with its strategy before drawing a conclusion.
This article is for informational purposes only and should not be considered financial advice. Investors should conduct their own research and consult with financial professionals before making investment decisions. Past performance does not guarantee future results.