Most people judge AI’s climate problem by looking at data-centre electricity bills. A peer-reviewed study cited by Jefferies suggests that is the smaller part of the picture: it puts AI’s net effect at 0.47-1.8 gigatonnes (Gt) of extra CO₂ per year, and most of that never passes through a data-centre meter.
The usual assessment sets AI’s power demand against its help in speeding up clean energy. That leaves out a third factor, which is oil and gas companies using AI to produce more. It matters now because AI infrastructure spending is accelerating and investors are already pricing it.
After this, you will know what “enabled emissions” are, how large the estimate is and where it is uncertain. You will also see how it changes the way you assess AI infrastructure, energy stocks and ESG exposure.
What is the third factor that standard AI carbon emissions assessments miss?
Most readers already carry a two-sided ledger in their heads. On one side sit data centres, which burn electricity. On the other sit the clean energy gains AI might deliver.
That ledger is incomplete. The study, published in npj Climate Action (a Nature Portfolio journal) by Will Alpine, Nathan Geldner, Holly Alpine and Maksym G. Chepeliev, adds a third term. Will and Holly Alpine are former Microsoft sustainability employees who now lead the Enabled Emissions Campaign. The authors published a correction on 8 September 2026, so this article relies on the corrected version.
The full ledger has three terms:
- Data-centre demand: the electricity AI itself consumes.
- Renewable-side gains: emissions avoided because AI improves clean power forecasting, siting and operations.
- Fossil-side enabled emissions: extra oil and gas burned because AI made production cheaper or more productive.
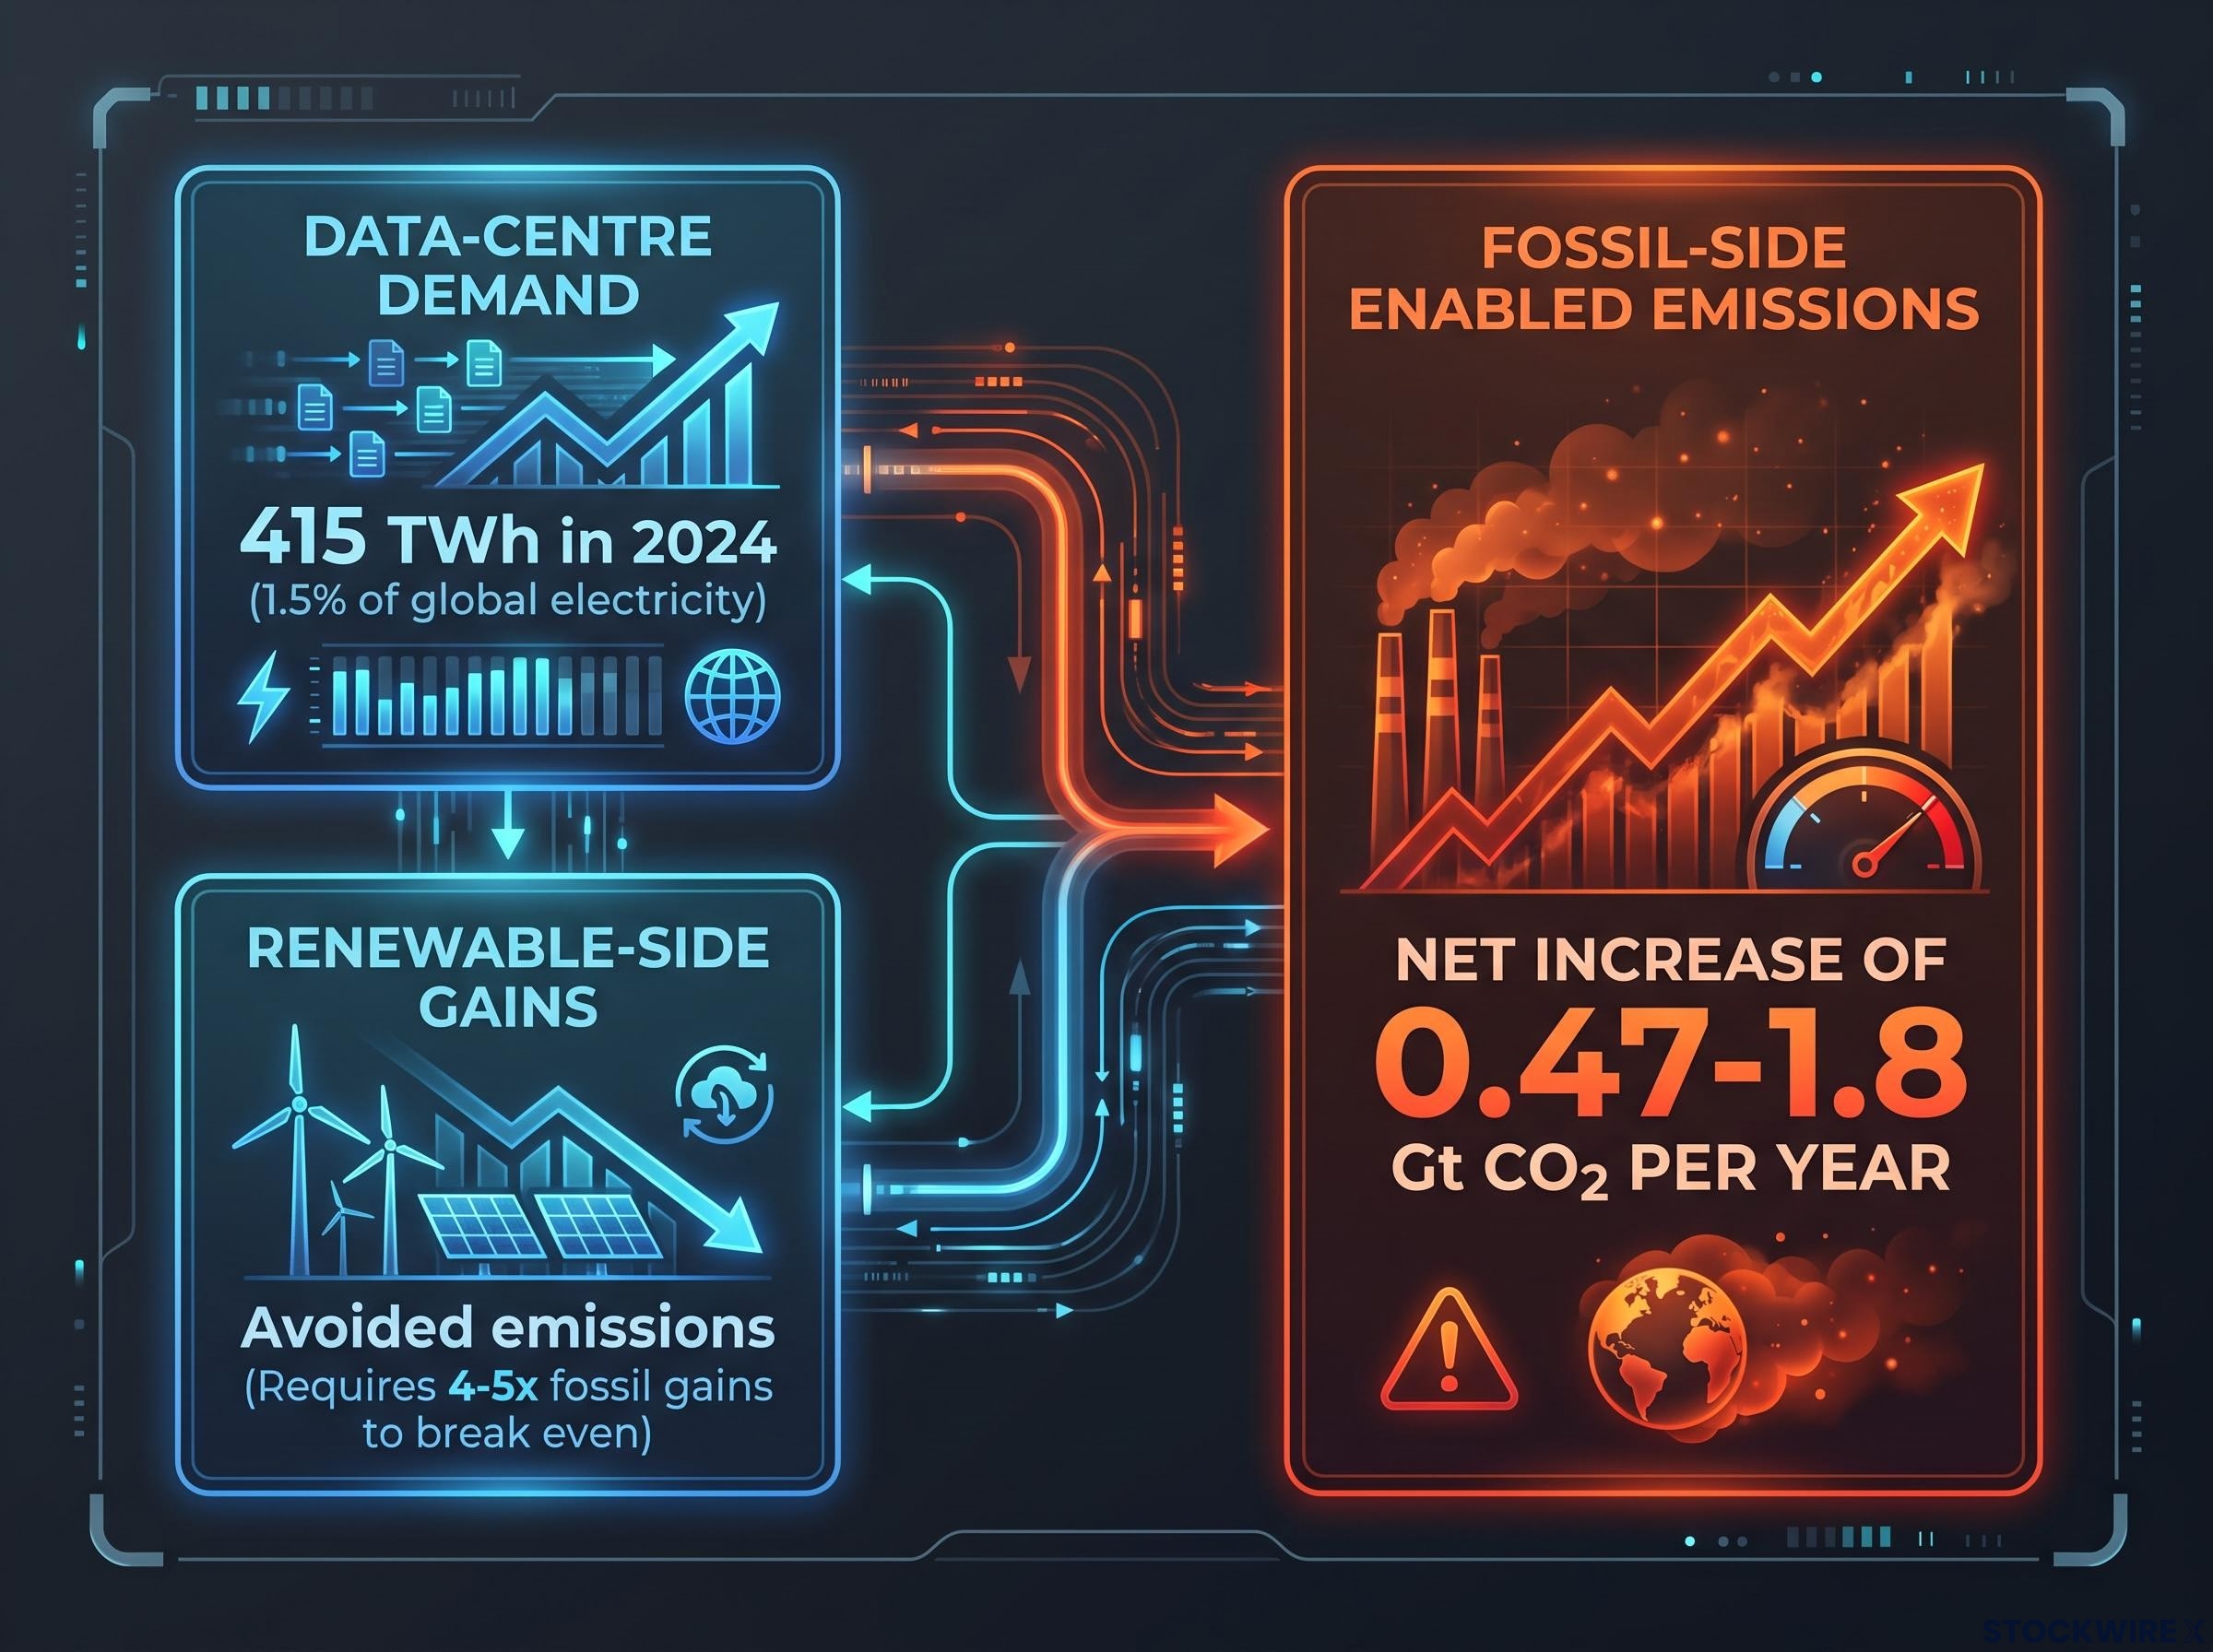
The International Energy Agency (IEA) estimates data centres used about 415 TWh in 2024, roughly 1.5% of global electricity. That is the figure most people quote, and it covers only the first line of the ledger.
Your picture of the first ledger line gets sharper once you see how data-centre electricity demand is reshaping national grids, with hyperscalers now securing firm power through nuclear agreements and direct power purchase deals.
Jefferies’ sustainability and transition strategy team flagged the gap, as reported by Investing.com on 4 October 2026 (the note itself is not openly accessible).
The Jefferies framing As reported, typical assessments of AI’s environmental effect may overlook oil and gas companies using AI to expand output.
If you have been judging AI’s climate impact by data-centre power use alone, you have been measuring one of three terms, and probably not the largest.
Enabled emissions versus operational emissions
Operational emissions come from the electricity AI consumes. Enabled emissions come from the combustion AI makes possible.
Take an oil field that AI helps recover more crude from. The servers’ power use is the operational part; every extra barrel burned is the enabled part.
When big ASX news breaks, our subscribers know first
How does AI help oil and gas producers pump more, and why can it outweigh renewable gains?
The study models AI as a productivity shock that cuts both ways, run through a computable general equilibrium energy model. That is a economy-wide model that tracks how changes in one part of the energy system ripple into prices, supply and demand elsewhere.
On the fossil side, the applications are practical. AI helps firms lower drilling costs and raise recovery from existing fields.
| Application area | What AI does | Effect on supply or output | Emissions effect |
|---|---|---|---|
| Fossil: exploration and subsurface imaging | Targets deposits and interprets seismic data | More discoveries, lower drilling costs | Raises enabled emissions |
| Fossil: reservoir modelling and production | Optimises extraction from existing fields | Higher recovery, more supply online faster | Raises enabled emissions |
| Renewables: forecasting and siting | Predicts output and picks locations | More efficient clean generation | Avoids some emissions |
| Renewables: operations | Improves system efficiency | Better use of existing assets | Avoids some emissions |
The asymmetry follows from scale and profitability. Cheaper extraction can make resources that were previously uneconomic worth drilling, which expands supply. Renewable-side gains mostly make existing clean assets work better, so their avoided emissions are comparatively smaller, according to the study.
The fossil side of the ledger also sits against a tight backdrop: the global oil supply crisis has pushed Saudi output to a 36-year low and drawn inventories at a record pace, which sharpens producers’ incentive to adopt cost-cutting AI.
The study’s break-even test makes the point sharply. Renewables productivity gains would need to be roughly 4-5 times larger than fossil gains for net emissions to break even. For AI to be net-positive on this measure, clean energy has to win by a wide margin, not merely keep pace.
The rebound effect in plain terms
The rebound effect is the tendency for cheaper production to increase total use. When a fuel costs less to produce, prices can fall, and people and businesses tend to burn more of it.
The closest precedent is horizontal drilling and hydraulic fracturing, which greatly expanded North American output. AI could play a similar role globally, though that is a parallel rather than proof. The research found no operator-specific deals or quantified cost savings, so the mechanism is plausible but not yet documented company by company.
How big is the estimate, and how does it compare with data-centre emissions?
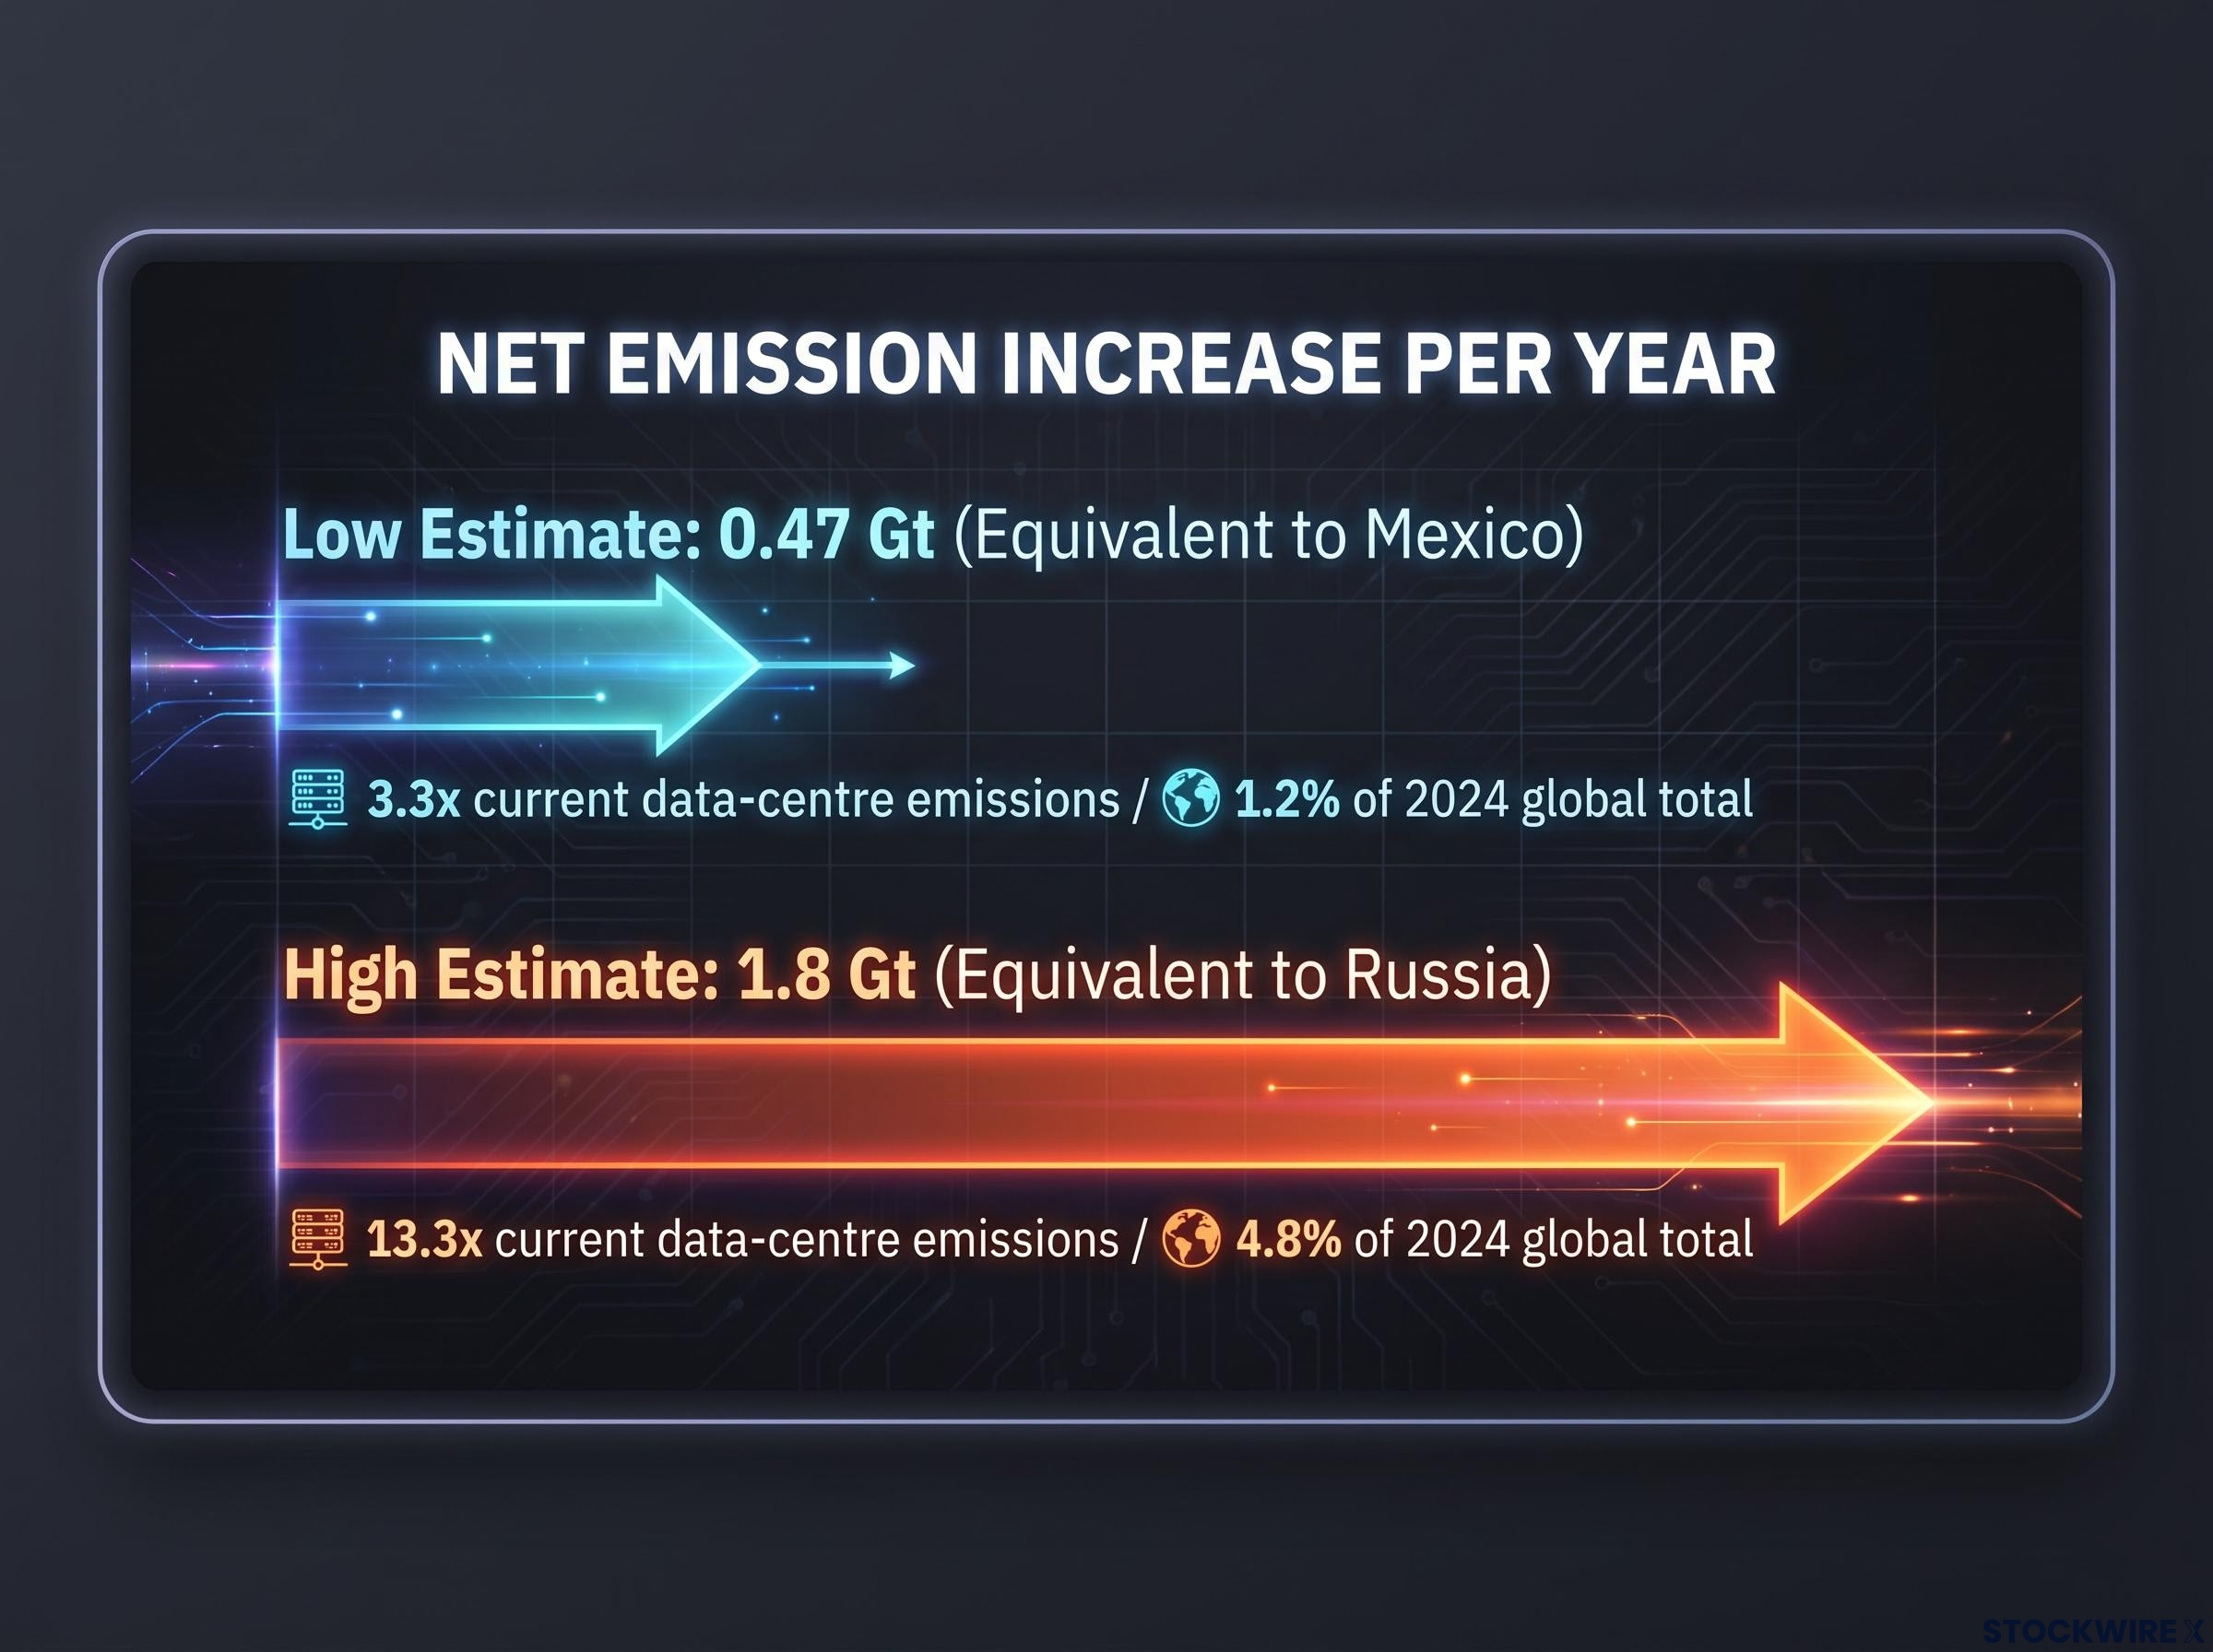
Start with the headline. Enabled fossil emissions come to 0.6-2.4 Gt of CO₂ a year, and after subtracting renewable-side avoided emissions the net increase is 0.47-1.8 Gt.
That equals about 1.2-4.8% of 2024 global energy-related emissions. Wired’s comparison makes it tangible: the low end is similar to Mexico’s annual emissions, the high end similar to Russia’s.
| Measure | Low estimate | High estimate | Comparison point |
|---|---|---|---|
| Enabled fossil emissions (per year) | 0.6 Gt | 2.4 Gt | Before renewable-side savings |
| Net increase (per year) | 0.47 Gt | 1.8 Gt | Mexico (low), Russia (high) |
| Share of 2024 energy-related emissions | 1.2% | 4.8% | Global total |
| Multiple of current data-centre emissions | 3.3x | 13.3x | IEA data-centre estimates |
Set that against the data-centre side. In the IEA Base Case, electricity generation for data centres rises from 460 TWh in 2024 to over 1,000 TWh by 2030 and 1,300 TWh by 2035. Associated emissions peak near 320 Mt around 2030, then ease to about 300 Mt by 2035 as power systems decarbonise.
The study’s range dwarfs that peak. Even the low end is large enough to change how AI’s footprint is discussed, though it is a modelled range rather than a forecast.
What could shrink or grow the estimate
The results depend on assumptions the authors tested across 64 scenarios, including sensitivity checks of ±50% on key elasticities. The main caveats:
- Adoption: how widely and quickly AI spreads through upstream oil and gas.
- Demand response: how much extra supply is actually consumed.
- Policy and carbon prices: stronger climate policy could limit demand for extra fossil fuel.
- Net additionality: the model treats much of the extra output as new emissions rather than displacing dirtier supply.
Counter-arguments exist, such as rapid renewables and storage, electrification, and AI used for demand-side efficiency. These are conceptual; no named expert critiques of the methodology appear in the coverage, and the original estimates carry no specific projection date.
What does this mean for AI infrastructure, energy stocks and ESG exposure?
Jefferies said the findings matter for investors weighing the AI infrastructure build-out, because AI’s energy footprint extends beyond data-centre power. Across the sources, wide fossil deployment could push AI’s net impact above both the data-centre footprint and current renewable and efficiency savings.
This is a transition-risk and disclosure question, not a signal to exit AI or energy holdings. It changes which questions are worth asking.
Spending is shifting from software toward physical power and hardware, and your view of AI infrastructure investment should account for how secured long-term power agreements and balance sheet strength shape which companies carry the most transition risk.
| Exposure type | Near-term effect | Longer-term risk | Question to ask |
|---|---|---|---|
| AI infrastructure and hyperscalers | Rising data-centre demand | Weaker ESG profile, even with renewable power purchases | Is enabled-emissions exposure disclosed? |
| Upstream oil and gas | AI-driven recovery can support valuations | Higher transition risk | How is AI used in production? |
| ESG-screened funds | Screens count operational emissions | Footprint may be understated | Does the screen count enabled emissions? |
The research found no specific gas-fired data-centre power deals and no quantified operator savings, so none are assumed here. Three questions to ask when reviewing AI-linked holdings:
- Does the company report only its own operational emissions, or also those its technology enables?
- Does its customer base include upstream oil and gas producers?
- Does your ESG screen or fund methodology count enabled emissions at all?
Weighing the evidence before acting on AI’s emissions story
The data-centre footprint is real but may be the smaller term. The fossil-side effect is model-based, yet the mechanism is plausible. For you, the consequence is a transition-risk question rather than a verdict on any single stock.
Three developments are worth watching: independent replication of the study, operator-level disclosure of AI use in upstream production, and whether ESG frameworks begin to count enabled emissions.
This article is for informational purposes only and should not be considered financial advice. Investors should conduct their own research and consult with financial professionals before making investment decisions. These statements are speculative and subject to change based on market developments, and model-based projections are subject to various risk factors.