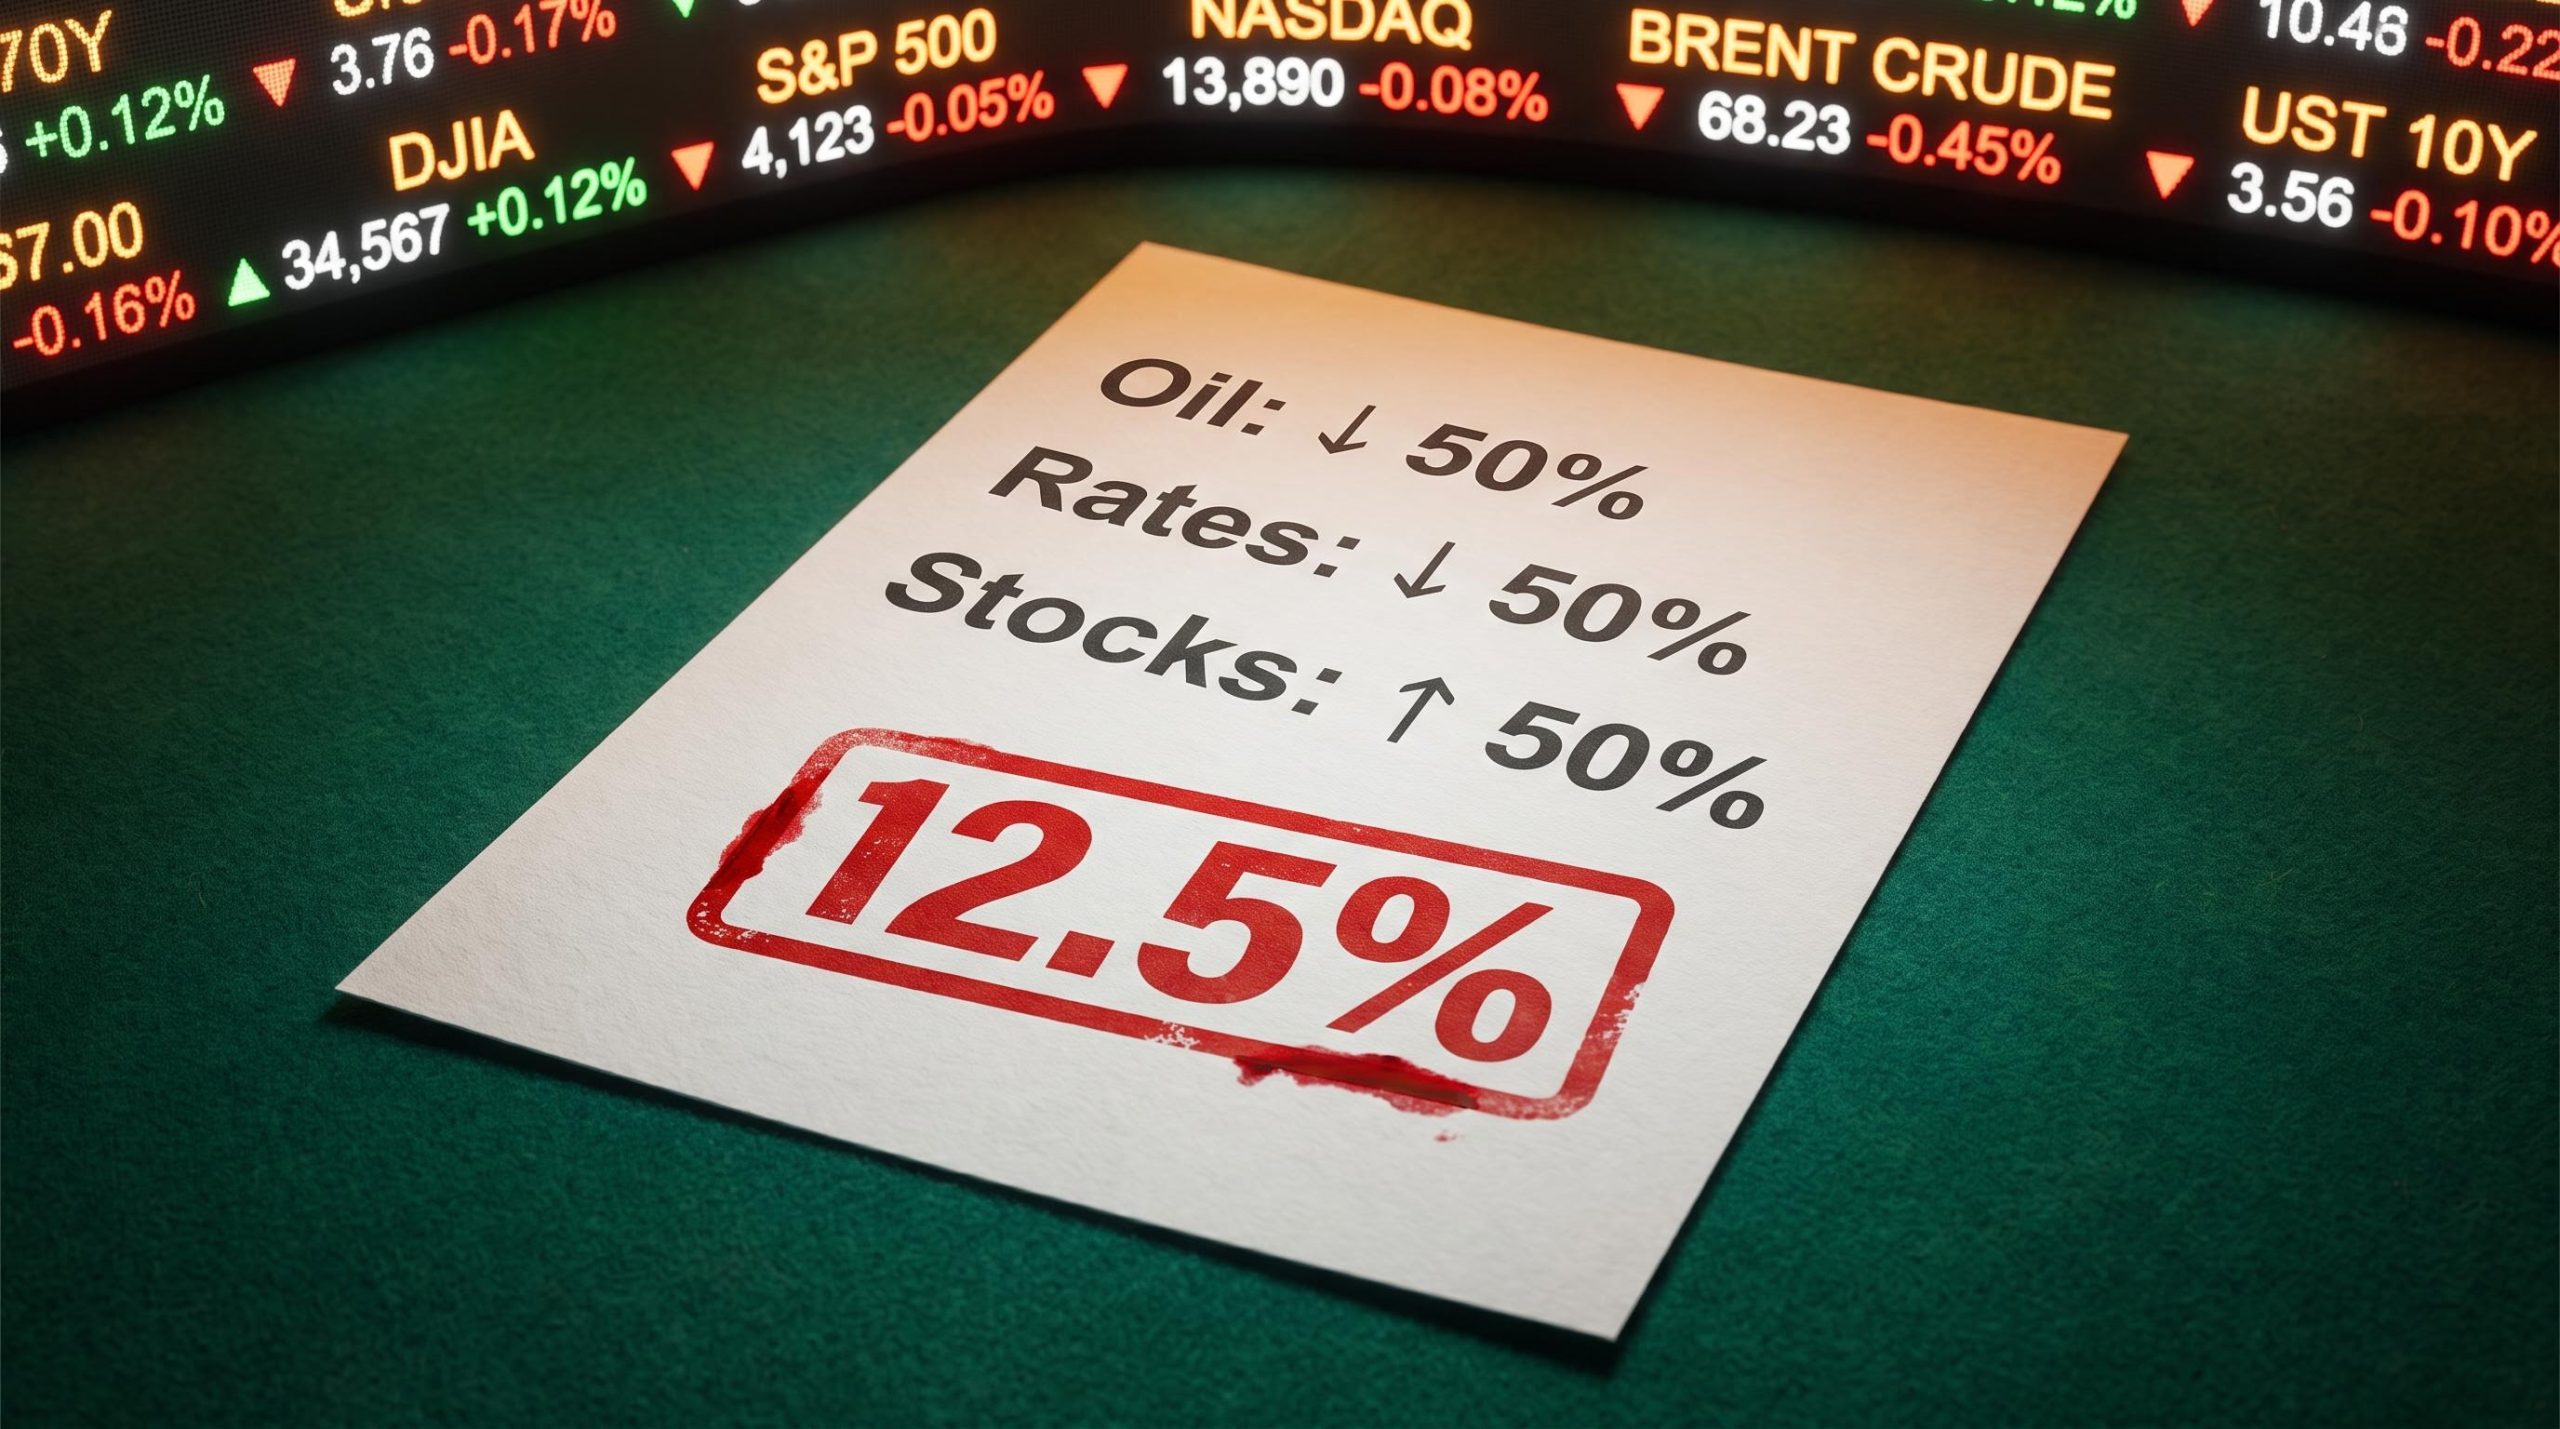
Here is a forecast you have almost certainly encountered in some form: oil prices will fall, interest rates will fall, and the stock market will rise. Each leg sounds reasonable on its own. Put them together, and the combined probability of all three landing is roughly one in eight.
That gap between how convincing a bundled call feels and how unlikely it actually is sits at the centre of how market predictions get packaged and sold to you.
This is not a takedown of any single pundit. You meet bundled market predictions everywhere: in financial media segments, in sell-side research notes, in the marketing decks behind thematic exchange-traded funds. The flaw is in the packaging, not the personality.
Here is what the arithmetic actually tells you, and how to use it. This piece gives you a mental model you can apply to any multi-part call the moment it arrives, whether it comes from a television personality or a research desk at a major bank. Multiply the legs, check the correlations, and ask one simple question about how the forecast is being framed. That is the whole toolkit, and it works on everything.
When three plausible predictions combine into one improbable forecast
Take the three-part call and look at each leg on its own terms.
Will oil prices fall over the next year? Reasonable people land on both sides. Call it a coin flip, roughly 50%. Will interest rates fall? Again, plausible either way, another 50%. Will stocks rise? Markets go up more often than not over long horizons, but over any given window it is genuinely uncertain. Call it 50% as well.
Each one, taken alone, sounds like a defensible view. Now watch what happens when you chain them together.
- Lower oil: 50% probability on its own.
- Lower rates: 50% probability on its own.
- Higher stocks: 50% probability on its own.
To get all three right at the same time, you multiply: 0.5 x 0.5 x 0.5. The answer is 0.125, or 12.5%.
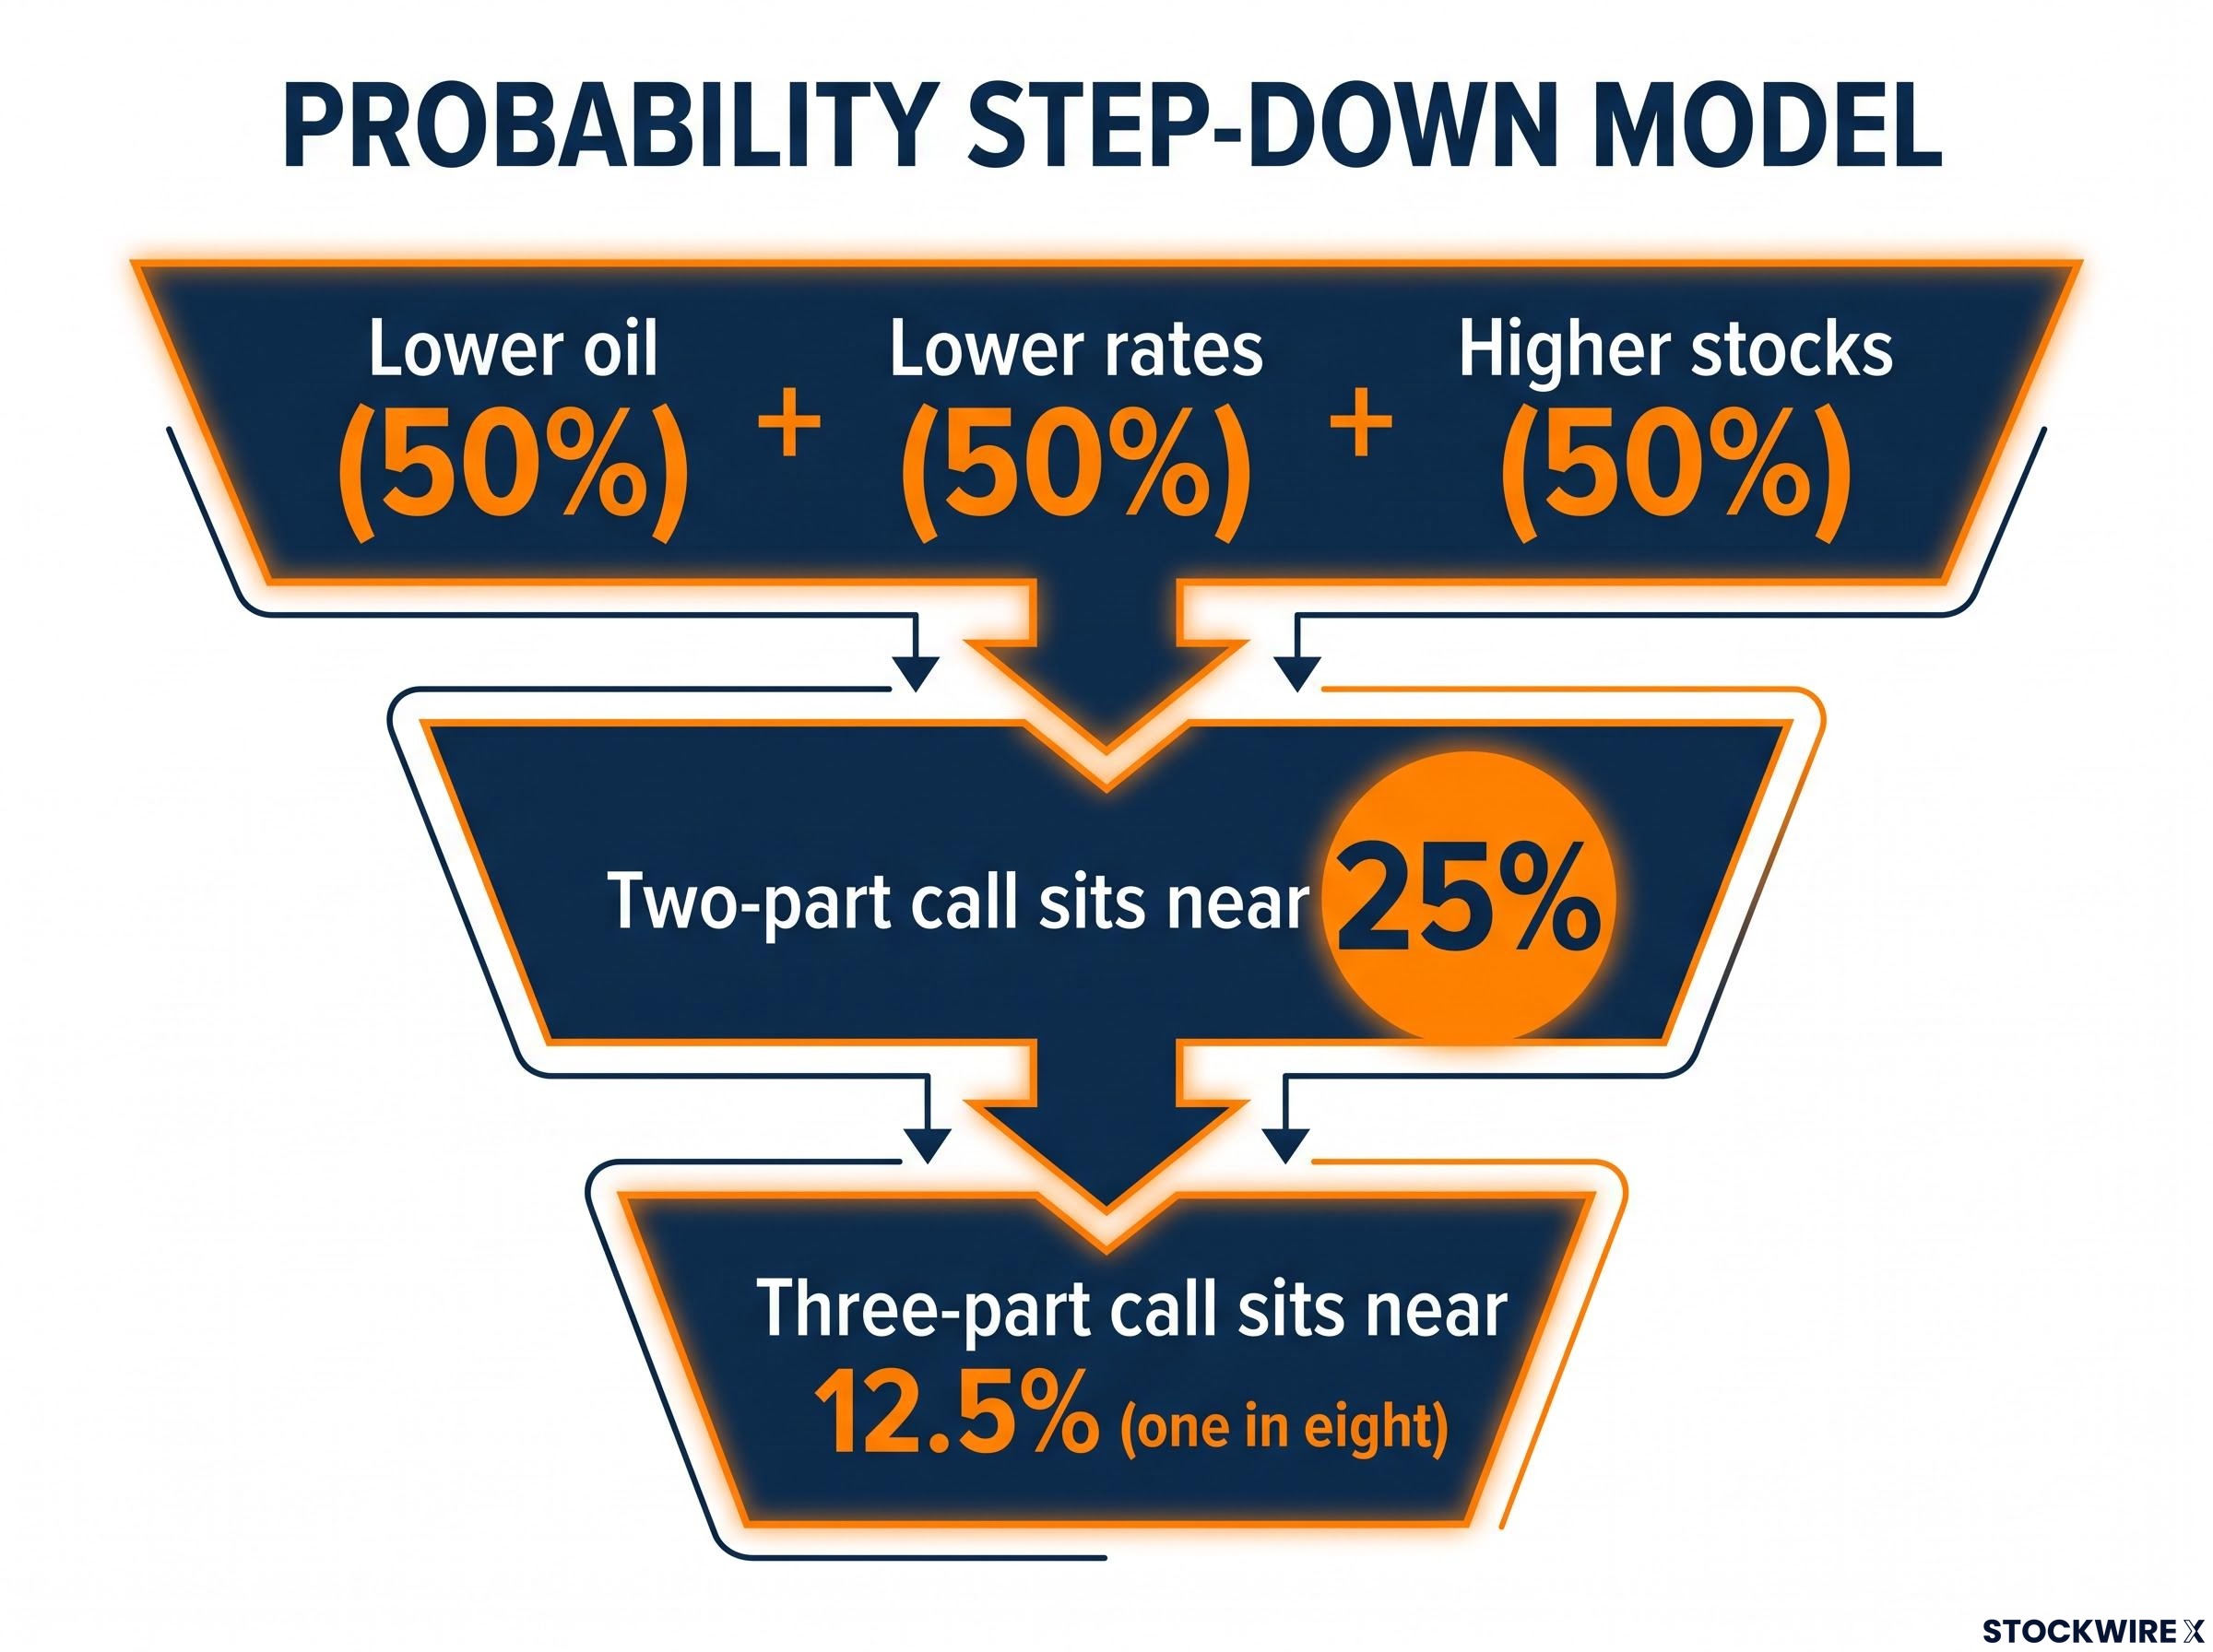
The joint probability of all three legs landing together is roughly one in eight, even though each leg on its own is a coin flip.
That number is the discovery. When a commentator presents this scenario with conviction, describing each piece as sensible and well-reasoned, you are implicitly being asked to bet on a one-in-eight shot dressed up as analysis. That alone should change how you receive it.
Here is the general rule worth holding onto: each additional condition a forecast requires roughly halves the probability that the whole thing is correct. A two-part call sits near 25%. A three-part call sits near 12.5%. A four-part call is already below one in ten. The more detailed and confident the story sounds, the less likely it is to be right in full.
Recency bias in ETF investing amplifies the conjunction trap: when a bundled narrative coincides with a recent run of confirming data, investors overweight the probability that the pattern will continue, which is precisely when the compounding probability math is most dangerous to ignore.
The conjunction fallacy research underlying this pattern shows that people systematically rate a detailed, multi-condition story as more probable than a simpler one, even when the arithmetic demands the opposite, a bias that makes bundled market calls feel more trustworthy than their joint probability warrants.
The conjunction trap: why adding conditions always reduces probability
This is the conjunction problem applied to markets. The more conditions a forecast needs to be true at once, the less likely the whole scenario becomes, no matter how reasonable each individual part sounds when you hear it described in isolation.
There is a useful distinction here. Bundling predictions together can make for a coherent, persuasive story, and coherence is exactly what makes it feel trustworthy. But bundling as a method of predicting the future is mathematically weaker than any single component, because you have stacked the failure risk of every leg on top of one another.
When big ASX news breaks, our subscribers know first
Why oil, rates, and stocks rarely move the way the story requires
The probability math is only half the problem. The other half is that these three variables are not independent coin flips at all. They are jointly determined by the same underlying economy, and the way they interact makes the bundled call structurally strained before you even reach for a calculator.
Consider what usually drives oil and rates down at the same time. Falling oil prices and falling interest rates tend to signal a slowing economy and weak demand. That is precisely the environment where a strongly bullish equity forecast becomes hard to justify. The very conditions that would deliver the first two legs work against the third.
The correlation picture reinforces this. Since roughly 2008, particularly with rates pinned near zero, oil and equity returns have moved together far more often than they have moved apart. Strong equity markets, driven by growth optimism, tend to coincide with rising oil prices, because more economic activity means more energy demand.
Commodity-equity correlations make the bundled forecast problem more acute in practice: gold’s 100-day correlation with the S&P 500 reached approximately 0.52 in 2026, and copper’s hit a record 0.62, confirming that variables investors habitually treat as independent inputs are increasingly moving in lockstep.
Research indicates a 1% positive stock-market shock has been associated with roughly a 0.7% rise in oil prices, the opposite direction the bundled call requires.
The table below shows why the three legs pull against each other in a slowing-growth setting, the environment most likely to deliver falling oil and falling rates.
| Variable | Typical signal in a slowing economy | Alignment with the bullish bundle |
|---|---|---|
| Oil prices | Fall on weak demand | Matches the call, but for a bearish reason |
| Interest rates | Fall as the central bank eases | Matches the call, but signals economic stress |
| Equities | Struggle as earnings expectations weaken | Conflicts directly with the call |
For you as an investor, the takeaway is uncomfortable but clarifying. A forecast that is optimistic on stocks while calling for lower oil is quietly demanding two contradictory readings of the economy at once: strong enough to lift equities, weak enough to drag oil down. That tension should prompt scepticism before you act on either leg.
The scenario that makes all three legs work simultaneously
There is a way for the bundle to hold. It just requires a narrow and uncommon set of forces to line up at the same time.
You would need a supply-side oil glut, meaning cheaper oil because of oversupply rather than collapsing demand. You would need consumer activity to stay robust, keeping earnings and equities healthy. And you would need a central bank willing to hold rates low despite that strength.
Each of these is individually possible. Their co-occurrence is historically rare. That is what makes the call structurally fragile, on top of, and separate from, the probability math.
What the Cramer ETF experiment revealed about multi-part forecast accuracy
Theory is one thing. In 2023, two funds put the value of personality-driven multi-part market calls to a live market test, and the results give the arithmetic a price tag.
Tuttle Capital Management launched two products in March 2023. SJIM, the Inverse Cramer Tracker ETF, aimed to bet against Jim Cramer’s recommendations. LJIM, the Long Cramer Tracker ETF, aimed to follow them. Both operationalised a thesis about one forecaster’s accuracy, and both became real-world experiments in what happens when narrative-driven forecasting meets the market.
Neither survived long. The comparison below sets their reported outcomes against the S&P 500 over the same windows.
| Fund | Launch | Closure | Total return over life | S&P 500 over same period |
|---|---|---|---|---|
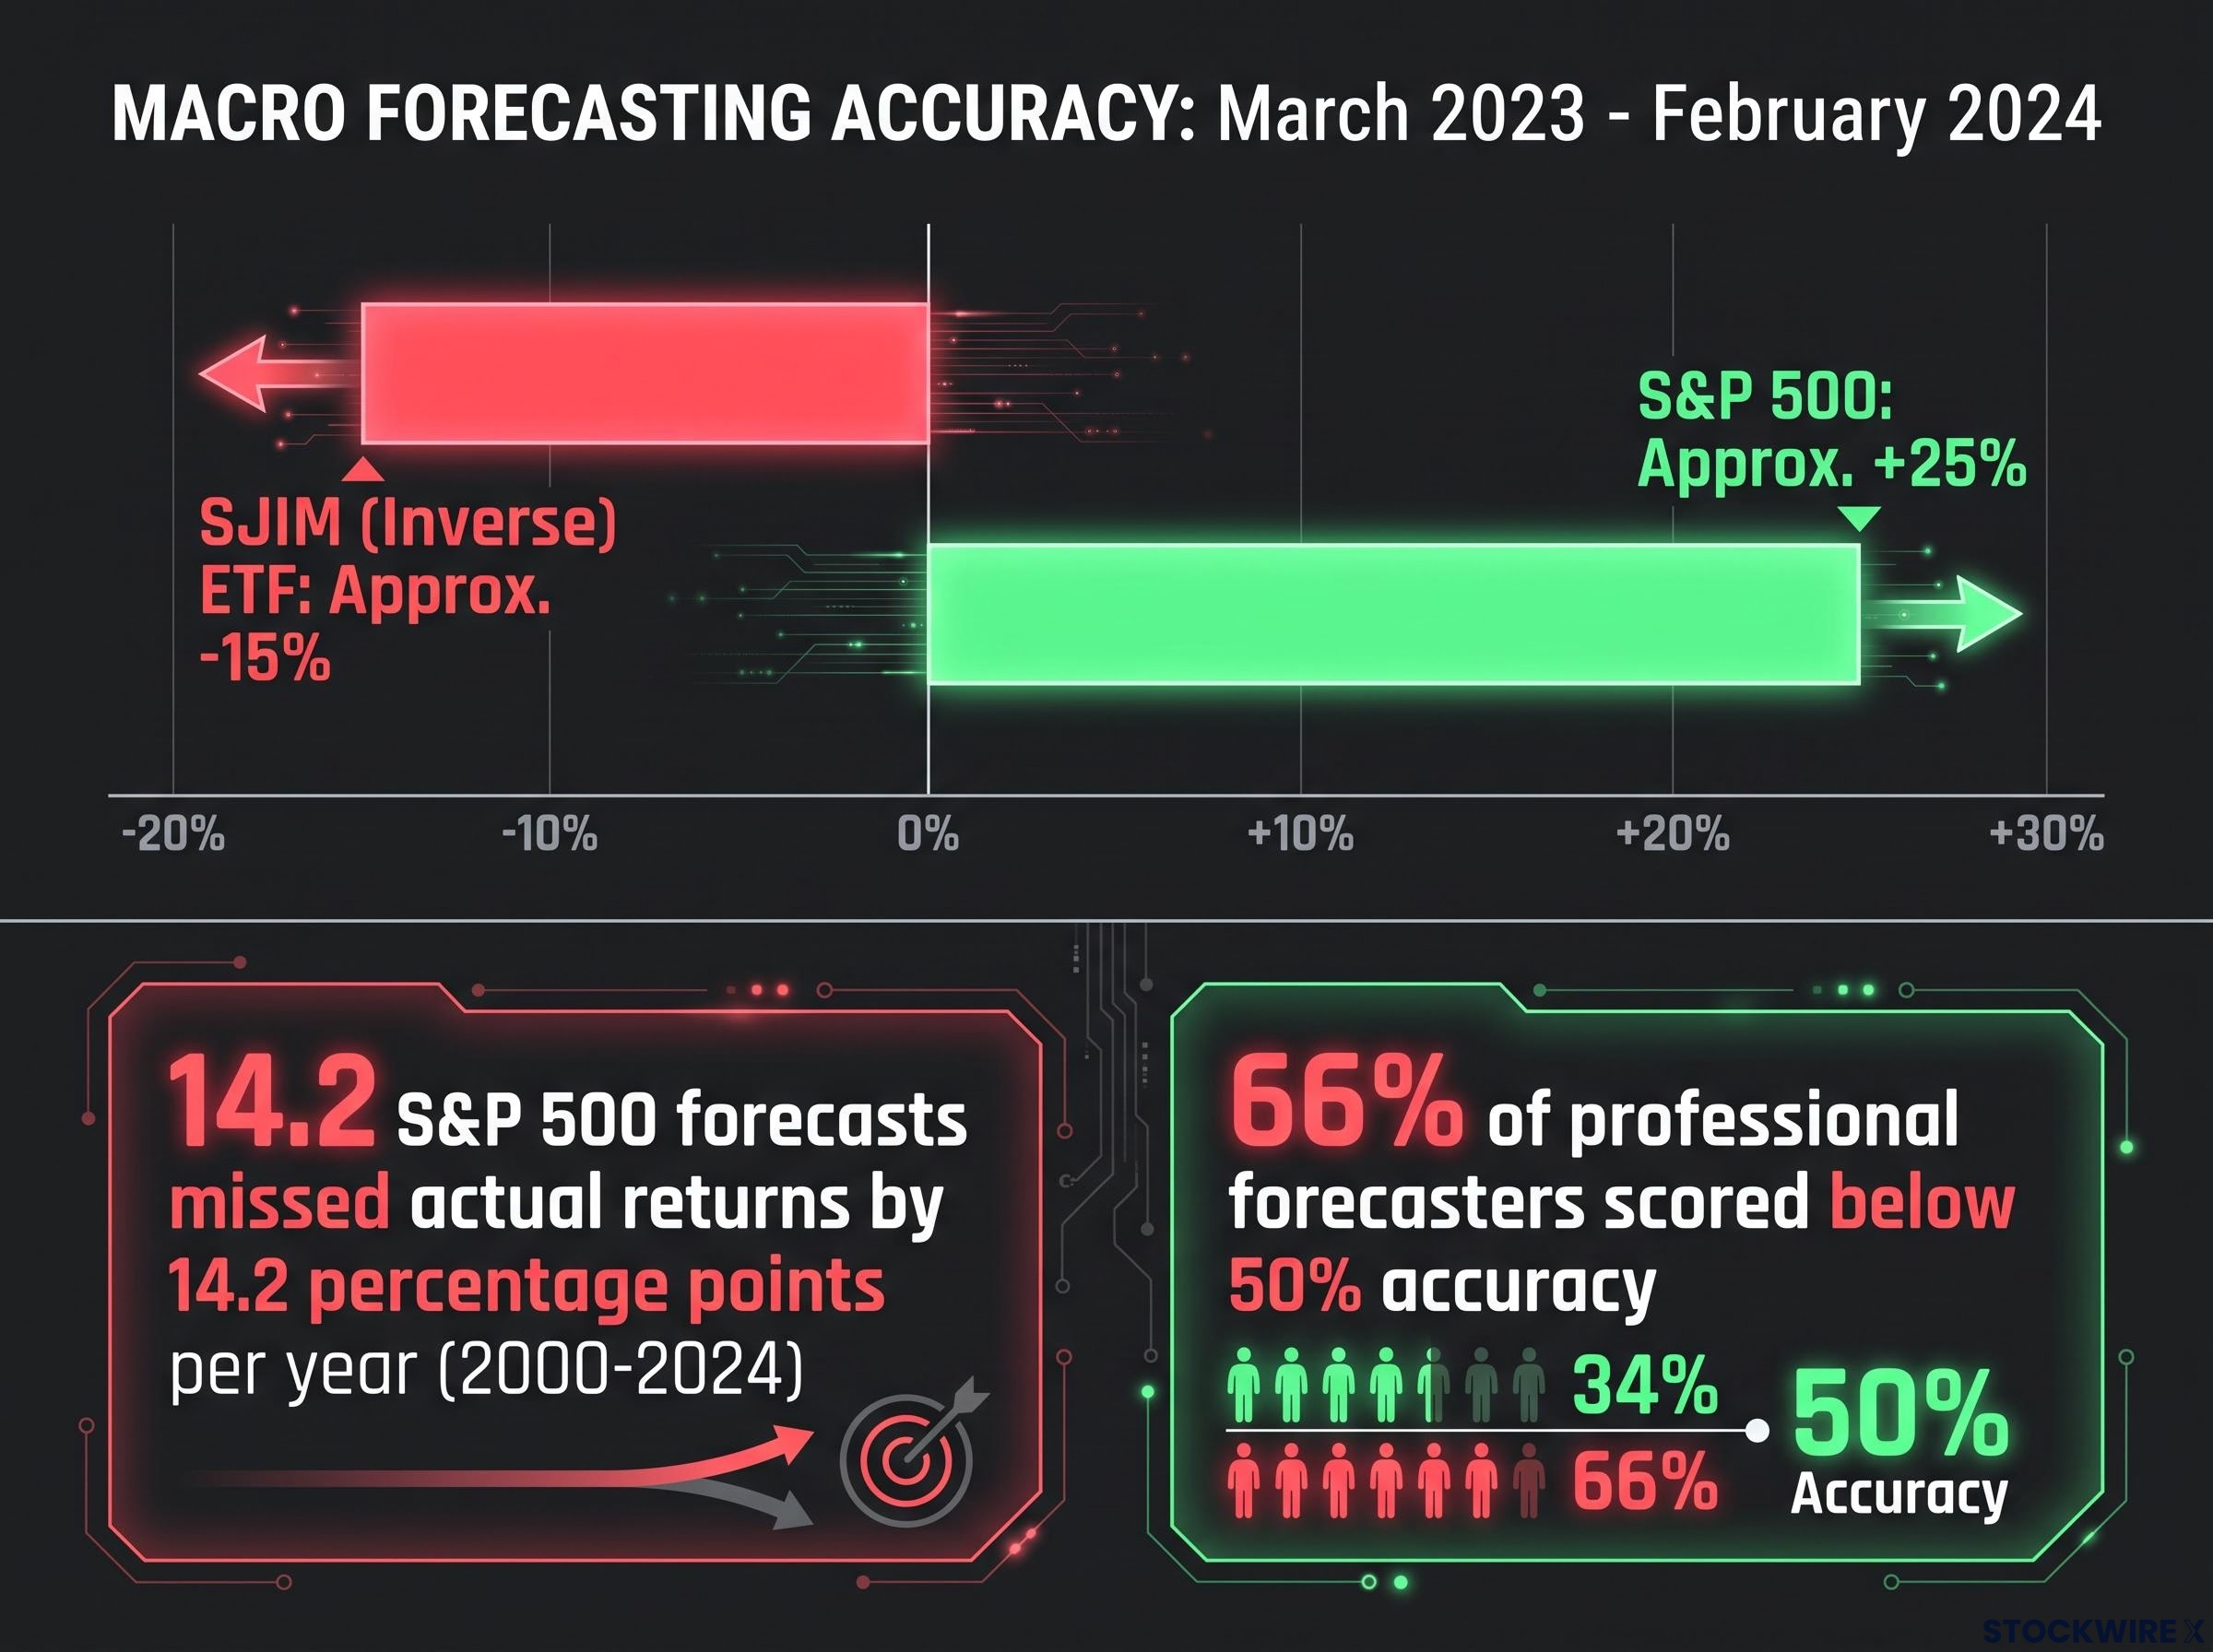
| SJIM (Inverse) | March 2023 | Reported February 2024 | Approx. -15% | Approx. +25% |
| LJIM (Long) | March 2023 | Reported September 2023 | Approx. +2.2% | Broad market gains |
According to available data, SJIM lost around 15% over its roughly 11-month life, while the S&P 500 gained about 25% over the same stretch. LJIM managed a slim gain of about 2.2% before closing after roughly six months. Betting for and betting against the same forecaster both failed to beat simply owning the index.
Here is the important pivot. Neither result is really a story about one man’s stock picks. It is a story about what happens when any bundled narrative thesis, stripped of correlation awareness and joint-probability discipline, is priced against live market conditions.
The broader forecasting record points the same way. From 2000 to 2024, annual S&P 500 forecasts missed actual returns by an average of 14.2 percentage points per year, according to available data, and 66% of professional forecasters scored below 50% accuracy over that span.
Reported data shows S&P 500 annual forecasts missed actual returns by an average of 14.2 percentage points per year between 2000 and 2024.
What this means for you is straightforward. When any forecaster bundles several macro calls into one directional thesis, the outcomes tend to reflect exactly the compounding failure risk the probability math predicts. The ETF closures simply attached a dollar figure to that pattern.
How professionals use bundled scenarios without treating them as predictions
None of this means bundled scenarios are worthless. The problem is not the tool. It is treating a contingency tool as a probability-weighted prediction. Serious institutions use multi-part scenarios constantly, and they do it without pretending to know the future.
Firms such as MSCI and Morningstar build multi-part scenarios as conditional stress tests. They ask what a portfolio does under a baseline path, an upside path, and a downside path, then prepare accordingly. The framing is explicitly hypothetical. They deliberately avoid assigning a precise probability to the bundle, because they know the joint probability of any detailed scenario is low.
That is the difference that matters. A media call says “here is what will happen.” An institutional scenario says “here is what we would do if this combination occurred.” One is a prediction. The other is preparation.
The forecasting research supports this restraint. Philip Tetlock’s work on superforecasters found that the best-calibrated forecasters can be 60% to 85% more accurate than average, but that edge applies to discrete, strictly quantified events, not to sprawling bundled macro scenarios where the variables interact.
For retail investors, the stakes are real. DALBAR data indicates that individual investors guessed market timing correctly only 25% of the time in 2024, according to available data. Acting on a bundled call as though it carries the confidence of a single standalone prediction is a fast route into that failure rate.
A two-question test for any multi-part market call
The next time a three-part call arrives, from a television host or a research note, run it through two questions before you do anything with it.
- Is this a contingency plan or a probability-weighted prediction? A scenario framed as “if this happens, here is the response” is useful preparation. A scenario framed as “this will happen” is a directional bet dressed up as analysis.
- Has the presenter stated the joint probability of all conditions being right at once? If they described each leg as sensible but never multiplied them together, they have skipped the single most important number.
A forecast that fails both questions is entertainment, not analysis. Treat it that way, and you extract the conditional insight from a scenario without mistaking it for a high-confidence forecast.
Applying the probability lens before the next big call arrives
The core insight holds across every pillar of this piece. Bundled market predictions compound uncertainty rather than adding conviction, and that is a feature of the arithmetic, not a comment on any forecaster’s intelligence or intent.
Three independent 50% legs produce a 12.5% joint probability. The correlation between oil, rates, and equities makes the bundle structurally strained on top of that. The Cramer-linked ETF closures showed what both problems look like with real money attached. Three angles, one conclusion.
So when the next big call appears, from a pundit or a bank, run the check:
- Count the legs.
- Multiply the probabilities.
- Ask whether the variables are truly independent or actually correlated, and whether you are being sold a scenario or a prediction.
That habit will not tell you where oil, rates, or stocks are heading. It will do something more useful: it will stop you from acting on a one-in-eight shot as if it were a sure thing.
For investors who have received bundled macro calls packaged as thematic ETF pitches, our dedicated guide to thematic investment evaluation walks through a five-question framework that separates durable structural trends from narratives priced on hype rather than evidence.
This article is for informational purposes only and should not be considered financial advice. Investors should conduct their own research and consult with financial professionals before making investment decisions. Past performance does not guarantee future results. Financial projections are subject to market conditions and various risk factors.