
There is a truck in your neighbour’s driveway. Maybe it is a late-model pickup, maybe a luxury SUV, maybe both parked side by side. You have probably assumed, at least once, that the household behind that driveway is doing well.
That assumption is where the trouble starts.
Social media feeds and the cars parked on your street show you one half of a financial picture: the assets. They never show the loan balances funding those assets. The U.S. personal saving rate sat at just 3.0% as of July 2026, according to the Bureau of Economic Analysis (BEA), which means the typical American household saves almost nothing. Yet the driveways and the Instagram grids signal abundance in every direction.
The BEA personal saving rate data shows this figure has remained historically low for years, meaning the gap between visible consumption and actual wealth-building capacity is a structural feature of American household finance rather than a recent anomaly.
The gap between what you can see and what is actually owed is exactly where wealth gets quietly destroyed.
Here is what the rest of this guide gives you: a concrete way to decode any household’s real financial position using just four numbers, and the same audit applied to your own situation with full precision. This is a shift from comparison to calculation, and it changes what the smart response actually is.
The asset illusion: what you see versus what is owed
You are not being foolish when you look at a neighbour’s new truck and assume money. You are responding rationally to the only data you were given.
The problem is that the data is filtered by design. Assets get posted, photographed, and parked where they can be seen. Liabilities, the loan balances and monthly obligations behind those assets, stay invisible. Nobody puts their auto-loan statement on Instagram.
So you end up comparing your entire financial reality, debts and all, against a highlight reel that carries none of the debt behind it. That comparison is unwinnable, because the two things being compared are not the same kind of thing.
Why the composite wealthy neighbour is a statistical fiction
Here is the mechanism that makes it worse. You do not just observe one household. You observe dozens, across months. A new kitchen here, a holiday there, a promotion announcement, a luxury car in a different driveway.
Your mind quietly stitches these peaks from different households into one imagined person who has all of it at once. That person does not exist. They are a statistical artefact of people publishing their best moments rather than their averages.
The emotional experience of falling behind this composite is completely real, even though the comparison itself is structurally invalid. That distinction matters, because it changes what your rational response should be.
Consider the numbers actually behind the average driveway. Experian’s Q2 2024 data puts the average new-vehicle loan at $40,927 at 6.84% APR over 68.48 months, producing an average monthly payment of $734. That is the reality parked on your street.
Visible inequality and your spending U.S. research on visible inequality finds that comparison pressures from noticeable purchases, clothing, vehicles, dining out, can raise household spending by up to approximately 25% above what it would be without them.
When you feel financially behind your neighbours, you may be reacting to a manufactured signal rather than a real one. That is not a personal shortcoming. It is a data problem, and data problems have solutions.
When big ASX news breaks, our subscribers know first
What the psychology of comparison actually costs you
The illusion is one thing. What acting on it costs real households is another, and this is where the abstraction turns into a number you can find on your own bank statement.
The research chain is consistent. Social comparison feeds fear of missing out (FOMO), FOMO drives compulsive and impulsive buying, and conspicuous buying turns out to be among the strongest predictors of financial stress.
A 2026 study of young adults found that social comparison with influencers increases materialism and predicts compulsive, impulsive, and conspicuous buying, with conspicuous and compulsive buying emerging as the strongest predictors of financial stress. A separate 2024 study found that compulsive social media use correlates with impulsive and compulsive buying, with social comparison and FOMO acting as the key mediators.
Three mechanisms link comparison to real financial harm:
- FOMO-driven buying: the anxiety of missing out pushes unplanned purchases
- Status-signalling expenditure: spending to display wealth to people who are not actually watching
- Opportunity cost displacement: every dollar of visible consumption is a dollar that never gets invested
Comparison is the behavioural driver. Easy credit is the structural enabler. Cheap financing lets a household make a visible purchase without appearing to change its lifestyle at all, which is precisely why the auto loan is the most common vehicle, literally and figuratively, through which comparison-driven spending enters a balance sheet.
Look at what that $734 monthly payment actually adds up to.
The full cost of the average car payment At $734 per month over 68.48 months, the average new-vehicle loan produces roughly $50,200 in total payments on a $40,927 loan. That difference is approximately $9,300 in interest alone.
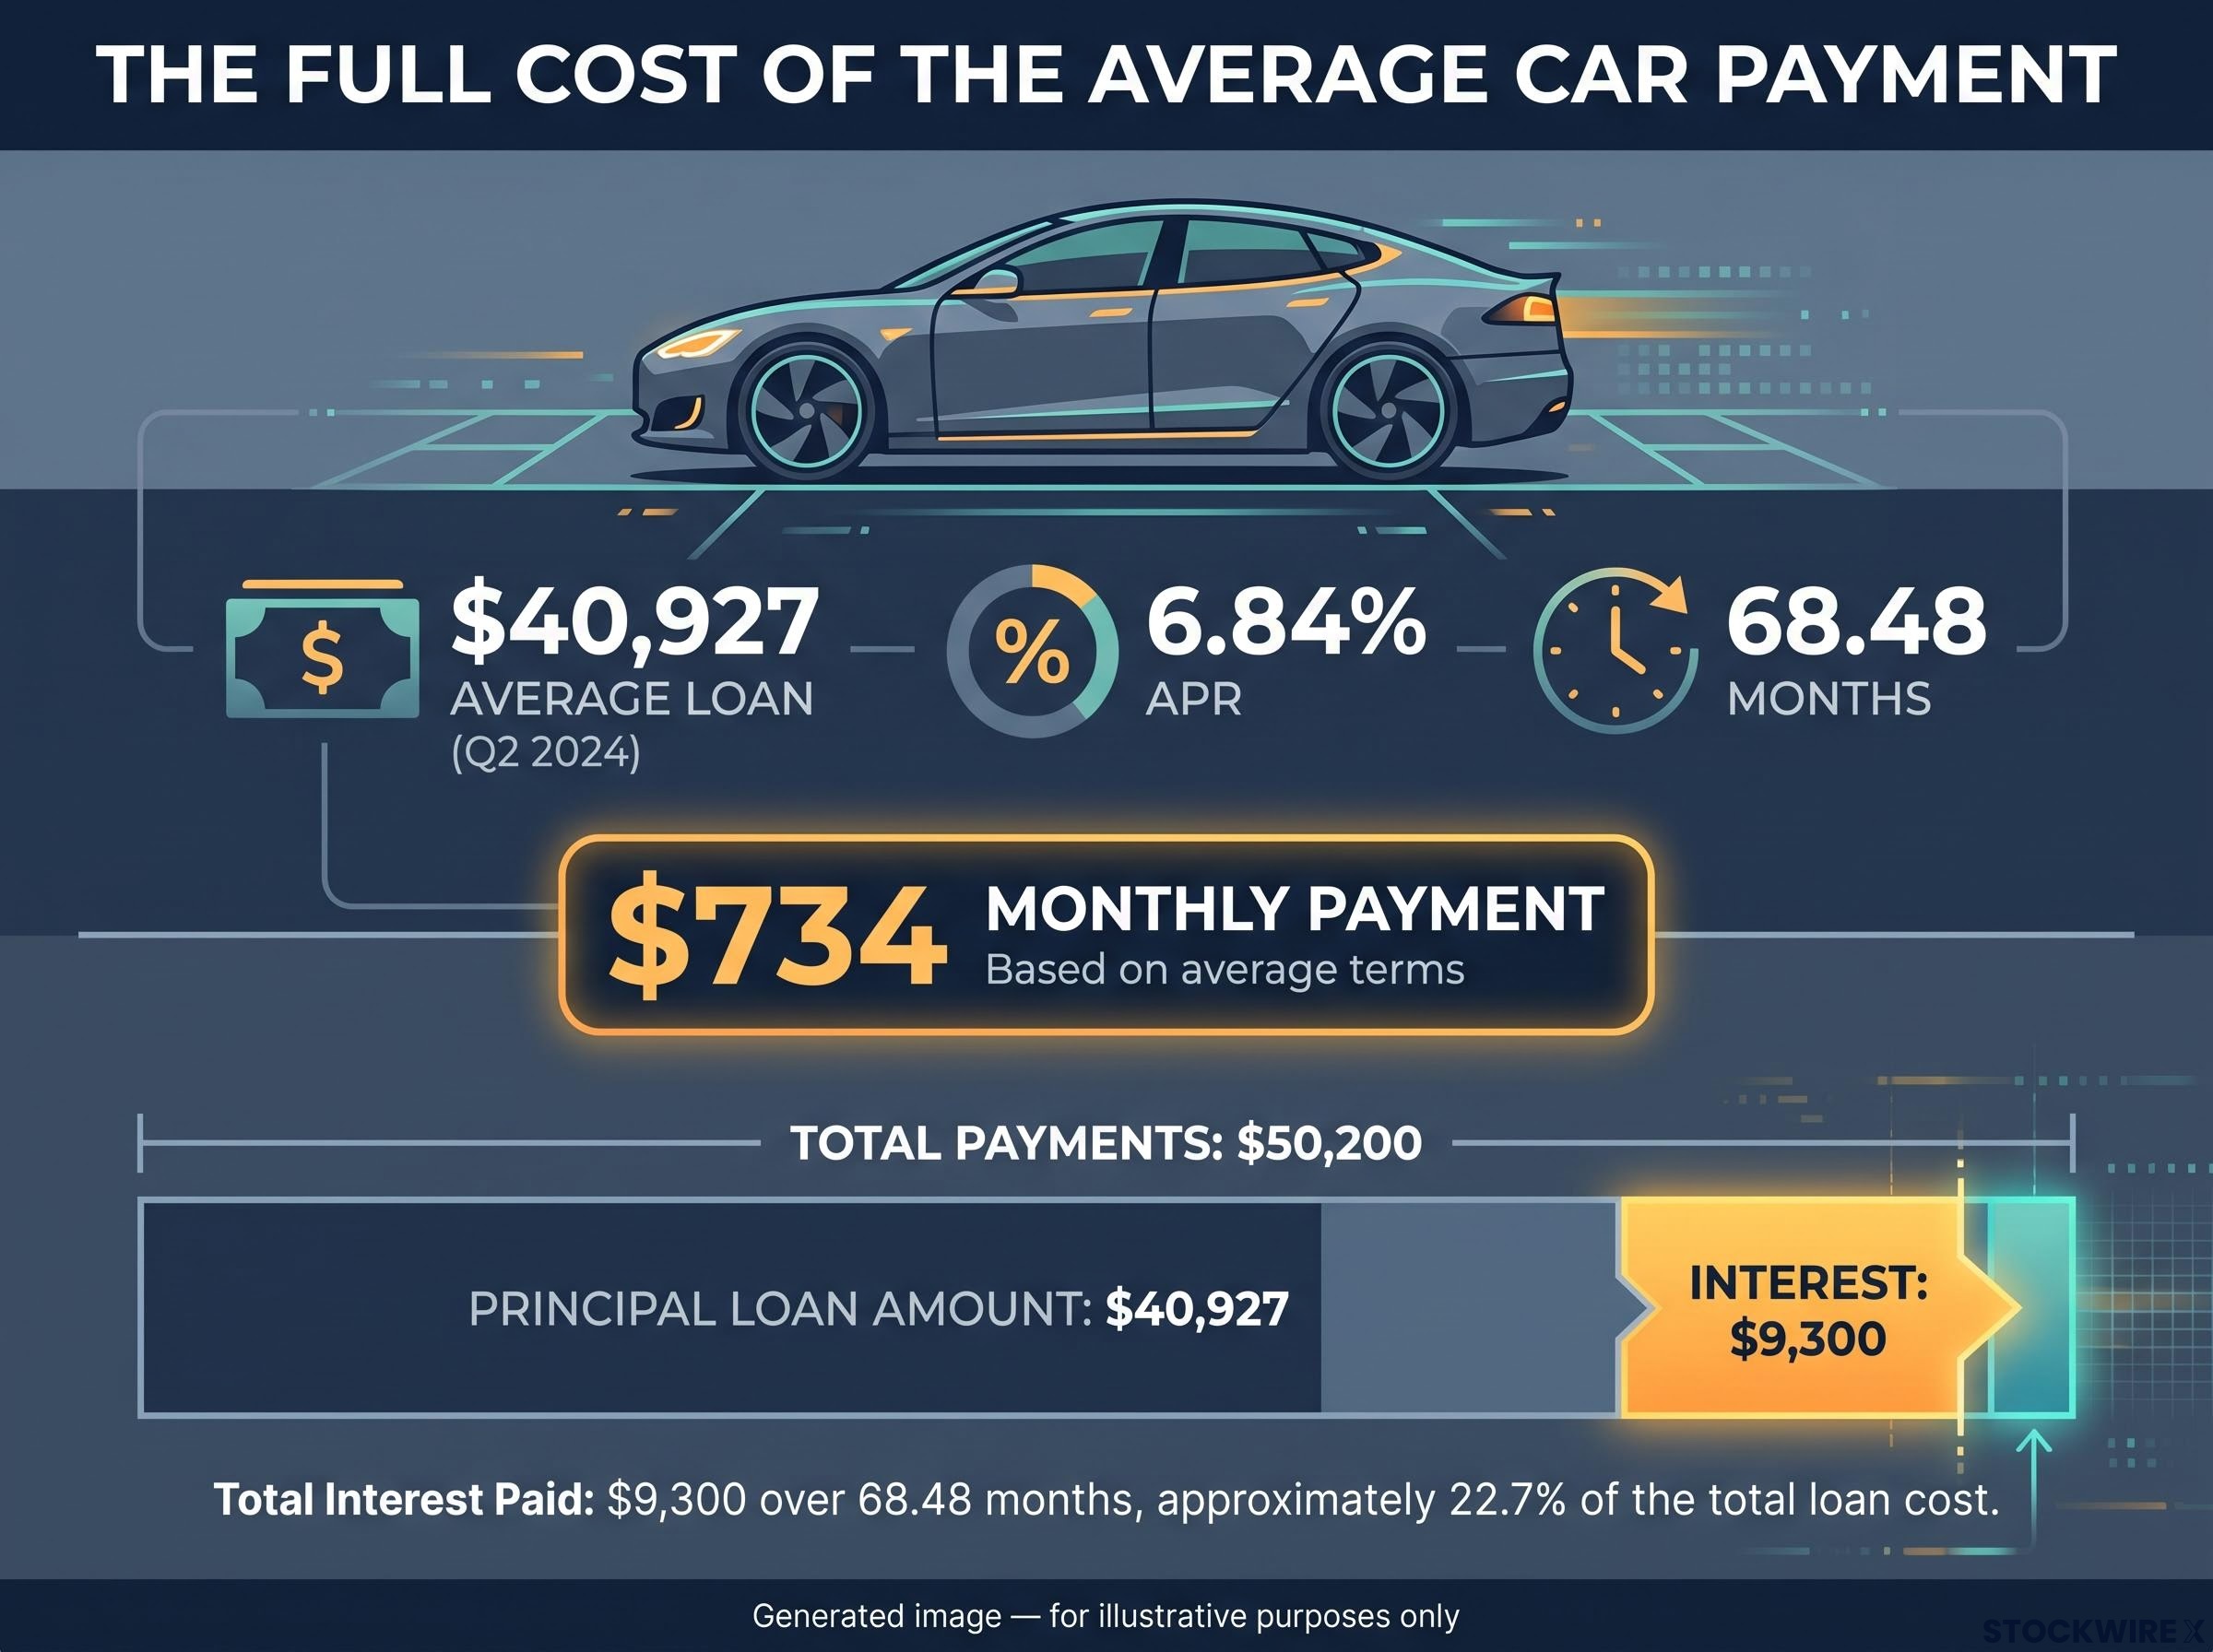
That $734 is not just a car payment. It is the monthly price of social comparison made visible, and it is crowding out the investment contribution that would compound into real wealth over the same ten-year window. Locate that number on your own statement, and the behavioural insight stops being interesting and starts being actionable.
What ten years of different choices actually produces
Take one household earning approximately $117,000 a year, comfortably above the 2024 national median of $83,730 reported by the U.S. Census Bureau. Now run that single income through three different sets of choices over ten years.
The following projections use assumed inputs, a 7% annual investment return and roughly 3% inflation, and are illustrative rather than guaranteed.
The 7% return assumption underpinning all three scenarios reflects the historical performance of diversified equities, and long-term wealth accumulation across 10-20 year horizons depends on keeping that compounding uninterrupted rather than optimising individual investment selections.
Scenario 1 is the vehicle-financing household: saving at the national 3% rate, investing what little is left at 7%. Over ten years it accumulates about $48,600. Subtract the average negative equity of roughly $6,884, and the net position lands near $41,700.
Scenario 2 saves five times harder, 15% of income, but keeps everything in cash yielding about 4%. Nominal accumulation reaches roughly $212,000. Adjusted for inflation, real purchasing power is closer to $184,000, with about $28,000 silently eroded.
Scenario 3 saves the same 15% but invests it at 7% rather than holding cash. Over ten years it reaches approximately $243,000, exceeding the vehicle-financing household by roughly $201,000 and the cash saver by about $59,000.
The mechanism behind this gap is consistent across income levels: normalised spending behaviours like vehicle financing and housing overconsumption compound quietly over a decade, producing wealth divergences that look structural but are mostly behavioural in origin.
| Scenario | Savings rate | Savings vehicle | 10-year accumulation | Versus SCF median (age 35-44) |
|---|---|---|---|---|
| 1. Vehicle-financing | 3% | Invested at 7% | ~$41,700 (after negative equity) | Below median ($135,600) |
| 2. Cash saver | 15% | Cash at ~4% | ~$184,000 (real) | Above median |
| 3. Investor | 15% | Invested at 7% | ~$243,000 | Well above median |
Where these scenarios land against real U.S. peer benchmarks
The Federal Reserve’s 2022 Survey of Consumer Finances (SCF) gives you the calibration frame for the 35-44 age group: $19,000 at the 25th percentile, $135,600 at the median, $415,000 at the 75th, and $1.05 million at the 90th.
The point is not judgement. It is location. These benchmarks show what is structurally possible and where comparison-driven spending moves the needle downward.
The SCF percentile figures are useful anchors, but financial progress benchmarks built around savings rate, emergency coverage, and goal-based contribution tracking give you numbers you can actually move this year, rather than a ranking you can only observe.
The driveway paradox Despite earning above the national median, the impressive-driveway household in Scenario 1 holds less than one-third of the typical $135,600 net worth for its age cohort.
A household that looks successful from the street may be building less wealth over a decade than the household across town whose driveway holds a paid-off ten-year-old car. The numbers make the case with arithmetic, not moralising.
Understanding why some wealth gaps are real and not just optics
Before the framework arrives, an honest acknowledgement: not every wealth gap is an optical illusion. Some are structural, and no amount of budgeting fully neutralises them.
Several genuine advantages create real divergence:
- Inherited capital that provides a starting balance others never had
- Earlier start dates, where a decade of extra compounding time drives the majority of the final outcome rather than a minor head start
- Business equity built by households whose ventures succeeded
- Housing timing, where property was purchased at a fraction of current prices
- Income multiples, where some households simply earn several times more, consistently
These are not appearances. A Federal Reserve note on wealth heterogeneity found that rising wealth concentration has reduced the average propensity to consume out of wealth, which shows structural distribution shapes spending patterns well beyond any individual’s budget.
The comparison trap is also harder to escape in an unequal environment. Behavioural research finds that higher economic inequality itself increases materialism and conspicuous consumption, so the surrounding conditions make the behavioural trap more likely, not less.
Where behaviour amplifies what structure creates
Behaviour does not cause structural inequality. It reliably widens the gaps between households that started from similar structural positions.
A multi-country study found that households often use visible goods to differentiate themselves from poorer groups rather than to imitate richer ones, meaning comparison operates downward as well as upward. Borrowing to fund that visible consumption is the amplifier.
Return to the scenario data. Two households, identical $117,000 income, produced a $201,000 ten-year difference. That gap is a behavioural outcome, not a structural one. Your situation reflects both circumstances you did not choose and decisions you can change, and the framework that follows operates squarely in the second category.
The four-number audit: calculating what your driveway actually signals
Here is the framework. It works on any household you can observe, and with full precision on your own.
- Visible asset price: what the car or asset costs
- Implied monthly obligation: the payment required to carry it
- Implied income: the earnings needed to sustain that payment
- Actual surplus: what remains after every commitment is met
Only the fourth number builds wealth, and it is the one almost nobody calculates.
Try it on the neighbour with the $70,000 truck.
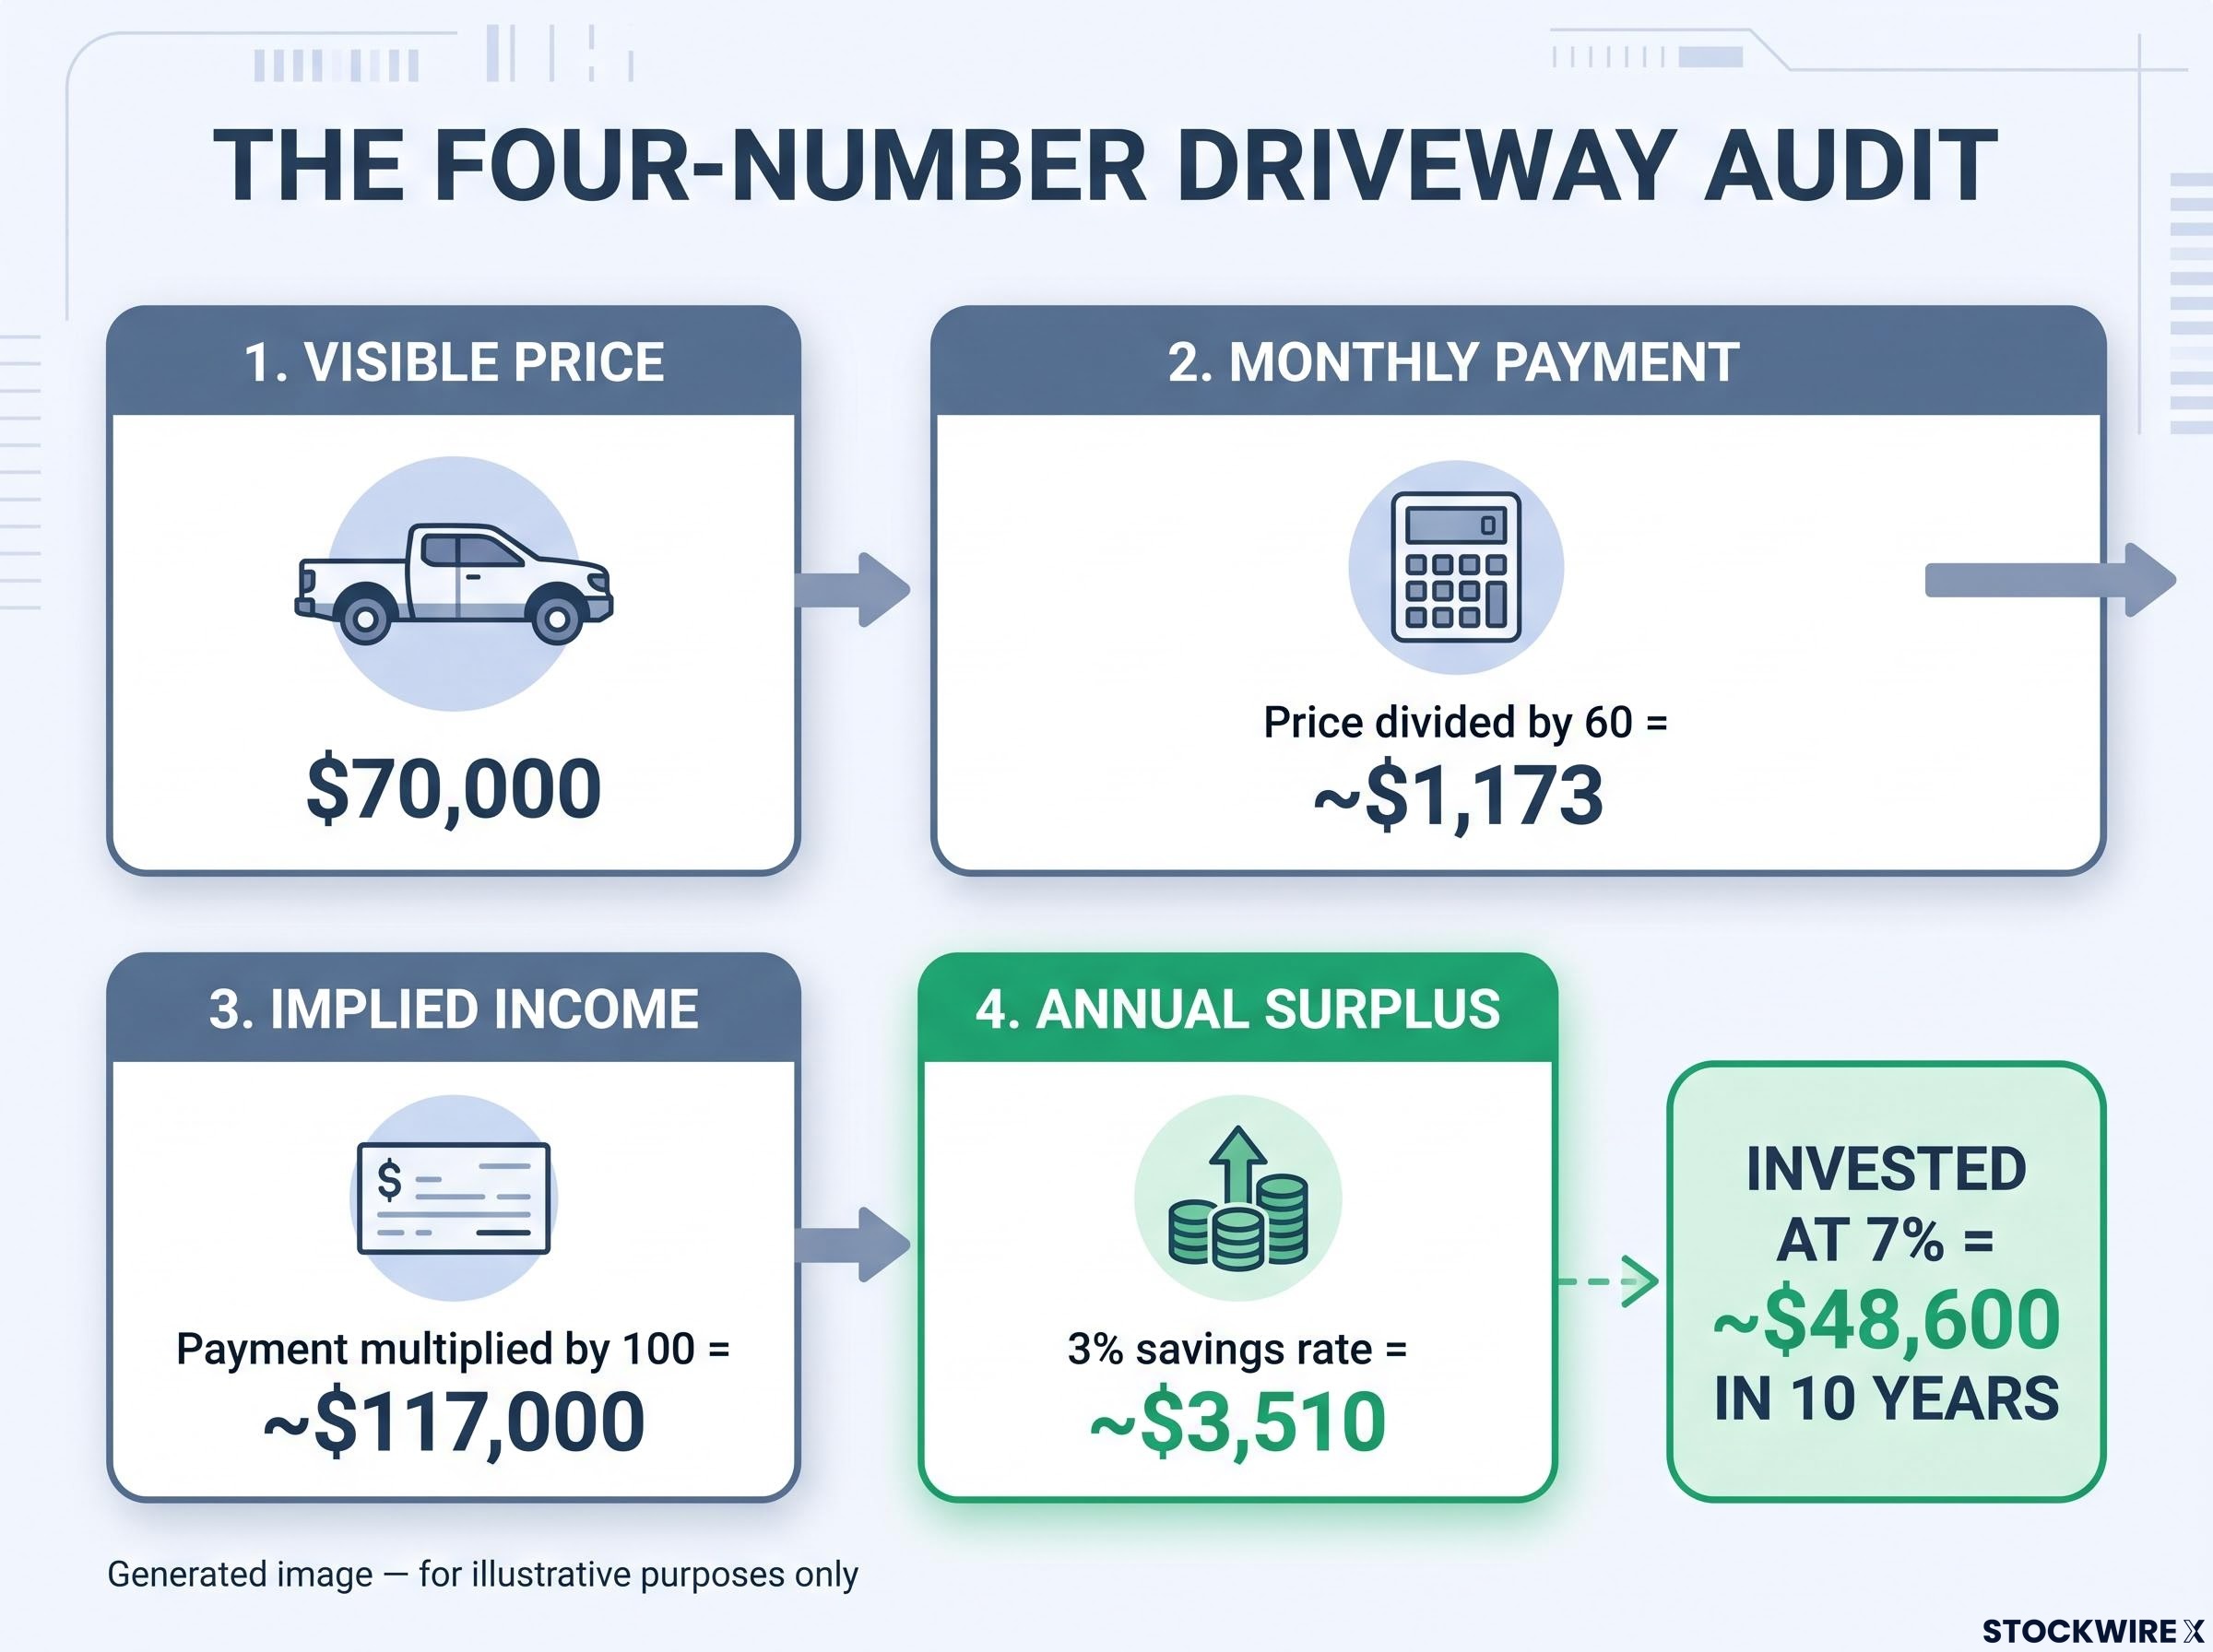
| Input | Calculation method | Result | What it means |
|---|---|---|---|
| Visible price | Observed | $70,000 | Starting point only |
| Monthly payment | Price divided by 60 | ~$1,173 | Ongoing obligation |
| Implied income | Payment multiplied by 100 | ~$117,000 | Income needed to sustain it |
| Annual surplus (3% rate) | Savings rate applied | ~$3,510 | Invested at 7%: ~$48,600 in 10 years |
That surplus, invested at 7% over ten years, grows to roughly $48,600 before the negative-equity adjustment. It is the same Scenario 1 outcome, arrived at from the driveway.
Applying the framework to your own household
Now run the exact same four steps on yourself, and this time every input is known rather than estimated.
Start with your visible asset price and monthly obligations. Subtract every commitment from your income. What remains is your fourth number: your actual surplus.
The 50/30/20 rule, 50% of after-tax income to needs, 30% to wants, 20% to savings, gives you the target. Pay-yourself-first automation is the mechanism: route that 20% to investment before discretionary spending begins.
A concrete starting move: audit your subscriptions. The 2026 Family Budget Audit toolkit finds most households can redirect $500 to $2,000 a year in recurring subscription spending straight into retirement accounts. The 20/4/10 vehicle rule (20% down, four-year maximum term, total car costs under about 10% of gross income) is a useful guardrail, but the four-number framework reveals more because it connects the vehicle decision to your entire surplus position.
Calculate your surplus, compare it to the 20% target, identify the gap, and automate the difference. When you do this, you are not budgeting. You are discovering whether your current setup is building wealth or quietly preventing it.
What the driveway calculus looks like in ten years
The gap between how wealth looks and how it accumulates is widest in your 30s and 40s, exactly when comparison pressure peaks and, not coincidentally, when the compounding window matters most.
Structural advantages are real. Inheritance, early start dates, and housing timing cannot be fully offset by behaviour. But within the set of decisions you actually control, calculating your surplus and investing it systematically is the single highest-leverage action available.
The cost of delaying investment compounds silently: a single year’s pause at the beginning of a 30-year horizon removes roughly $28,000 from the terminal balance, close to eight times the contribution avoided, which means the comparison-driven spending described above carries a future price tag well beyond its sticker value.
The cost of one decade of comparison A single household with a single income produced a $201,000 gap between the vehicle-financing path and the investing path over ten years.
The 3.0% national savings rate is the baseline to beat. The 15% rate of Scenario 3 is what produced the $243,000 outcome. The SCF benchmarks now give you the context to read your own trajectory against real peers.
This was never a story about sacrifice. It is a story about which number a household decided to grow, and you now know how to calculate yours. So the question is not “start investing today.” It is this: what is your fourth number, and where is it going?
This article is for informational purposes only and should not be considered financial advice. Investors should conduct their own research and consult with financial professionals before making investment decisions. Past performance does not guarantee future results. Financial projections are subject to market conditions and various risk factors, and the ten-year scenarios above use assumed inputs and are illustrative rather than guaranteed.