
How Dual-Class Shares Put $24 Billion in Gulf Capital at Arm’s Length
Apr 28, 2026

The S&P 500’s average dividend yield sat at just 1.1% in late April 2026. For income-focused investors, that number presents a concrete problem: a $100,000 allocation to a broad index fund generates roughly $1,100 in annual dividend income before tax. Three instruments covered in this analysis, Realty Income, ExxonMobil, and the JPMorgan Nasdaq Equity Premium Income ETF (JEPQ), are yielding between 2.77% and approximately 11%. Each gets there through an entirely different mechanism, and each carries a distinct set of trade-offs that income investors need to evaluate before allocating capital.
With the Federal Reserve holding rates steady at 3.5%-3.75% following the March 2026 FOMC meeting and equity volatility elevated across 2025-2026, the allocation question is not simply “where is the highest yield?” It is: how does each yield get generated, how durable is it, and what risk does an investor accept to collect it? What follows is a structured comparison of the yield mechanics, dividend sustainability, and suitability profile for each instrument, giving income investors a framework for deciding where these three options fit in a US portfolio.
S&P 500 average dividend yield: 1.1% (late April 2026)
That figure is not just low in historical terms. It represents a real purchasing power gap for investors who depend on portfolio income. At current levels, the broad market’s dividend stream barely keeps pace with inflation, let alone funds a retirement withdrawal schedule.
The Federal Reserve’s decision to hold the federal funds rate at 3.5%-3.75% at its March 2026 meeting creates an environment where income investors face a specific tension. Cash and short-duration Treasuries still offer competitive yields, which means equity income needs to justify the additional risk it carries. The three instruments in this analysis each clear that bar, but through different mechanisms:
The Federal Reserve’s March 2026 FOMC decision to hold rates at 3.5%-3.75% confirmed a neutral monetary policy posture that leaves income investors without the tailwind of declining borrowing costs, making the yield differential between equities and short-duration Treasuries a live consideration for portfolio positioning.
Higher yield almost always comes with a trade-off. JEPQ sacrifices upside participation. Realty Income carries interest rate sensitivity. ExxonMobil depends on commodity prices. The rest of this analysis unpacks those trade-offs so income investors can size and position each instrument appropriately.
JEPQ’s yield starts with a specific trade. The fund, managed by JPMorgan Asset Management with $45.17 billion in assets under management, holds a portfolio of Nasdaq 100 equities including Nvidia, Apple, Alphabet, Microsoft, Amazon, and Meta. Against those holdings, it sells out-of-the-money call options, collecting the premiums buyers pay for the right to purchase shares at a higher price.
Those premiums become distributable income. The most recent monthly distribution was $0.4205 per share (ex-date 1 April 2026), and the fund’s 30-day SEC yield stood at 8.45% with a 12-month rolling yield of 8.43% as of late April 2026. The implied yield from current distribution levels reaches approximately 11%.
The elevated volatility environment of 2025-2026 has been a specific tailwind. Higher implied volatility means option buyers pay larger premiums, which flows directly into JEPQ’s distribution capacity. Over the trailing twelve months, the fund delivered a total return (inclusive of dividends) of 32%.
ETF volatility metrics like beta and maximum drawdown become especially relevant when evaluating an options-overlay fund like JEPQ, because the premium income that cushions drawdowns in moderate selloffs does not fully protect against a sharp, sustained equity decline in the underlying Nasdaq 100 holdings.
The premium income is not free. When JEPQ sells a call option, it caps the fund’s participation in any rally above the strike price. If the Nasdaq 100 surges, those options get exercised, and the fund forfeits the gains above that threshold. In a strong sustained bull market, an uncapped Nasdaq 100 ETF will outperform JEPQ on total return.
The strategy performs well under three specific conditions:
It underperforms in one: a strong, sustained bull market, where the upside cap becomes a persistent drag on total return.
Investors considering JEPQ need to understand they are monetising volatility, not accessing a traditional dividend stream. The distribution level is variable, not contractually growing, and it will fluctuate with market conditions.
43 consecutive years of dividend increases
That streak places ExxonMobil firmly in Dividend Aristocrat territory, a designation reserved for S&P 500 companies that have raised their dividends annually for at least 25 years. The most recent increase came in November 2025, lifting the quarterly payment from $0.95 to $0.99 per share (annualised approximately $3.96). At a share price of roughly $148.91, the forward yield stands at 2.77%, more than double the S&P 500’s 1.1%.
The streak is backed by operational fundamentals. Full-year 2025 delivered $52 billion in operating cash flow and $28.8 billion in net earnings, with Q4 2025 earnings beating Wall Street targets, according to Reuters. Three factors underpin the dividend’s sustainability:
The variable that income investors need to monitor is crude oil. West Texas Intermediate (WTI) averaged approximately $90.84 per barrel in March 2026, a level that comfortably supports the current dividend and capital expenditure programme. A sustained decline in oil prices would pressure free cash flow and, eventually, the ability to extend the streak.
ExxonMobil’s 2.77% yield is lower than Realty Income’s or JEPQ’s, but it comes with a multi-decade track record of growth. For income investors willing to accept commodity price exposure, it offers a combination of yield and dividend reliability that few equities can match.
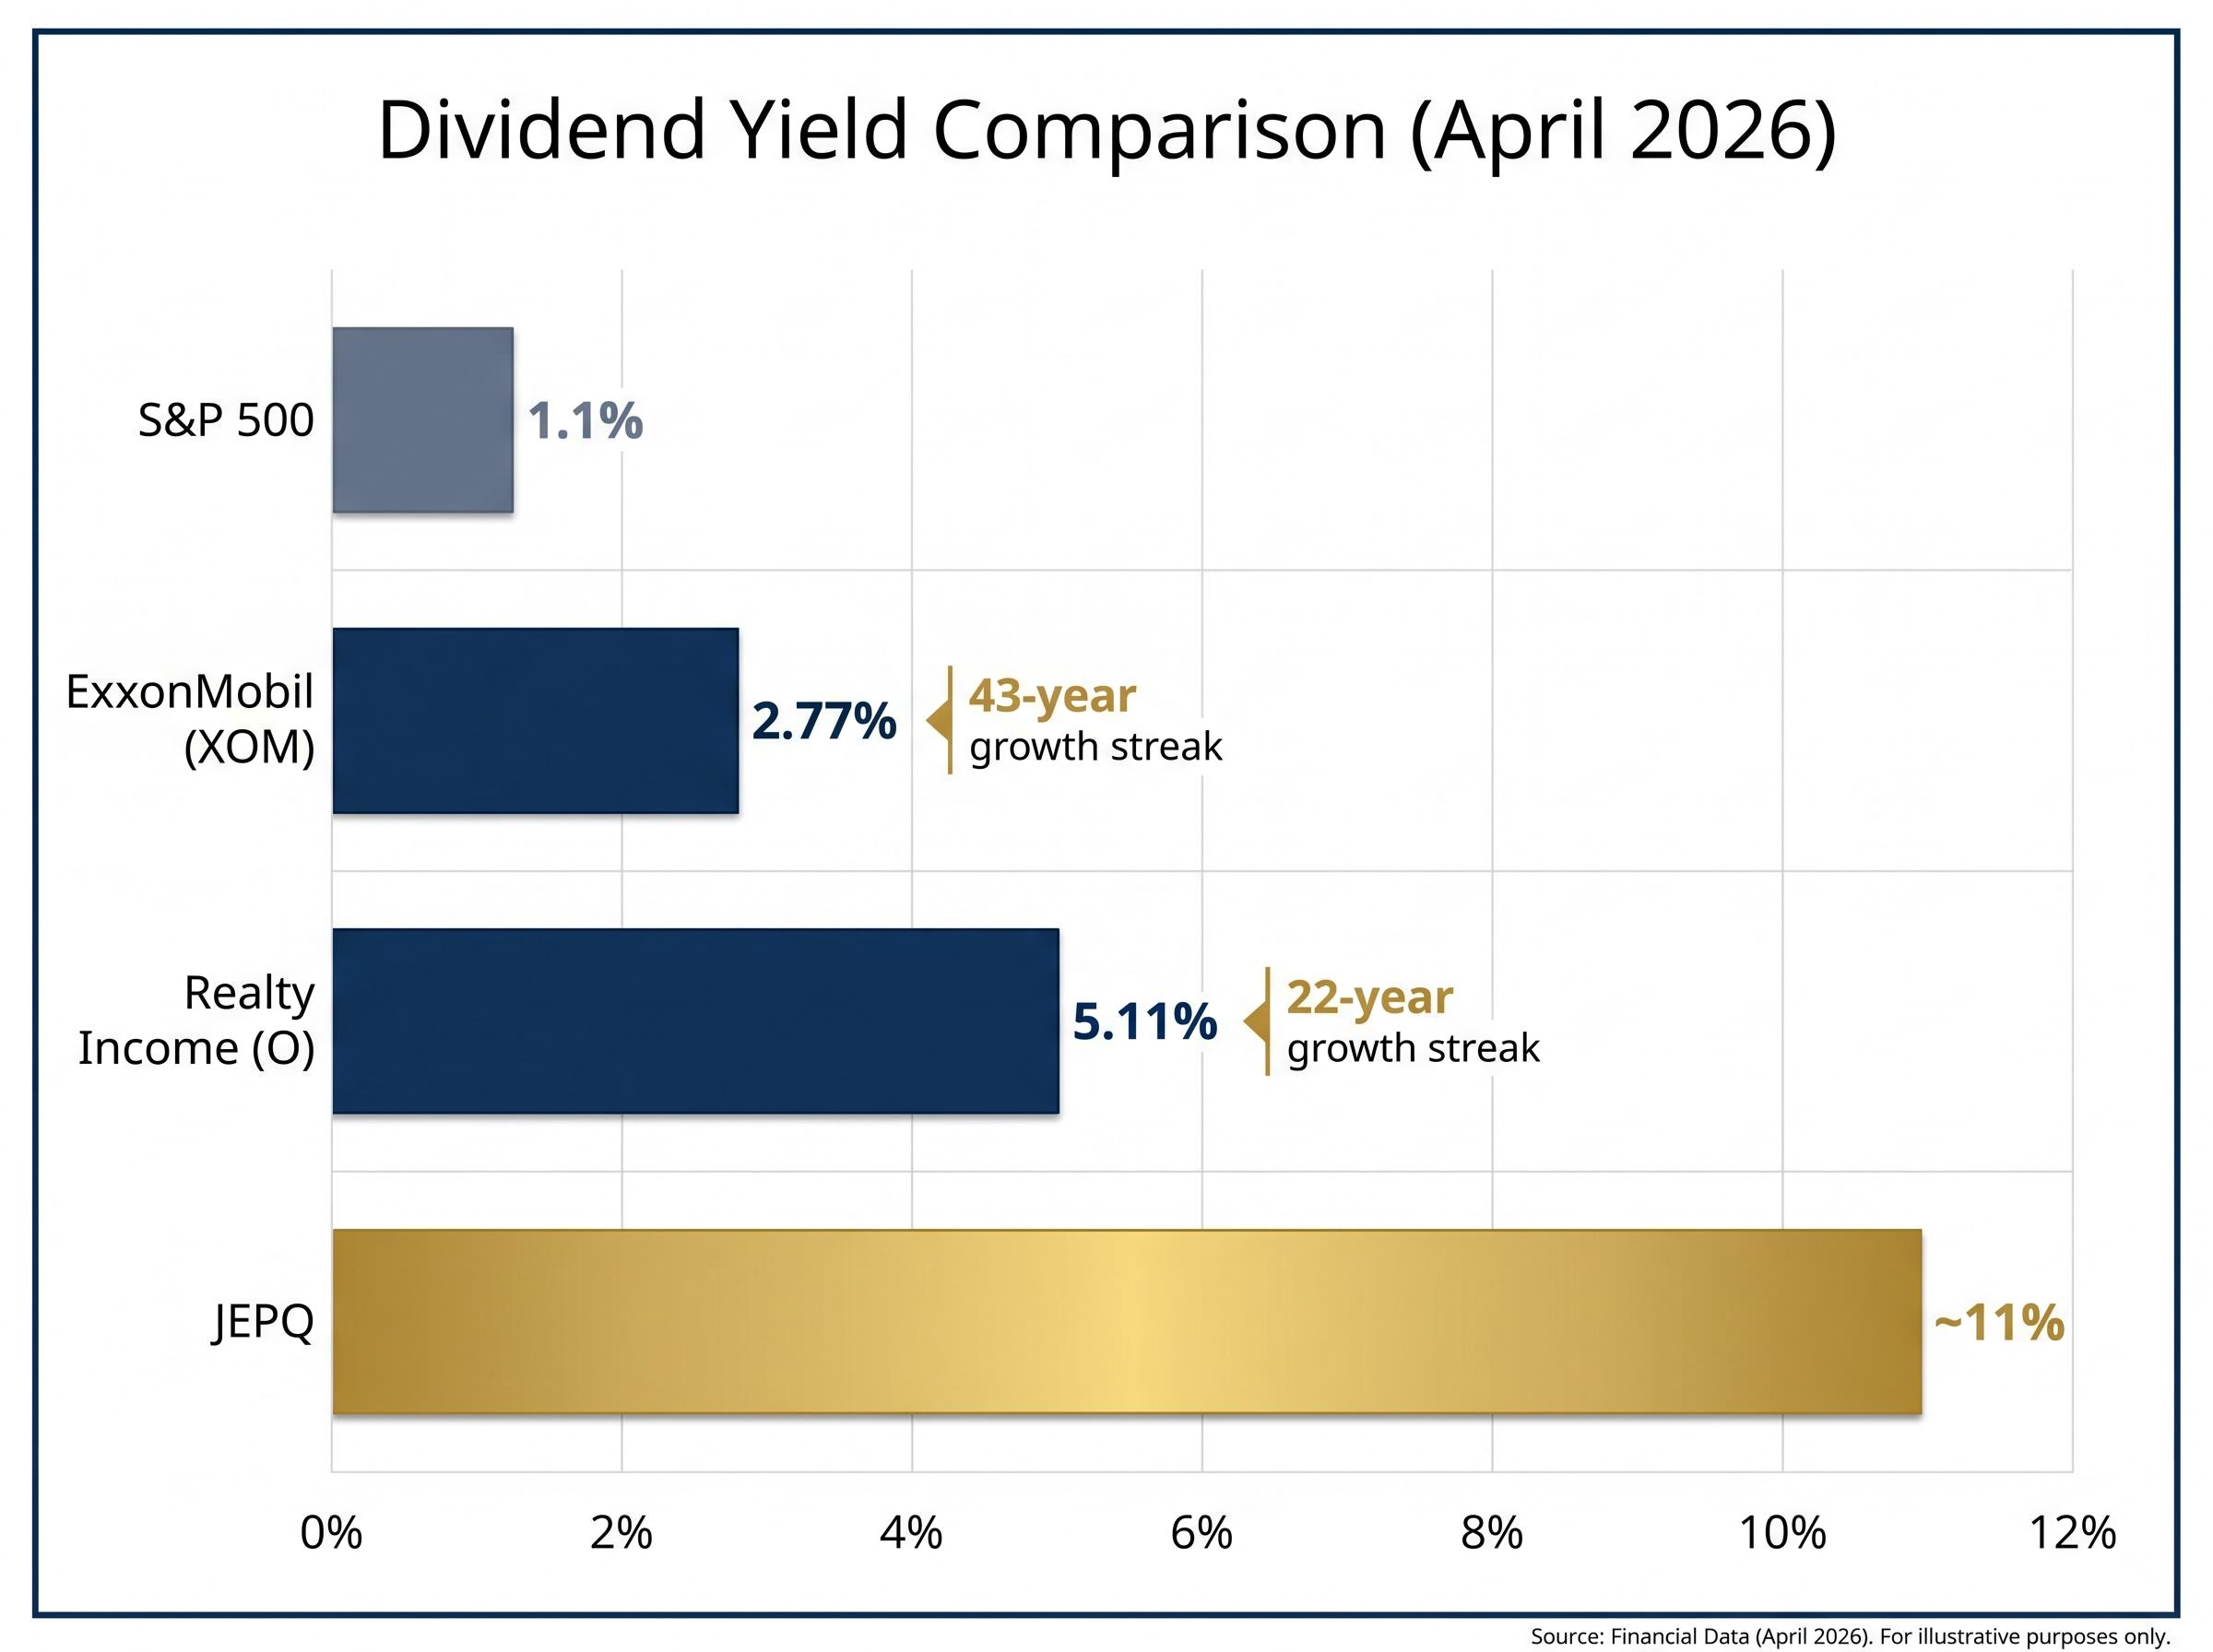
Realty Income pays dividends monthly, not quarterly, and has done so without interruption for 670 consecutive months since its NYSE listing in 1994. The company markets itself as “The Monthly Dividend Company” and has declared 134 common stock dividend increases over that period, with 22 consecutive years of annual increases.
The current forward annual dividend is $3.24 per share. At a share price of approximately $63.33, that delivers a yield of 5.11%. The most recent increase, from $0.2700 to $0.2705 per share, was declared on 11 March 2026 and paid on 15 April 2026. The next ex-dividend date is 30 April 2026 for a $0.2705 per share payment on 15 May 2026.
The 1-year dividend growth rate of 1.89% is modest, but the consistency is structurally enforced rather than voluntary. As a Real Estate Investment Trust (REIT), Realty Income is legally required to distribute at least 90% of its taxable income to shareholders. That mandate is the mechanism behind the income consistency.
The SEC investor guidance on REIT distribution requirements establishes that qualifying trusts must distribute at least 90% of taxable income to shareholders annually, the statutory foundation that makes Realty Income’s monthly payment schedule a structural commitment rather than a discretionary policy.
Realty Income’s EPS-based payout ratio stands at 277%, a figure that would signal distress for a conventional company. For a REIT, it is standard accounting.
The distortion comes from real estate depreciation. Accounting rules require REITs to deduct depreciation on their property portfolios, which reduces reported earnings per share. But depreciation is a non-cash charge; it does not reduce the actual cash flowing into the business from rent payments. The result is an artificially low EPS that makes the payout ratio appear unsustainably high.
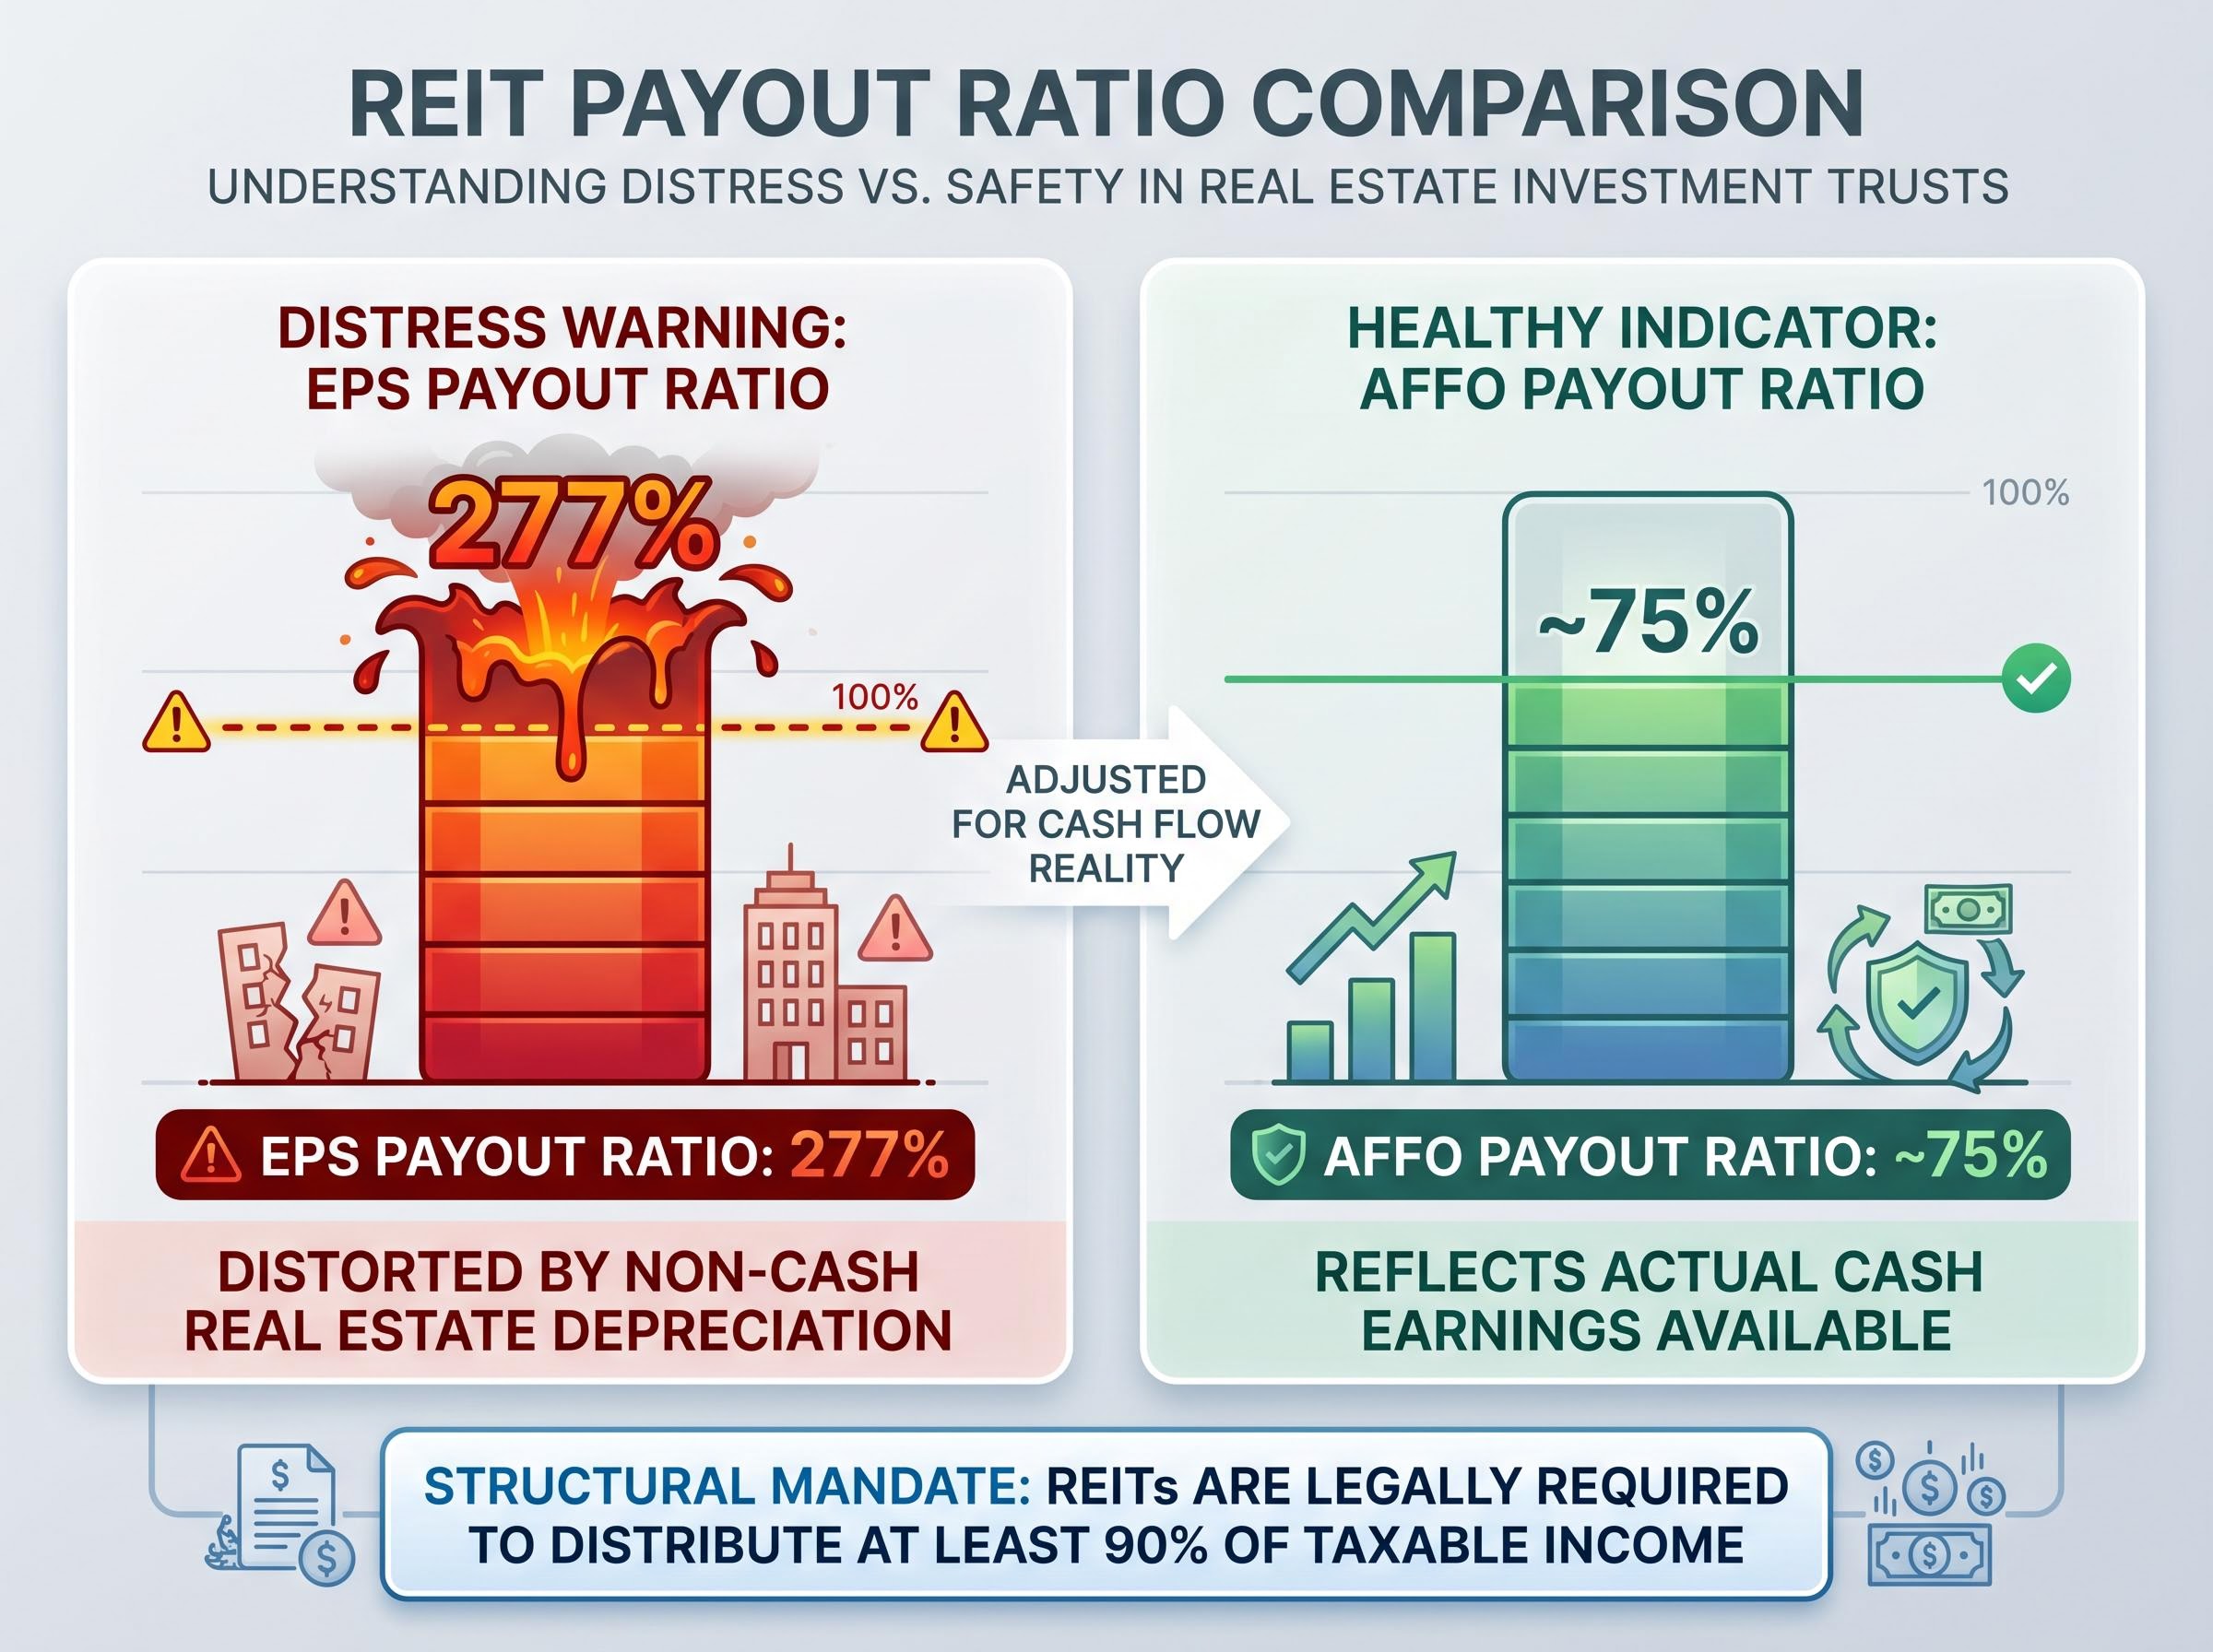
AFFO-based payout ratio: approximately 75%, indicating a well-covered dividend
Adjusted Funds From Operations, or AFFO, strips out depreciation and other non-cash items to reflect the actual cash earnings available for distribution. At roughly 75%, Realty Income’s AFFO-based payout ratio indicates the dividend consumes three-quarters of true cash earnings, leaving a meaningful buffer. AFFO is the analyst-standard metric for evaluating REIT dividend safety, and any investor assessing a REIT’s income sustainability should use it rather than EPS.
| Instrument | Yield (April 2026) | Payment Frequency | Dividend Growth Streak | Primary Risk Factor |
|---|---|---|---|---|
| Realty Income (O) | 5.11% | Monthly | 22 years | Interest rate sensitivity |
| ExxonMobil (XOM) | 2.77% | Quarterly | 43 years | Commodity price exposure |
| JEPQ | ~11% | Monthly | N/A (ETF) | Upside cap / options mechanics |
| S&P 500 | 1.1% | Quarterly | N/A | Broad market risk |
For context within the covered-call ETF category, JEPQ’s closest peers include JEPI (approximately 8.57% yield, S&P 500 focus) and QYLD (approximately 11.86% yield, a more aggressive Nasdaq 100 overlay that sacrifices greater upside).
The three instruments serve different investor profiles:
These three are not mutually exclusive. They serve different functions within an income-focused portfolio and can be combined to diversify income sources across mechanisms.
High-yield dividend stocks with sustainable payout ratios occupy a distinct space in the income investing landscape, sitting between Realty Income’s structurally mandated distributions and pure options-income vehicles like JEPQ, and the differentiating factor is almost always whether cash earnings, not accounting earnings, cover the declared payment.
The Federal Reserve’s neutral posture at 3.5%-3.75% does not affect these three instruments equally. Each responds to a different macro variable, and understanding those sensitivities helps investors anticipate distribution changes and time entries.
If the Fed moves to cut rates in the second half of 2026, REITs like Realty Income could see the most direct benefit as their yield spread versus Treasuries widens, while JEPQ’s income may moderate if volatility declines in a sustained risk-on environment.
The practical implication is that income investors monitoring these three positions need to track three independent variables: the rate path for Realty Income, crude oil prices for ExxonMobil, and market volatility for JEPQ. A shift in any one of those variables changes the relative attractiveness of its corresponding instrument without necessarily affecting the other two.
All three instruments offer yields that materially exceed the S&P 500’s 1.1%, but each operates through a different mechanism with distinct risk and growth characteristics. Realty Income delivers structurally predictable monthly income with modest growth, backed by the REIT distribution mandate. ExxonMobil offers 43 years of consecutive dividend increases with commodity exposure as the primary variable. JEPQ provides the highest current yield of the three, funded by options premiums in a volatile market environment, with no growth streak and a variable distribution.
The rate path, oil prices, and market volatility are the three independent variables income investors should track to monitor these positions going forward. Past performance does not guarantee future results, and financial projections remain subject to market conditions and various risk factors.
This article is for informational purposes only and should not be considered financial advice. Investors should conduct their own research and consult with financial professionals before making investment decisions.
Dividend income investing focuses on generating regular cash distributions from holdings such as REITs, dividend growth stocks, and income ETFs, rather than relying solely on capital appreciation. The goal is to build a portfolio that produces a reliable income stream, with instruments like Realty Income, ExxonMobil, and JEPQ each using different mechanisms to distribute cash to investors.
JEPQ generates its yield by holding a portfolio of Nasdaq 100 stocks and selling out-of-the-money covered-call options against those holdings, collecting the premiums as distributable income. The elevated volatility environment of 2025-2026 has increased option premiums, boosting the fund's distribution capacity, though the strategy caps upside participation in strong bull markets.
Realty Income's EPS-based payout ratio of 277% appears alarming but is misleading because accounting rules require REITs to deduct non-cash depreciation charges that reduce reported earnings without affecting actual cash flow. The more relevant metric is the AFFO-based payout ratio, which sits at approximately 75%, confirming the dividend is well-covered by true cash earnings.
ExxonMobil holds 43 consecutive years of dividend increases, placing it firmly in Dividend Aristocrat territory and making it the strongest candidate for investors prioritising a long, unbroken growth streak. Realty Income offers an alternative reliability case with 670 consecutive monthly dividend payments and 22 years of annual increases, though its primary risk is interest rate sensitivity rather than commodity exposure.
The Fed's neutral rate posture means income investors cannot rely on falling borrowing costs to lift REIT valuations or reduce their financing expenses, keeping Realty Income under moderate pressure relative to short-duration Treasuries. If the Fed pivots to cuts later in 2026, REITs like Realty Income stand to benefit most directly as their yield spread versus Treasuries widens, while JEPQ's distributions could moderate if falling volatility reduces options premiums.


