
Professional analysts spend over 100 hours on qualitative research before they build a single financial model for a bank stock. Most retail investors reach for a price-to-earnings ratio and call it done.
Australian bank stocks represent roughly one-third of the ASX by market capitalisation. The RBA held the cash rate at 4.35% at its 7 May 2026 meeting, describing policy as “restrictive” with no pre-committed path forward. In that environment, the stakes of getting a bank stock valuation wrong carry portfolio-level consequences. Valuation models like PE ratios and dividend discount models (DDMs) produce numbers quickly, but those numbers rest entirely on assumptions about growth, risk, and earnings quality that the models themselves cannot validate.
This guide provides the qualitative due diligence checklist that sits between running a valuation model and making an investment decision, covering macro conditions, bank-specific operational signals, and the institutional red flags that determine whether a model’s output is reliable or dangerously optimistic.
When the numbers look cheap, the real work begins
A PE ratio is an entry-level filter. A dividend discount model is a more sophisticated entry-level filter. Neither is an investment verdict.
The reason is mechanical. A DDM requires three inputs: a base dividend, a long-term growth rate, and a discount rate (the required return). Each of those inputs is a qualitative judgement dressed as a number.
- Base dividend: Assumes current payout is sustainable, which requires a view on earnings quality
- Growth rate: Assumes a trajectory for future earnings, which requires a view on competitive positioning and macro conditions
- Discount rate: Assumes a risk level, which requires a view on regulatory standing, asset quality, and management credibility
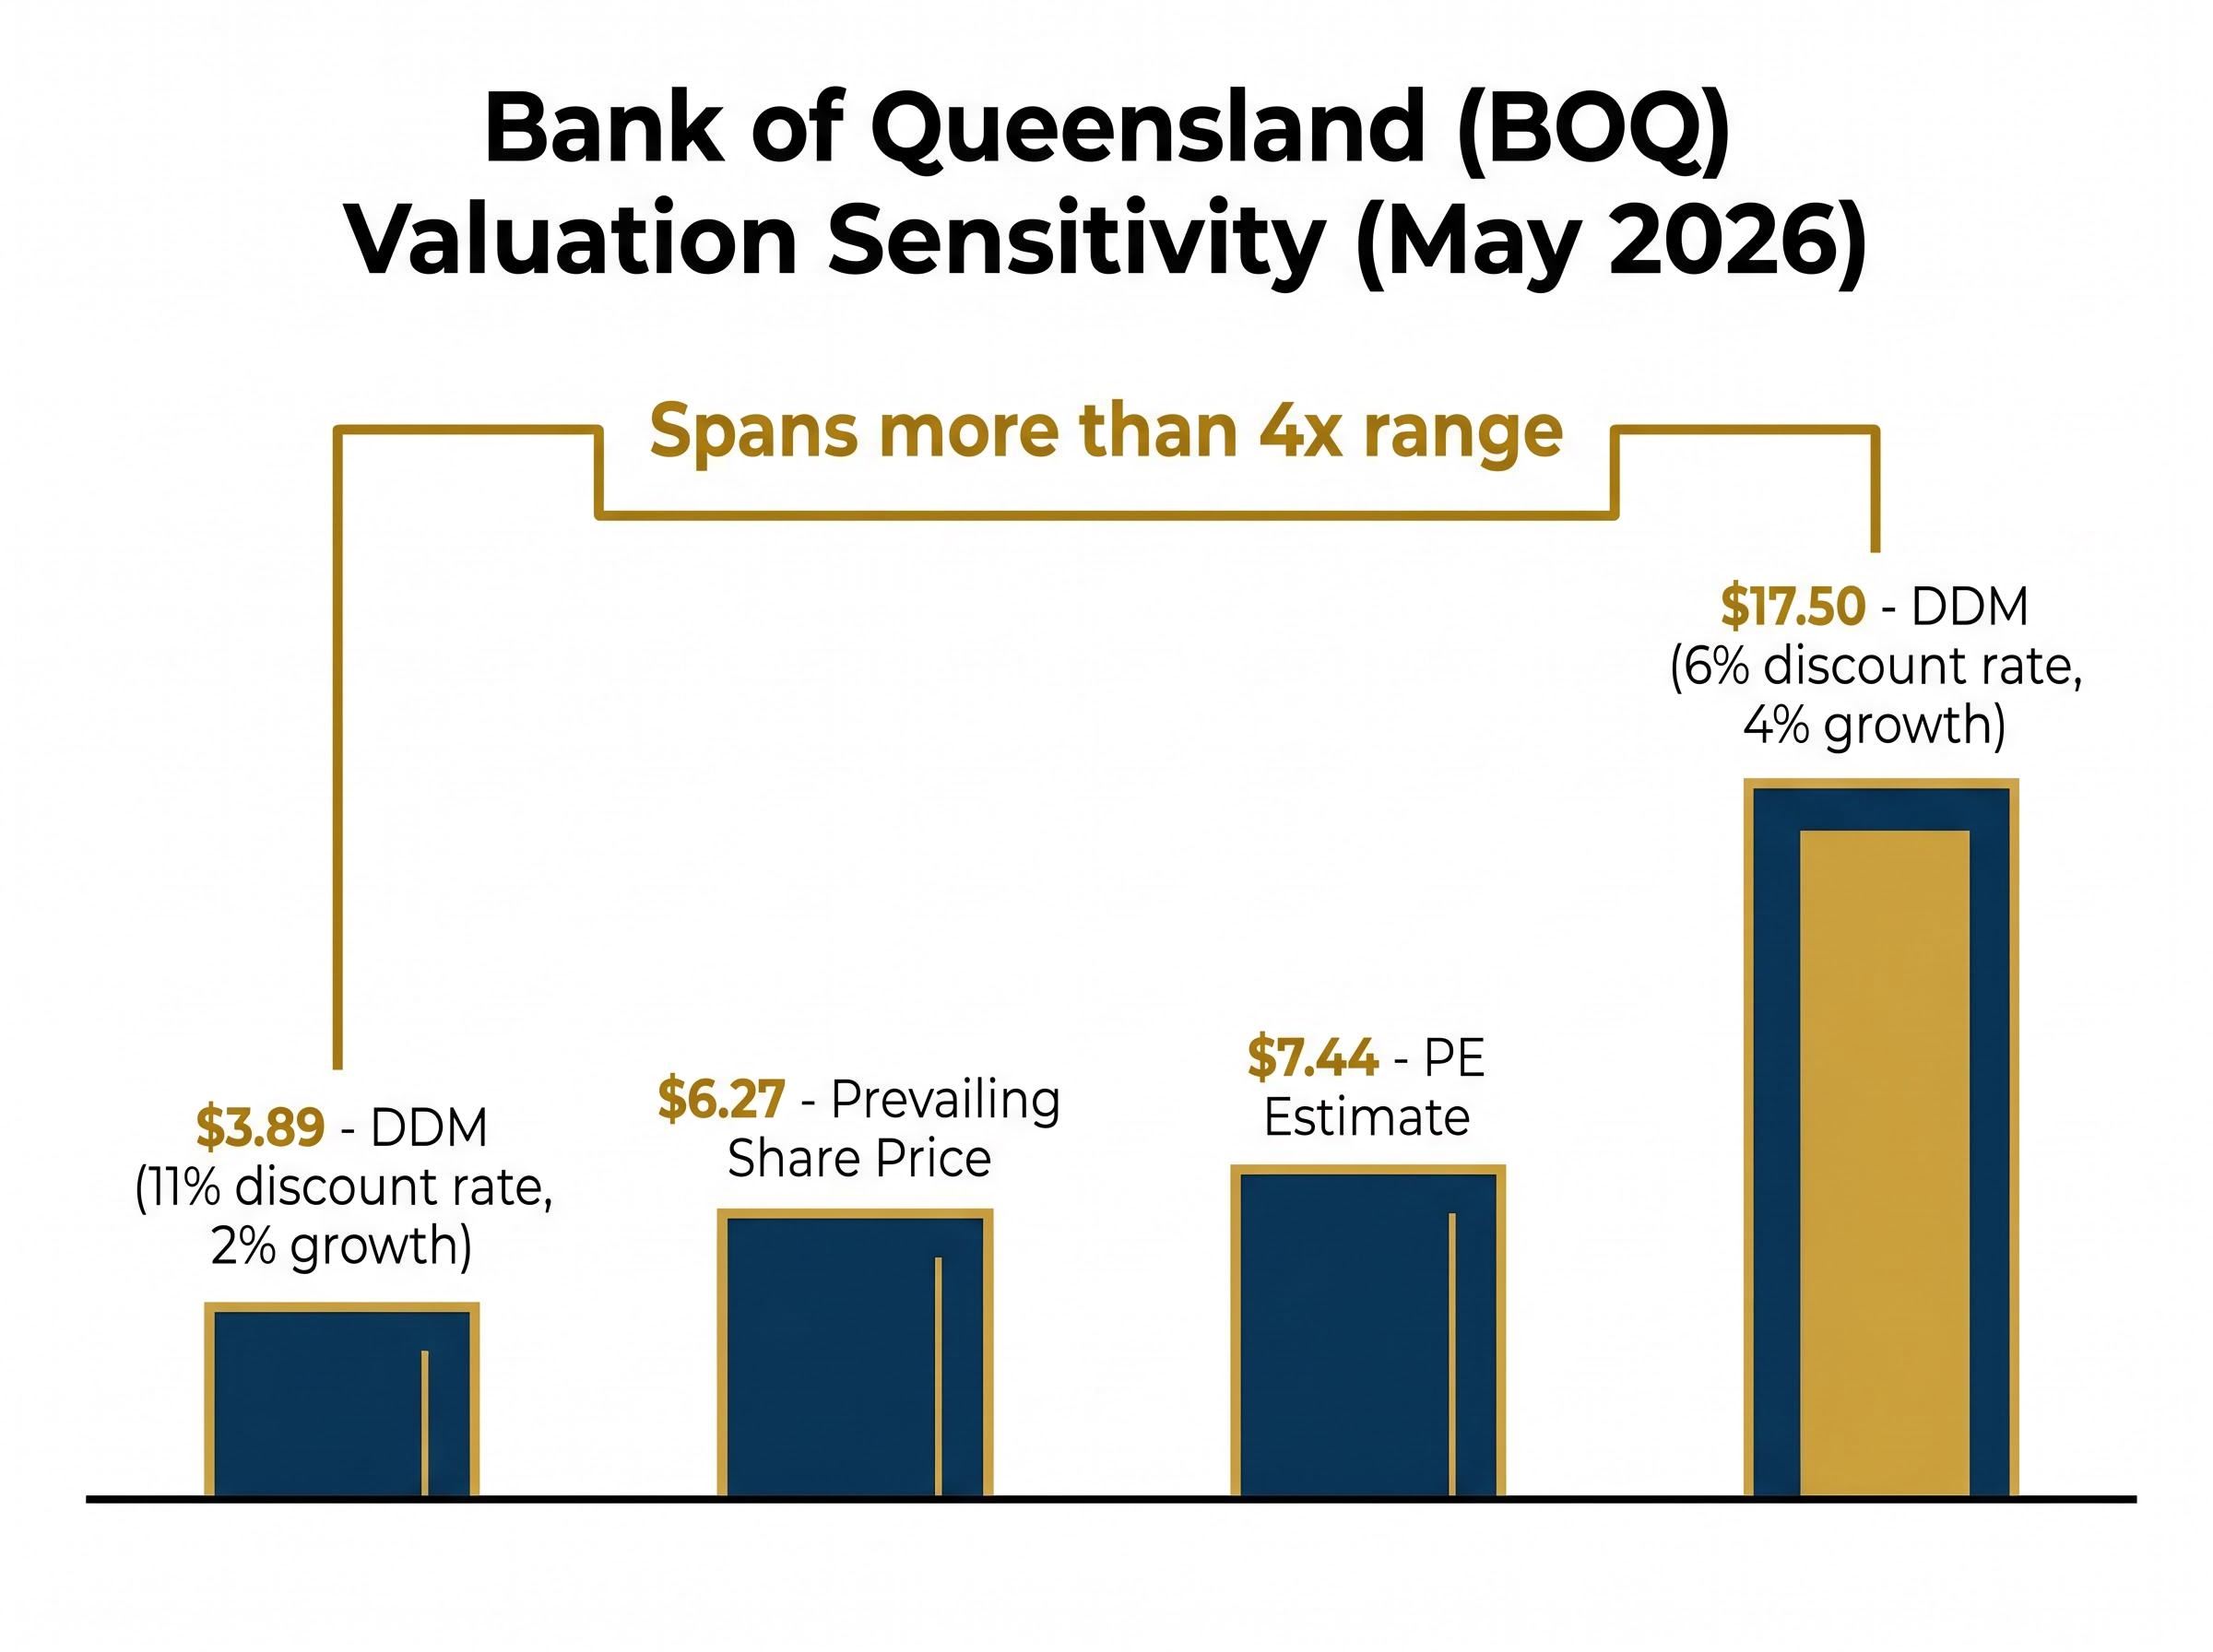
Rask Media analysis published in May 2026 demonstrated this sensitivity using Bank of Queensland (BOQ). The same DDM framework produced a valuation of $3.89 when fed an 11% discount rate and 2% growth assumption, and $17.50 when the inputs shifted to a 6% discount rate and 4% growth. A PE-based estimate of $7.44 sat between those extremes, against a prevailing share price of $6.27. The model did not produce an answer. It produced a range that spanned more than four times the lowest estimate.
The dividend discount model mechanics that underpin this sensitivity go back to John Burr Williams’ 1938 framework: the formula P = D1 / (r – g) treats a stock’s value as entirely dependent on three inputs, and small shifts in g or r produce valuation swings that can dwarf the margin of safety an investor believes they hold.
Professional analysts typically invest over 100 hours in qualitative due diligence before constructing financial models. This is not a counsel of perfection. It reflects the professional recognition that quantitative outputs are the beginning of analysis, not the conclusion.
The sections that follow provide the qualitative checklist that informs those assumptions.
When big ASX news breaks, our subscribers know first
What bank stocks are actually sensitive to: the mechanics behind the model inputs
Before applying any checklist, it helps to understand how Australian bank earnings actually work at a mechanical level. The terms that appear in analyst reports, such as net interest margin, credit quality, and earnings mix, are not abstract descriptors. They are the direct drivers of the growth and risk assumptions that valuation models require.
How the RBA rate cycle feeds through to bank earnings
The net interest margin (NIM), which is the difference between what a bank earns on its loans and what it pays on its deposits and funding, is the primary earnings driver for Australian banks. The RBA cash rate influences NIM, but the relationship is neither automatic nor linear.
At the 7 May 2026 meeting, the RBA described its 4.35% cash rate setting as “restrictive.” Prior rate cycle analysis suggests that each 100 basis points of restrictive policy typically adds approximately 8-12 basis points to major bank NIMs in the following 12-18 months, as funding costs tend to lag rate increases. The direction of rates matters as much as the level: higher-for-longer creates a dual effect, positive for spreads but negative for credit volumes and arrears risk.
Why earnings mix determines earnings quality
Major ASX banks earn revenue across three layers: net interest income (the core lending spread), non-interest income (fees, wealth management, institutional services), and provisioning costs (the deductions for expected loan losses).
- Net interest income dominates, but its sensitivity to the rate cycle means it can compress or expand materially between reporting periods
- Non-interest income above approximately 25% of total revenue is considered indicative of a diversified earnings base, one less exposed to a single rate cycle swing
- Provisioning costs are driven by asset quality, which in turn reflects the macro conditions covered in the next section
Banks with high mortgage concentration carry more exposure to rate cycle swings than those with meaningful business banking and institutional lending contributions. That distinction feeds directly into the growth rate and risk assumptions a valuation model needs.
The three macro conditions that must be assessed before any bank stock decision
Three Australian macro indicators form an interconnected system that determines whether a bank’s reported earnings are sustainable or masking deterioration: residential property prices, household credit growth, and mortgage arrears. They do not operate independently. Stable house prices support collateral quality, which limits loss-given-default in stress scenarios and keeps provisioning costs contained. Credit growth signals new lending revenue. Arrears reveal whether existing borrowers are absorbing the pressure of restrictive monetary policy.
The current readings, based on data from early 2026, present a manageable but watchful picture.
| Indicator | Current Reading | Bank Earnings Implication |
|---|---|---|
| House price growth | Low-to-mid single digit (rolling 12-month, CoreLogic) | Supports collateral quality; limits loss-given-default risk |
| Housing credit growth | ~4-5% annualised (RBA Financial Aggregates, March 2026) | Moderate new lending revenue; not a volume tailwind |
| 90-day housing arrears | 0.8-0.9% for major banks (APRA Q1 2026) | Manageable provisioning; watch trend direction closely |
The combination of subdued credit growth and still-low but drifting arrears reflects a macro environment where bank earnings are not under acute stress, but where the margin for error has narrowed. What would change the assessment? An acceleration in arrears above 1%, a material decline in dwelling values concentrated in regions of high loan exposure, or a sharp contraction in credit growth would each individually warrant a reassessment of the assumptions underpinning any bank stock valuation model.
Per capita recession conditions, where aggregate GDP growth masks declining output per individual and rising corporate insolvencies, create a specific threat to bank asset quality that headline credit growth figures do not reveal: solvent borrowers can become impaired borrowers quickly when real wages fall and small business failures accelerate.
These three indicators are the macro pre-conditions. They determine whether a bank’s valuation looks reasonable or whether it rests on earnings assumptions the macro environment may not support.
The bank-specific operational checklist professionals apply
Macro conditions set the environment. The operational checklist determines whether a specific bank is positioned to navigate that environment well or poorly. APRA’s analytical framework for major banks evaluates four dimensions: capital and regulation, asset quality, business mix, and management strategy. This section applies those dimensions as a sequential investigation.
No single pillar is sufficient on its own. A bank with strong capital but deteriorating asset quality is not a pass. All four must be assessed together, and a weakness in one can override apparent strength in others.
ROE relative to cost of equity is the most direct test of whether a bank is creating or destroying shareholder value: a bank reporting an ROE of 4.7% against an estimated cost of equity of 9-11% is, in analytical terms, destroying value even while paying dividends, making a credible recovery path essential before any investment case holds.
Capital and regulatory standing
- CET1 ratio relative to APRA’s 10.25% “unquestionably strong” benchmark. Major banks currently report ratios in the range of 11.5-12.5%, and the size of the buffer above the floor signals capacity for buybacks or capacity to absorb unexpected shocks
- Active APRA remediation orders or conduct investigations. These represent a binary concern: their presence introduces regulatory capital risk and management distraction that models rarely capture
- Capital ratio trend direction across the last three reporting periods. A rising or stable ratio is constructive; a declining trajectory requires explanation
APRA’s unquestionably strong capital framework established the 10.25% CET1 floor for major banks and anticipated that institutions would need to operate materially above that threshold to absorb unexpected shocks without breaching minimum requirements, which is why current major bank ratios in the 11.5-12.5% range represent compliance with the spirit of the framework rather than excess conservatism.
Asset quality signals
- 90-day past-due housing loan ratio: both the level and the trend direction matter. Below 1% and stable or declining is the pass threshold
- Specific provision coverage ratios relative to historical norms for that institution. A step-up in provisions without a corresponding change in arrears may signal management concern about forward conditions
- Geographic concentration of the mortgage book relative to regional property market conditions. A bank with heavy exposure to a single city or region carries concentration risk that a nationally diversified book does not
Management and strategic execution
- Delivery track record against stated cost-reduction targets across the last two to three reporting seasons. Major banks are targeting cost-to-income ratios toward the low-40% range over the medium term
- Digital transformation programme: credible milestones delivered, or repeated delays and cost overruns. Non-bank mortgage origination is estimated at 15-20% of new lending, making technology modernisation a competitive necessity rather than an optional investment
- CEO and CFO tenure stability. Senior leadership turnover without clear succession introduces execution risk that valuation models cannot quantify
Competitive positioning
- Mortgage market share trend: gaining, stable, or losing relative to system credit growth
- Business banking lending growth relative to system growth, which serves as a proxy for franchise strength beyond retail mortgages
- Deposit base resilience: any evidence of erosion toward higher-yielding alternatives signals funding cost pressure that can compress NIMs from the liability side
Green flags and red flags: what to do with what you find
The checklist produces observations. This section converts those observations into investment signals.
Signals that support the investment case
- Capital: CET1 ratio above 11%, stable or rising, with no active APRA enforcement matters
- Asset quality: 90-day arrears below 1%, stable or declining, with collateral values holding
- Earnings: Non-interest income above approximately 25% of total revenue, indicating a diversified earnings base less dependent on a single rate cycle outcome
- Management: Consistent delivery against cost-reduction and digital transformation milestones across reporting periods
- Competition: Stable or growing mortgage and business banking market share relative to system growth
Signals that warrant caution
- Asset quality: 90-day arrears rising toward or above 1%, particularly if the pace is accelerating
- Regulatory: Active APRA remediation orders, conduct investigations, or class action exposure
- Margins: NIM compression from deposit competition outpacing asset repricing
- Management: Repeated digital programme delays, CEO or CFO instability without clear succession planning
- Competition: Sustained market share losses in both retail mortgages and business banking simultaneously
Red flags are not automatic sell signals. Context matters, and a single red flag in one dimension may be offset by strength across others. However, any flag relating to regulatory enforcement or accelerating arrears warrants treatment as a threshold concern rather than a matter of degree.
A stock that looks cheap on a valuation model but carries multiple qualitative red flags is often cheap for reasons the model cannot capture. Model cheapness frequently reflects risks that sit outside the model’s inputs.
A valuation model plus a qualitative checklist is a research process, not a formula
The relationship between the quantitative and qualitative steps is sequential, not parallel. The process follows a clear order:
- Run the valuation model (PE, DDM, or comparable framework) to establish whether the stock’s price sits in a reasonable range relative to its financial profile
- Identify which assumptions drive the output. In most DDM models, the growth rate and discount rate produce the widest sensitivity range
- Apply the qualitative checklist to stress-test each assumption. Does the macro environment support the growth rate? Does the bank’s operational profile justify the discount rate?
- Form a weighted view across all four operational pillars. A bank that passes on capital and asset quality but flags on management execution and competitive positioning is a different proposition from one that passes on all four
Australian bank stocks’ weight in the ASX means that qualitative misjudgements on a bank position carry portfolio-level consequences larger than equivalent misjudgements in smaller sectors. The RBA’s data-dependent stance means the macro environment for bank earnings can shift materially between reporting seasons.
A six-check bank due diligence framework covering ROE versus cost of equity, price-to-book against forward ROE, NIM sensitivity, arrears trends, CET1 ratios, and deposit share gives investors a materially more complete picture than any single valuation metric, and each of those checks maps directly onto the qualitative pillars this article applies.
Treat this checklist as a living document, updated each reporting season. The signals that matter, arrears trend, NIM direction, regulatory environment, change with the macro cycle. A framework that was accurate six months ago may need recalibration today.
This article is for informational purposes only and should not be considered financial advice. Investors should conduct their own research and consult with financial professionals before making investment decisions. Past performance does not guarantee future results, and financial projections are subject to market conditions and various risk factors.