Why DDM Gives ASX Bank Shares a $7 to $32 Valuation Range
1 hr ago

Global stock markets, gold, and silver have all reached record or near-record levels in May 2026. The S&P 500 closed at 7,444.25. Gold hit $4,705.97 per ounce. Silver reached $84.48 per ounce. At the same time, millions of households across advanced economies face the sharpest cost-of-living pressures in a generation, with housing affordability, real wage growth, and retirement security all under strain. This is not a coincidence, and it is not new. The same pattern of rising asset prices during periods of economic distress has played out across four separate crises since 2008. What follows explains the structural mechanism behind asset price inflation, why the conventional interest-rate explanation no longer holds, and what the pattern means for how ordinary investors should evaluate their own financial position.
Four distinct crises over the past eighteen years have produced the same outcome: sustained asset price appreciation over the medium to longer term, even as broader economic conditions deteriorated for large portions of the population.
Geopolitical risk pricing during the 2026 conflict illustrates the same forward-looking dynamic at work: the S&P 500 set a new all-time high while the Strait of Hormuz remained partially blocked, with Goldman Sachs projecting 11% total equity returns into 2027 on the basis that earnings trajectory, not current headlines, drives institutional allocation decisions.
The breadth of this pattern is what makes it difficult to dismiss. It is not confined to US equities. Over the one-year period to mid-May 2026, the FTSE 100 rose approximately 21%, Spain’s benchmark gained approximately 32%, and the CAC 40 added approximately 11%. Over two years, gold climbed approximately 98.5% and silver approximately 174%. US and Japanese markets hit all-time highs on consecutive days in late April 2026.
The simultaneous rise of equities and precious metals is particularly striking. Conventional market analysis treats equities (risk assets) and gold (a safe-haven asset) as opposing signals. When both appreciate together, something structural is at work.
| Asset | Level / Price (mid-May 2026) | Approx. 1-Year or 2-Year Change |
|---|---|---|
| S&P 500 | 7,444.25 | All-time high |
| Nikkei 225 | 63,218.51 | All-time high |
| FTSE 100 | 10,325.35 | ~21% (1-year) |
| DAX | 24,136.81 | Near record |
| CAC 40 | 8,007.97 | ~11% (1-year) |
| ASX 200 | 8,633.90 | Near record |
| Gold (spot) | $4,705.97/oz | ~98.5% (2-year) |
| Silver (spot) | $84.48/oz | ~174% (2-year) |
Index levels reflect closing values; precious metals reflect spot prices. All figures as of 13-14 May 2026.
For over a decade, the dominant explanation for rising asset prices ran through a single variable: interest rates.
The mechanism was straightforward. When central banks cut rates toward zero after the 2008 crisis, savings instruments such as term deposits and government bonds offered diminishing returns. Investors seeking income moved into equities, property, and corporate credit, bidding up their prices. The lower the rate, the more attractive any asset generating a yield above zero became.
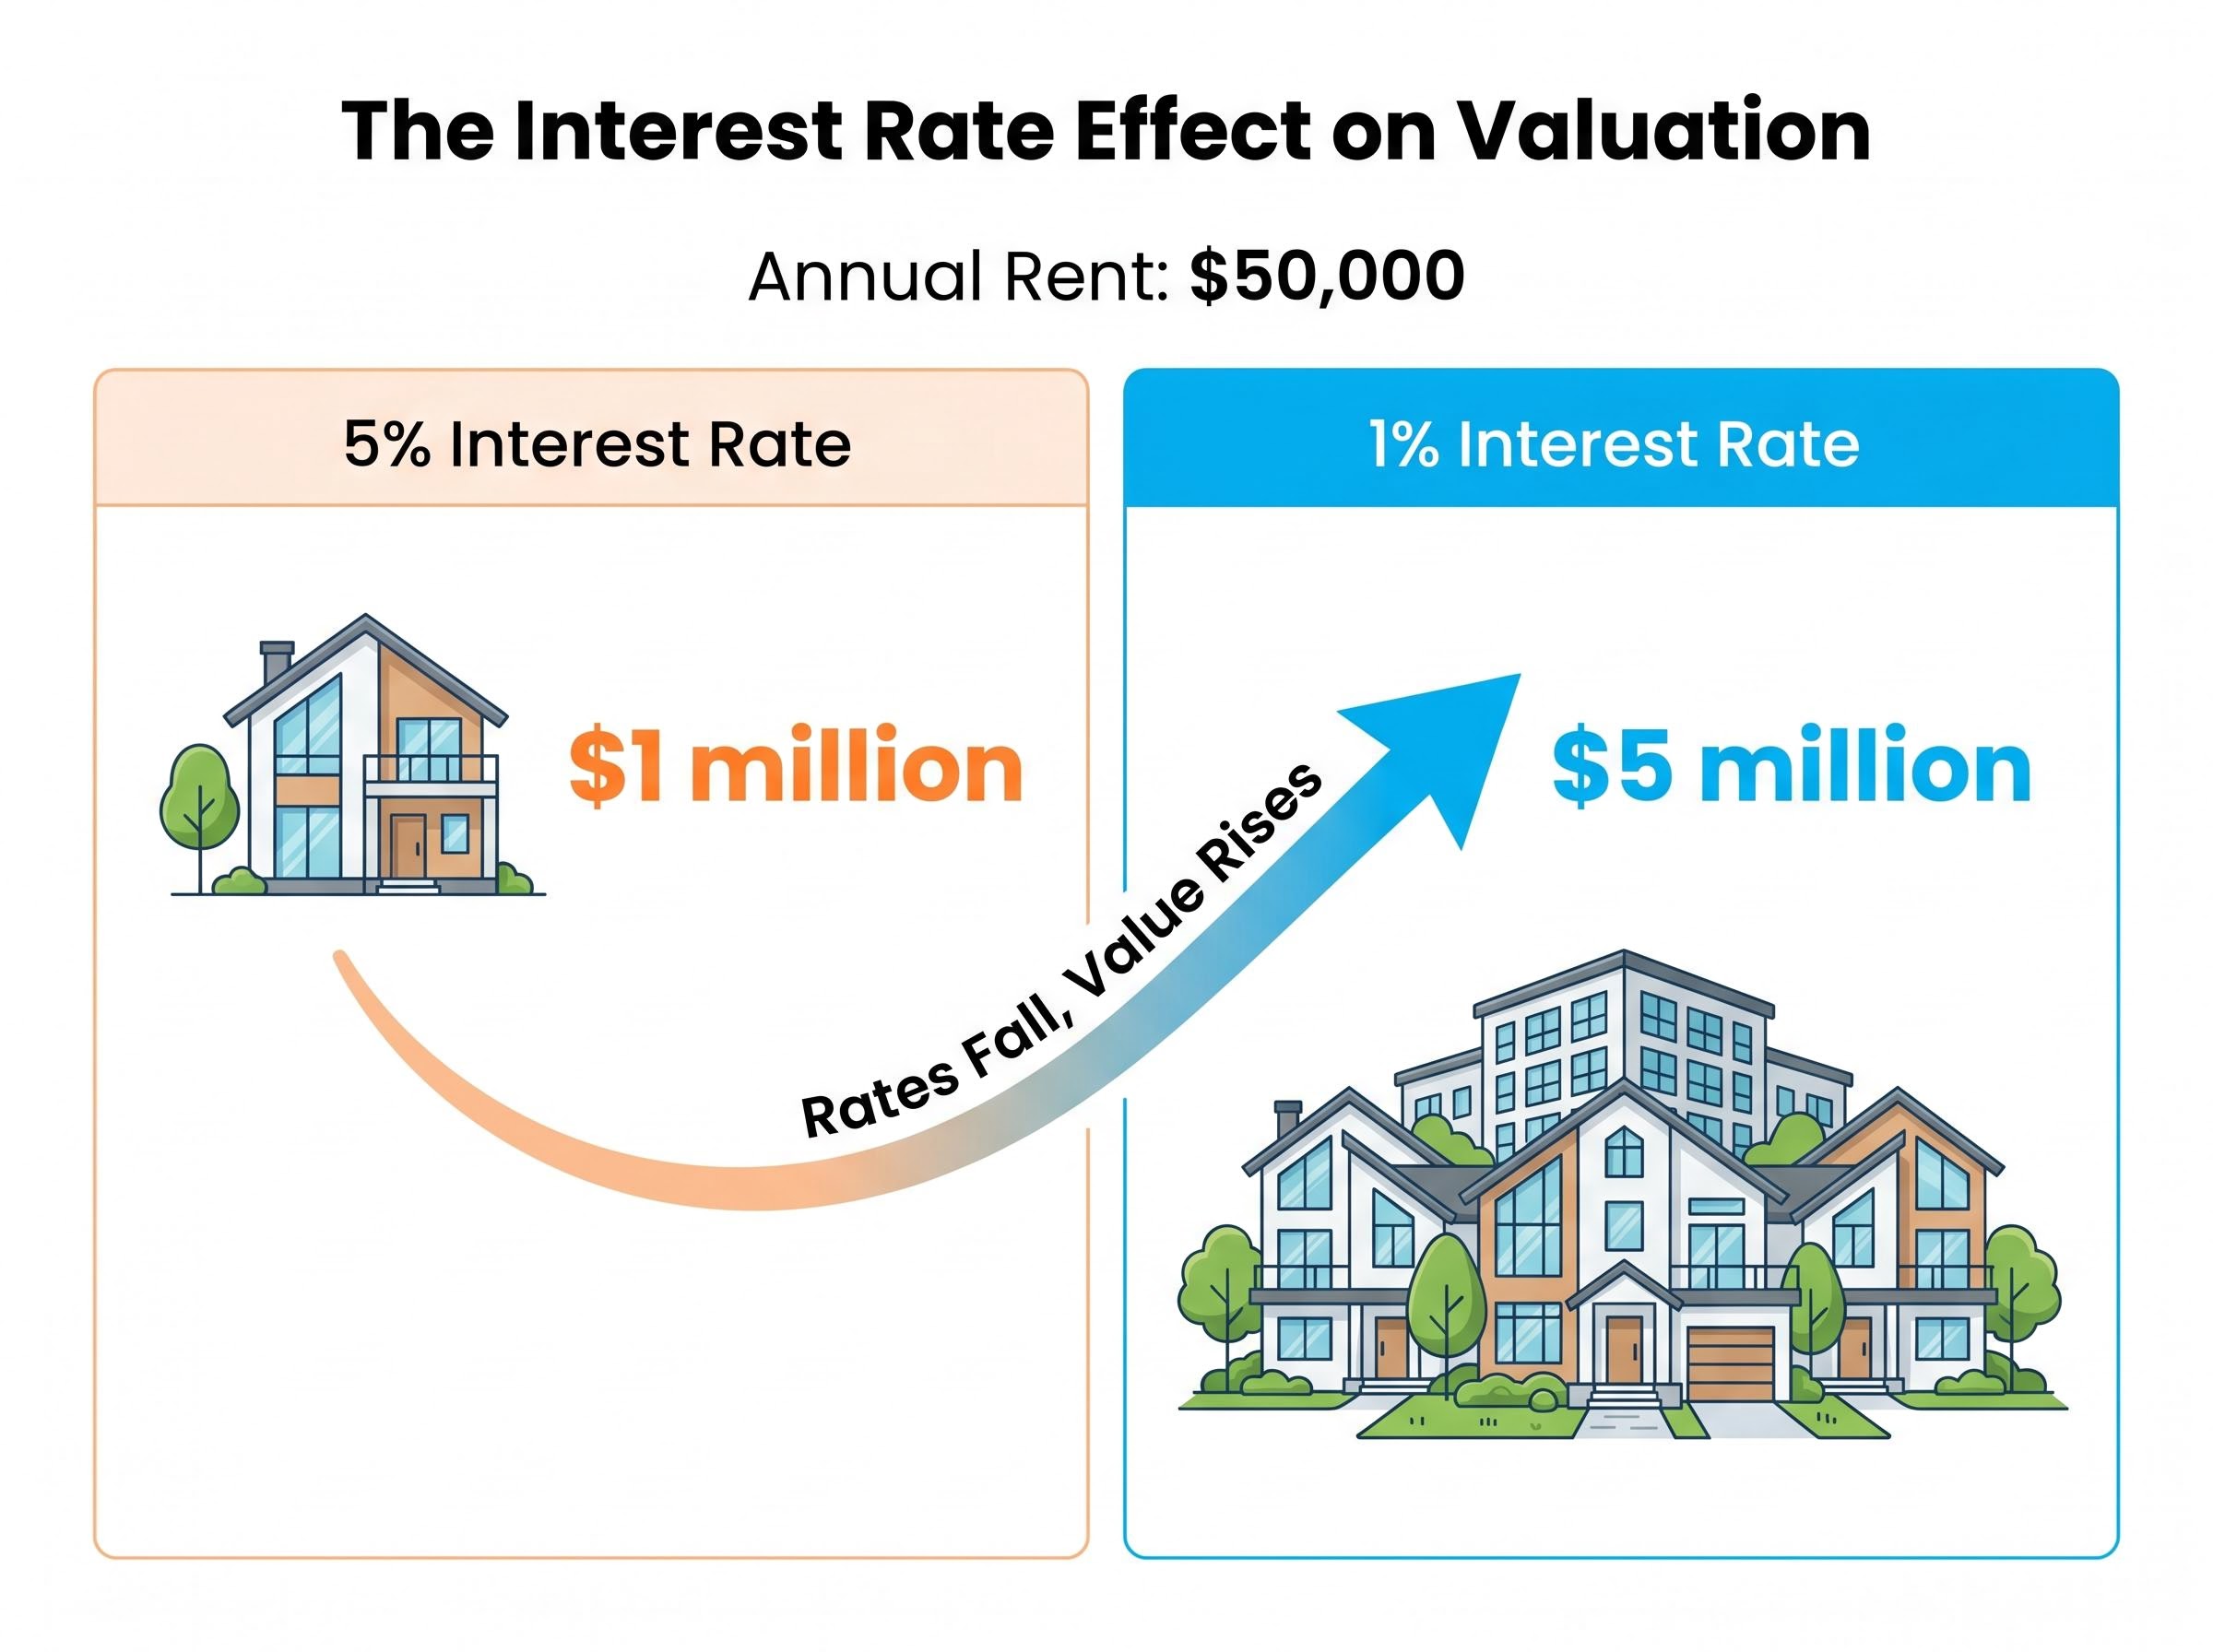
This is easiest to grasp with a property valuation example:
A property generating $50,000 annually in rent is worth roughly $1 million when interest rates sit at 5% (since a buyer could earn the same return from a deposit). At a 1% rate, the same income stream is theoretically worth $5 million, because the alternative, a bank deposit, offers almost nothing. A fivefold difference in valuation, driven entirely by the rate environment.
Before 2008, base rates across most Western economies sat in the 4-5% range. Post-crisis, they fell to near zero and stayed there for most of the following decade. The interest-rate explanation worked well during this period.
After COVID, the explanation broke down.
From 2022 onward, central banks raised rates sharply, returning policy rates to approximately 5% in both the US and UK. Longer-term rates rose to comparable levels. According to the interest-rate theory, asset prices should have fallen significantly and stayed down. They did not.
Some repricing did occur where the theory predicted it would. Long-duration growth stocks, cryptocurrency, and early-stage venture valuations fell sharply through 2021-2022. This selective correction aligned with rate sensitivity models.
Yet broad equity indices recovered and pushed to new highs. Profitable large-cap stocks, energy companies, and AI-linked technology names absorbed the rate shock and drove indices higher. Institutional research from the IMF and BIS flagged that large central bank balance sheets and systemic liquidity continued supporting risk assets even through the tightening cycle. The structural liquidity floor, built up over more than a decade of asset purchases, did not disappear when policy rates rose.
The evidence pointing to fiscal deficits as the structural engine of asset price gains is clearest in the 2022–2025 period, when policy rates returned to approximately 5% across major economies yet gold delivered roughly 95% returns and the S&P 500 continued pushing to successive records, a combination that no interest-rate-only model had predicted.
The interest-rate story explained one chapter. It could not explain the book.
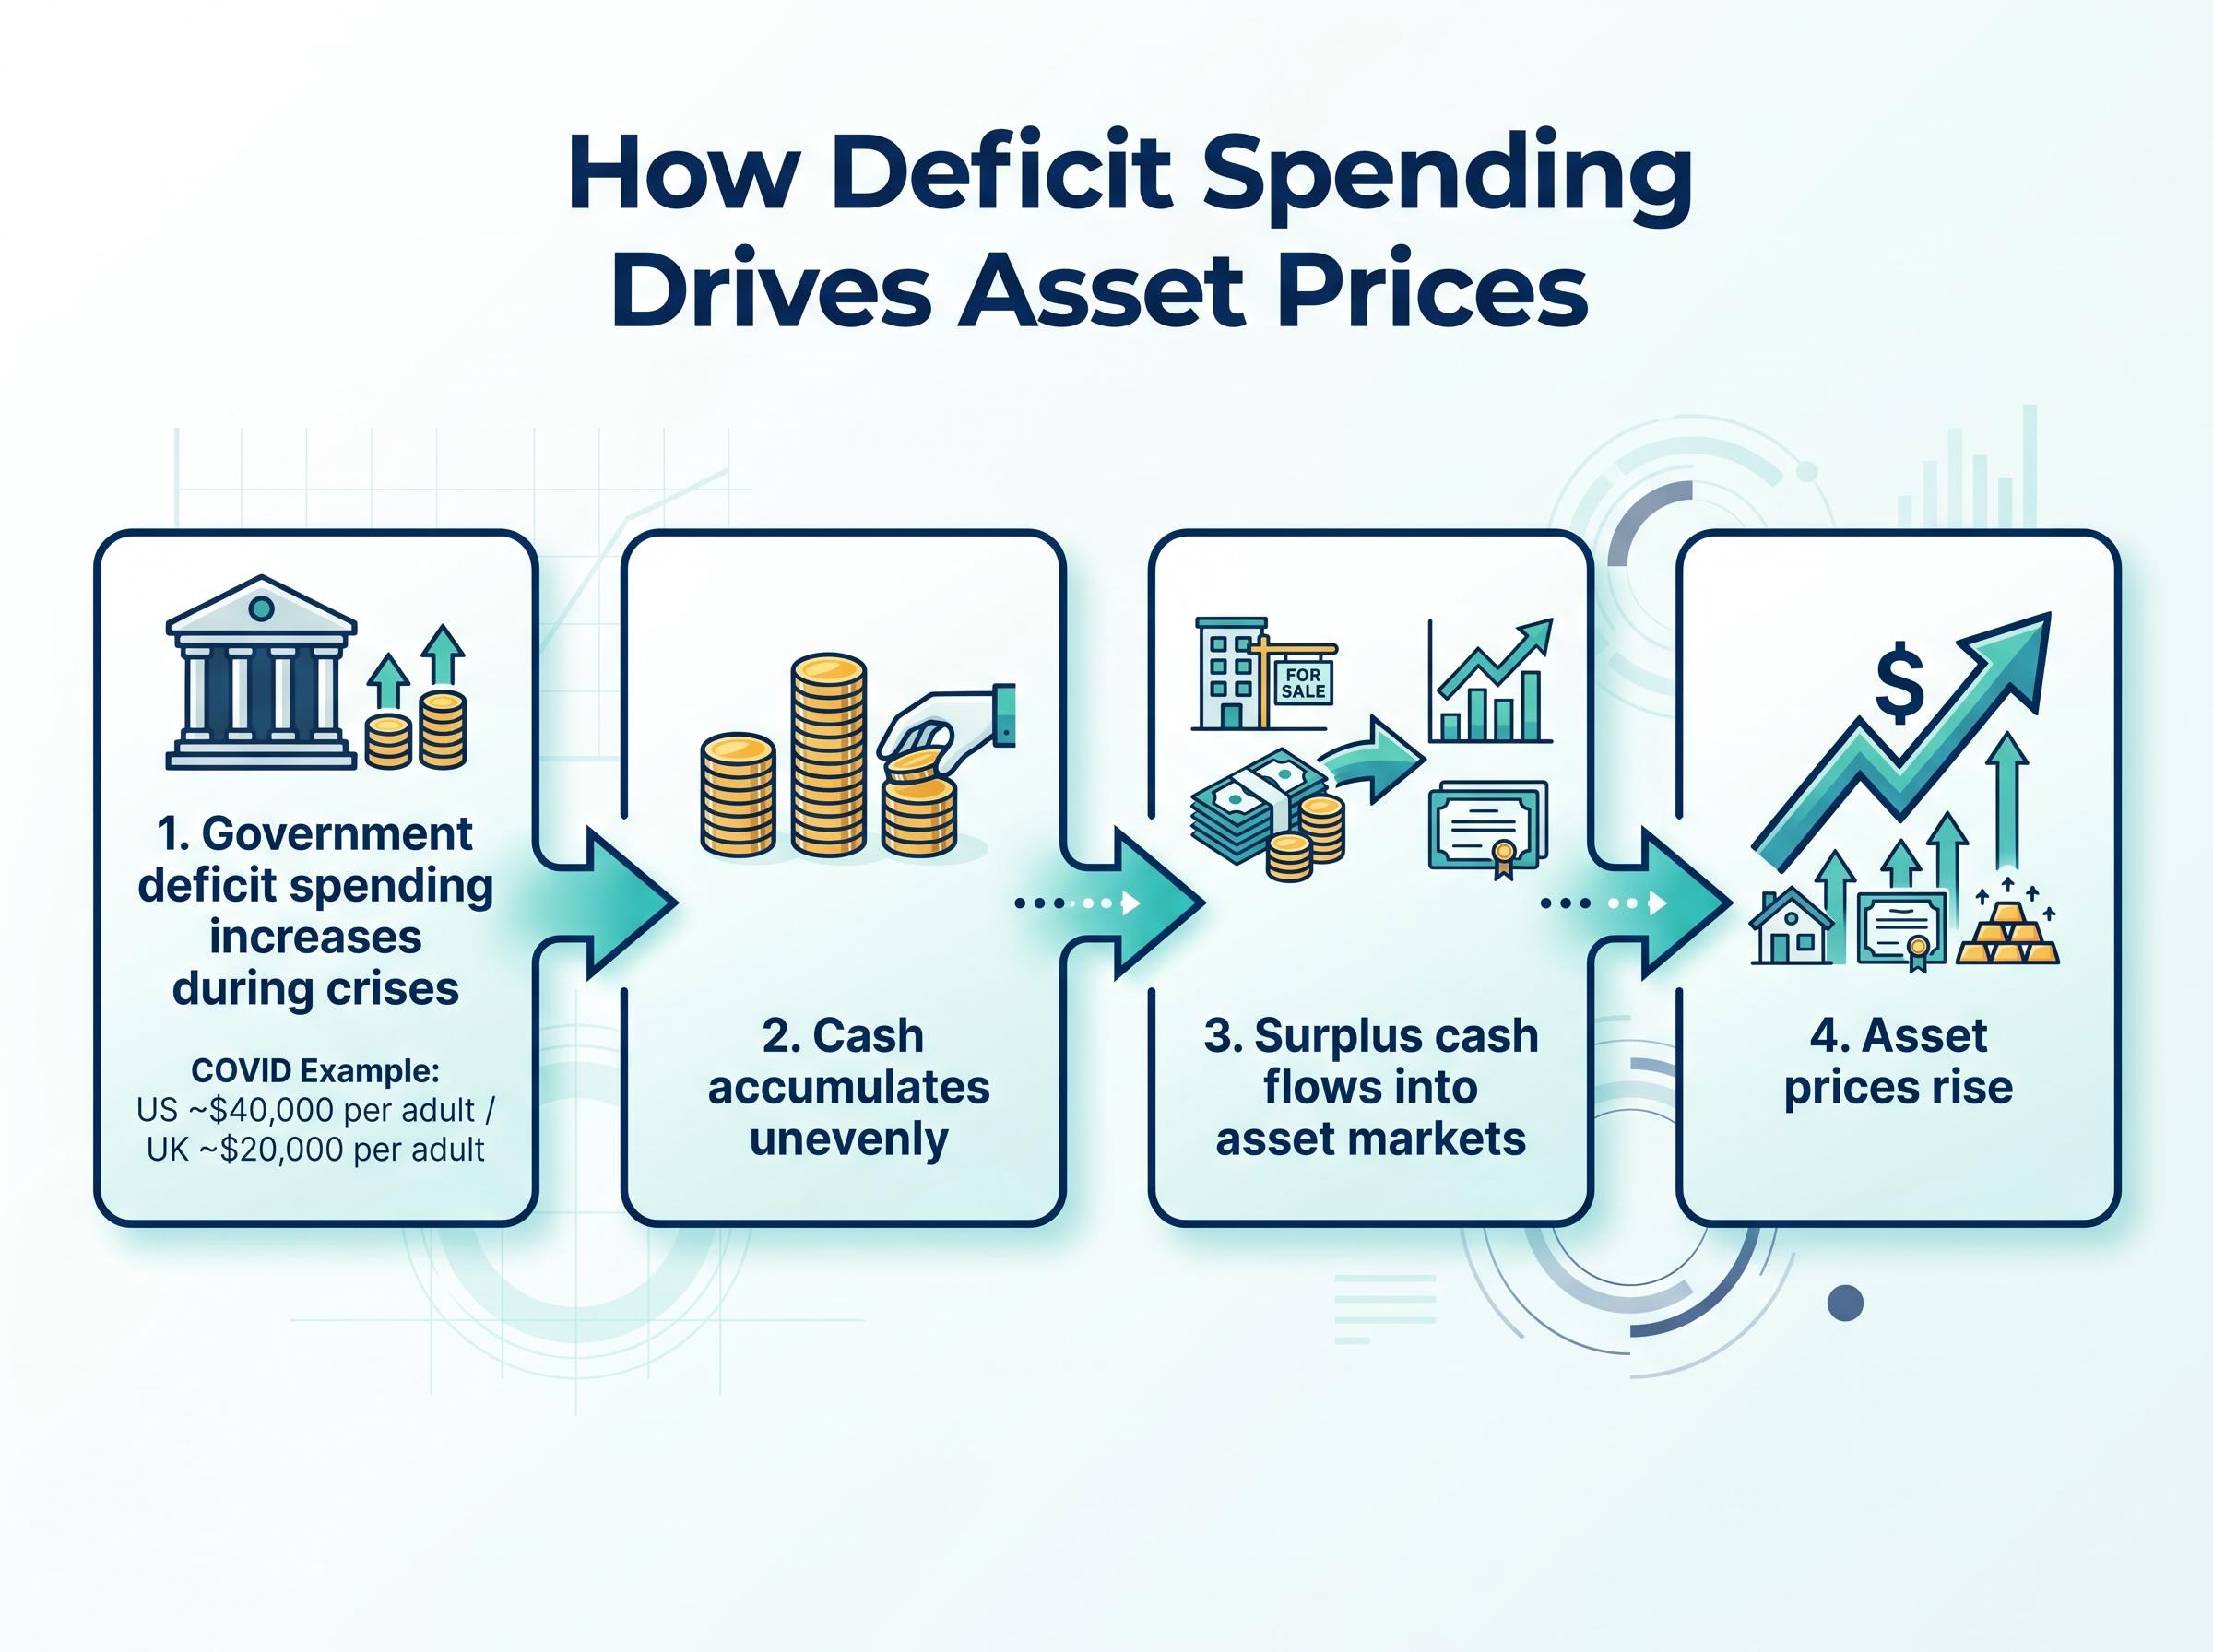
If interest rates alone do not explain why asset prices kept rising, a different mechanism is required. The structural explanation centres on deficit spending and its distributional consequences.
The sequence operates in four steps:
The scale of crisis-era deficit spending makes this mechanism significant rather than marginal. During the COVID pandemic, UK deficit spending amounted to approximately $20,000 per adult and US spending approximately $40,000 per adult. Even partial diversion of these sums into asset markets would produce measurable price effects.
During the COVID crisis alone, per-adult deficit spending reached approximately $20,000 in the UK and approximately $40,000 in the US, volumes large enough that even partial reallocation into asset markets would exert significant upward price pressure.
Data from the Federal Reserve’s Distributional Financial Accounts (DFA) illustrates the resulting concentration. The top 1% of US households hold a disproportionate share of financial assets, including equities, while the bottom 50% hold comparatively little. When asset prices rise, the wealth effect accrues overwhelmingly to those who were already asset-rich.
IMF research quantifying the relationship between deficit spending and asset inflation estimates that each $1 trillion in government borrowing correlates with approximately 8% in asset price gains, with the top 10% of households capturing around 70% of those gains through their portfolio holdings — a ratio that explains why fiscal crisis responses reliably widen the wealth gap even when they stabilise the broader economy.
IMF Global Financial Stability Reports and BIS analysis have repeatedly identified the “policy put” phenomenon, where fiscal backstops and repeated government interventions reinforce market belief that severe downside will be contained. This belief encourages continued risk-taking and supports valuations beyond what earnings or economic fundamentals alone would justify.
The April 2026 IMF Global Financial Stability Report characterises asset valuations as historically elevated and identifies geopolitical risks and market amplification channels as compounding factors in a period of already-stretched prices, lending authoritative weight to the case that structural rather than cyclical forces are at work.
The COVID episode also revealed a secondary consequence. When deficit-funded stimulus was large enough that even wealthier recipients increased their consumption alongside their asset purchases, it contributed to broad consumer price inflation. Central banks responded by raising interest rates. The result was an unusual combination: rising rates and rising asset prices occurring simultaneously, a pattern the interest-rate-only explanation cannot account for but the deficit-distribution mechanism predicts.
Record market levels are frequently presented in financial media as positive economic signals. For households that already hold significant assets, they are. For those that do not, rising asset prices represent something quite different: rising barriers.
The most immediate mechanism is housing. When property prices inflate faster than wages, prospective first-time buyers are progressively priced out. Each crisis episode that channels deficit spending into asset markets pushes homeownership further from reach for younger and lower-wealth households.
The compounding effect operates across generations. First-home buyers in 2026 face price-to-income ratios substantially higher than those faced by buyers at comparable life stages a decade earlier. Early-career savers attempting to build retirement security find that the cost of acquiring a diversified portfolio has risen faster than their ability to save. According to data tracked by the World Inequality Database and annual Oxfam inequality briefs, billionaire wealth has grown substantially faster than median household wealth across each of the crisis episodes since 2008. Federal Reserve DFA data shows the wealth share of the top 1% has expanded while the bottom 50% has remained compressed.
A less visible but equally significant consequence operates at the governmental level.
Governments that repeatedly fund crisis responses through borrowing become progressively more constrained in their capacity to respond to future shocks. The accumulated debt must be serviced, and a meaningful share of that servicing flows to the same wealthy creditors and institutional holders who benefit from asset price inflation. This creates a feedback loop: crisis response inflates assets, which concentrates wealth, which constrains future fiscal capacity, which limits the scope of future crisis responses for the broader population.
IMF and BIS publications have characterised current asset valuations as “stretched” or “elevated.” This mainstream framing, however, typically focuses on the risk of correction rather than the distributional consequences of sustained appreciation. Three groups bear the greatest cost:
If the structural forces described above are likely to persist, and persistent deficits, institutional liquidity floors, and wealth concentration all remain in place, the implication is that non-participation in asset markets carries its own costs. Understanding that the system channels crisis-era spending into asset prices does not change the mechanics; it does change how investors might respond.
Three documented retail strategies have emerged in response to this structural reality:
For investors wanting to translate the structural argument into personal financial decisions, our dedicated guide to spending behaviour and wealth accumulation shows how two people on identical $95,000 salaries can produce a $571,000 net worth gap over ten years purely through differences in how they allocate income, with a worked example showing a redirected vehicle lease payment growing to between $2 million and $3 million over a 40-year career horizon.
“You can hate the game, but you still need exposure to it.” This sentiment, recurring across retail investor forums, captures the pragmatic mood: recognising that the structural dynamics are inequitable while acknowledging that staying entirely outside asset markets compounds the disadvantage.
One caveat deserves emphasis. Structural support for asset prices over the longer term does not eliminate short-term volatility. Current market conditions exhibit elevated volatility, and significant swings in either direction remain possible regardless of longer-term trends. The distinction between structural trajectory and short-term price action is one that every investor benefits from maintaining.
This article is for informational purposes only and should not be considered financial advice. Investors should conduct their own research and consult with financial professionals before making investment decisions. Past performance does not guarantee future results.
Asset price inflation during economic crises is not a paradox. It is a predictable structural outcome of how crisis responses are designed and who holds assets at the outset. Large deficit spending, channelled through an economy where wealth is already concentrated, flows disproportionately into asset markets. The result is rising equity indices, rising property values, and rising precious metals prices alongside rising cost-of-living pressures for those without meaningful asset holdings.
The two threads of this pattern, the mechanism and the consequence, reinforce each other across cycles. Each crisis response inflates the assets that the wealthy hold, widens the distributional gap, and constrains the fiscal capacity available for the next crisis.
The structural conditions that produce this outcome remain in place: persistent government deficits, institutional liquidity floors, and concentrated asset ownership. Unless these underlying dynamics change, the pattern is likely to continue. When the next crisis produces the next market rally, readers now have a framework for understanding what record highs mean, and what they do not mean, about the health of the broader economy.
These statements reflect structural analysis of historical patterns and are subject to change based on market developments and policy shifts.
Asset price inflation refers to the sustained rise in prices of financial assets such as equities, property, and precious metals, often outpacing wage growth and consumer price inflation. For ordinary investors without significant existing asset holdings, it means the cost of entering markets or buying a home rises faster than their ability to save.
The structural explanation centres on deficit spending: governments borrow heavily during crises, and the cash that flows to wealthier households gets deployed into asset markets, pushing prices higher. This pattern has repeated across four separate crises since 2008, from the global credit crisis through to the 2025-2026 geopolitical disruptions.
When governments run large deficits, the new spending accumulates unevenly, with higher-net-worth individuals more likely to save and invest surpluses rather than spend them on consumption. That surplus capital flows into equities, property, and hard assets, increasing demand against a relatively fixed supply and pushing prices higher.
The interest-rate-only explanation broke down after 2022 because structural liquidity floors built up through years of central bank asset purchases did not disappear when policy rates rose. Gold delivered roughly 95% returns and the S&P 500 pushed to successive records even as rates returned to approximately 5%, a combination that IMF and BIS research attributed to persistent fiscal deficits and institutional liquidity rather than rate dynamics alone.
Three documented approaches include consistent contributions to diversified low-cost index funds regardless of market level, barbell portfolios combining safety assets with hard assets like gold and silver alongside equity index exposure, and prioritising debt reduction plus emergency savings before increasing market exposure.