
What Equity Lines of Credit Actually Cost Small-Cap Investors
6 hrs ago

In mid-June 2026, the national average 30-year fixed mortgage rate sits at approximately 6.55%. The 10-year Treasury yield sits at approximately 4.48%. The gap between those two numbers, roughly 2 percentage points, is not a coincidence. It is the product of a mechanical relationship that governs how lenders price long-term home loans across the United States. Most homebuyers watch mortgage rate headlines without understanding what actually moves them. The answer, almost always, is the same instrument: the 10-year U.S. Treasury yield. Understanding this link gives buyers and refinancers a real-time signal that lenders are already using to set quotes. This article explains that mechanical connection, translates current rates into concrete monthly and lifetime dollar figures on a $400,000 loan, and provides a framework for interpreting yield movements before committing to a rate lock.
The price a homebuyer pays to borrow for 30 years is anchored to what the U.S. government pays to borrow for 10 years. That sounds paradoxical, but the mechanics resolve it quickly.
The 10-year Treasury yield is treated as the closest thing to a risk-free return in financial markets. Banks use it as a baseline when pricing longer-duration loans because lending to the federal government carries no default risk. Mortgage-backed securities (MBS), the bundled pools of home loans that investors buy, compete directly with Treasuries for the same fixed-income capital. For mortgage investments to attract buyers, they must offer a yield above Treasuries to compensate for the additional risks that come with lending to homeowners rather than the government.
The bond yield mechanics behind this relationship are more precisely mathematical than intuitive: because a Treasury bond’s coupon payment is fixed at issuance, any change in the bond’s market price automatically moves its yield in the opposite direction, which is why a surge in demand for Treasuries pushes yields down and, with a lag, pulls mortgage rates lower.
That additional yield is called the spread, and it reflects three specific risk components:
Since the Freddie Mac Primary Mortgage Market Survey began, the average spread has been approximately 1.88 percentage points above the 10-year yield.
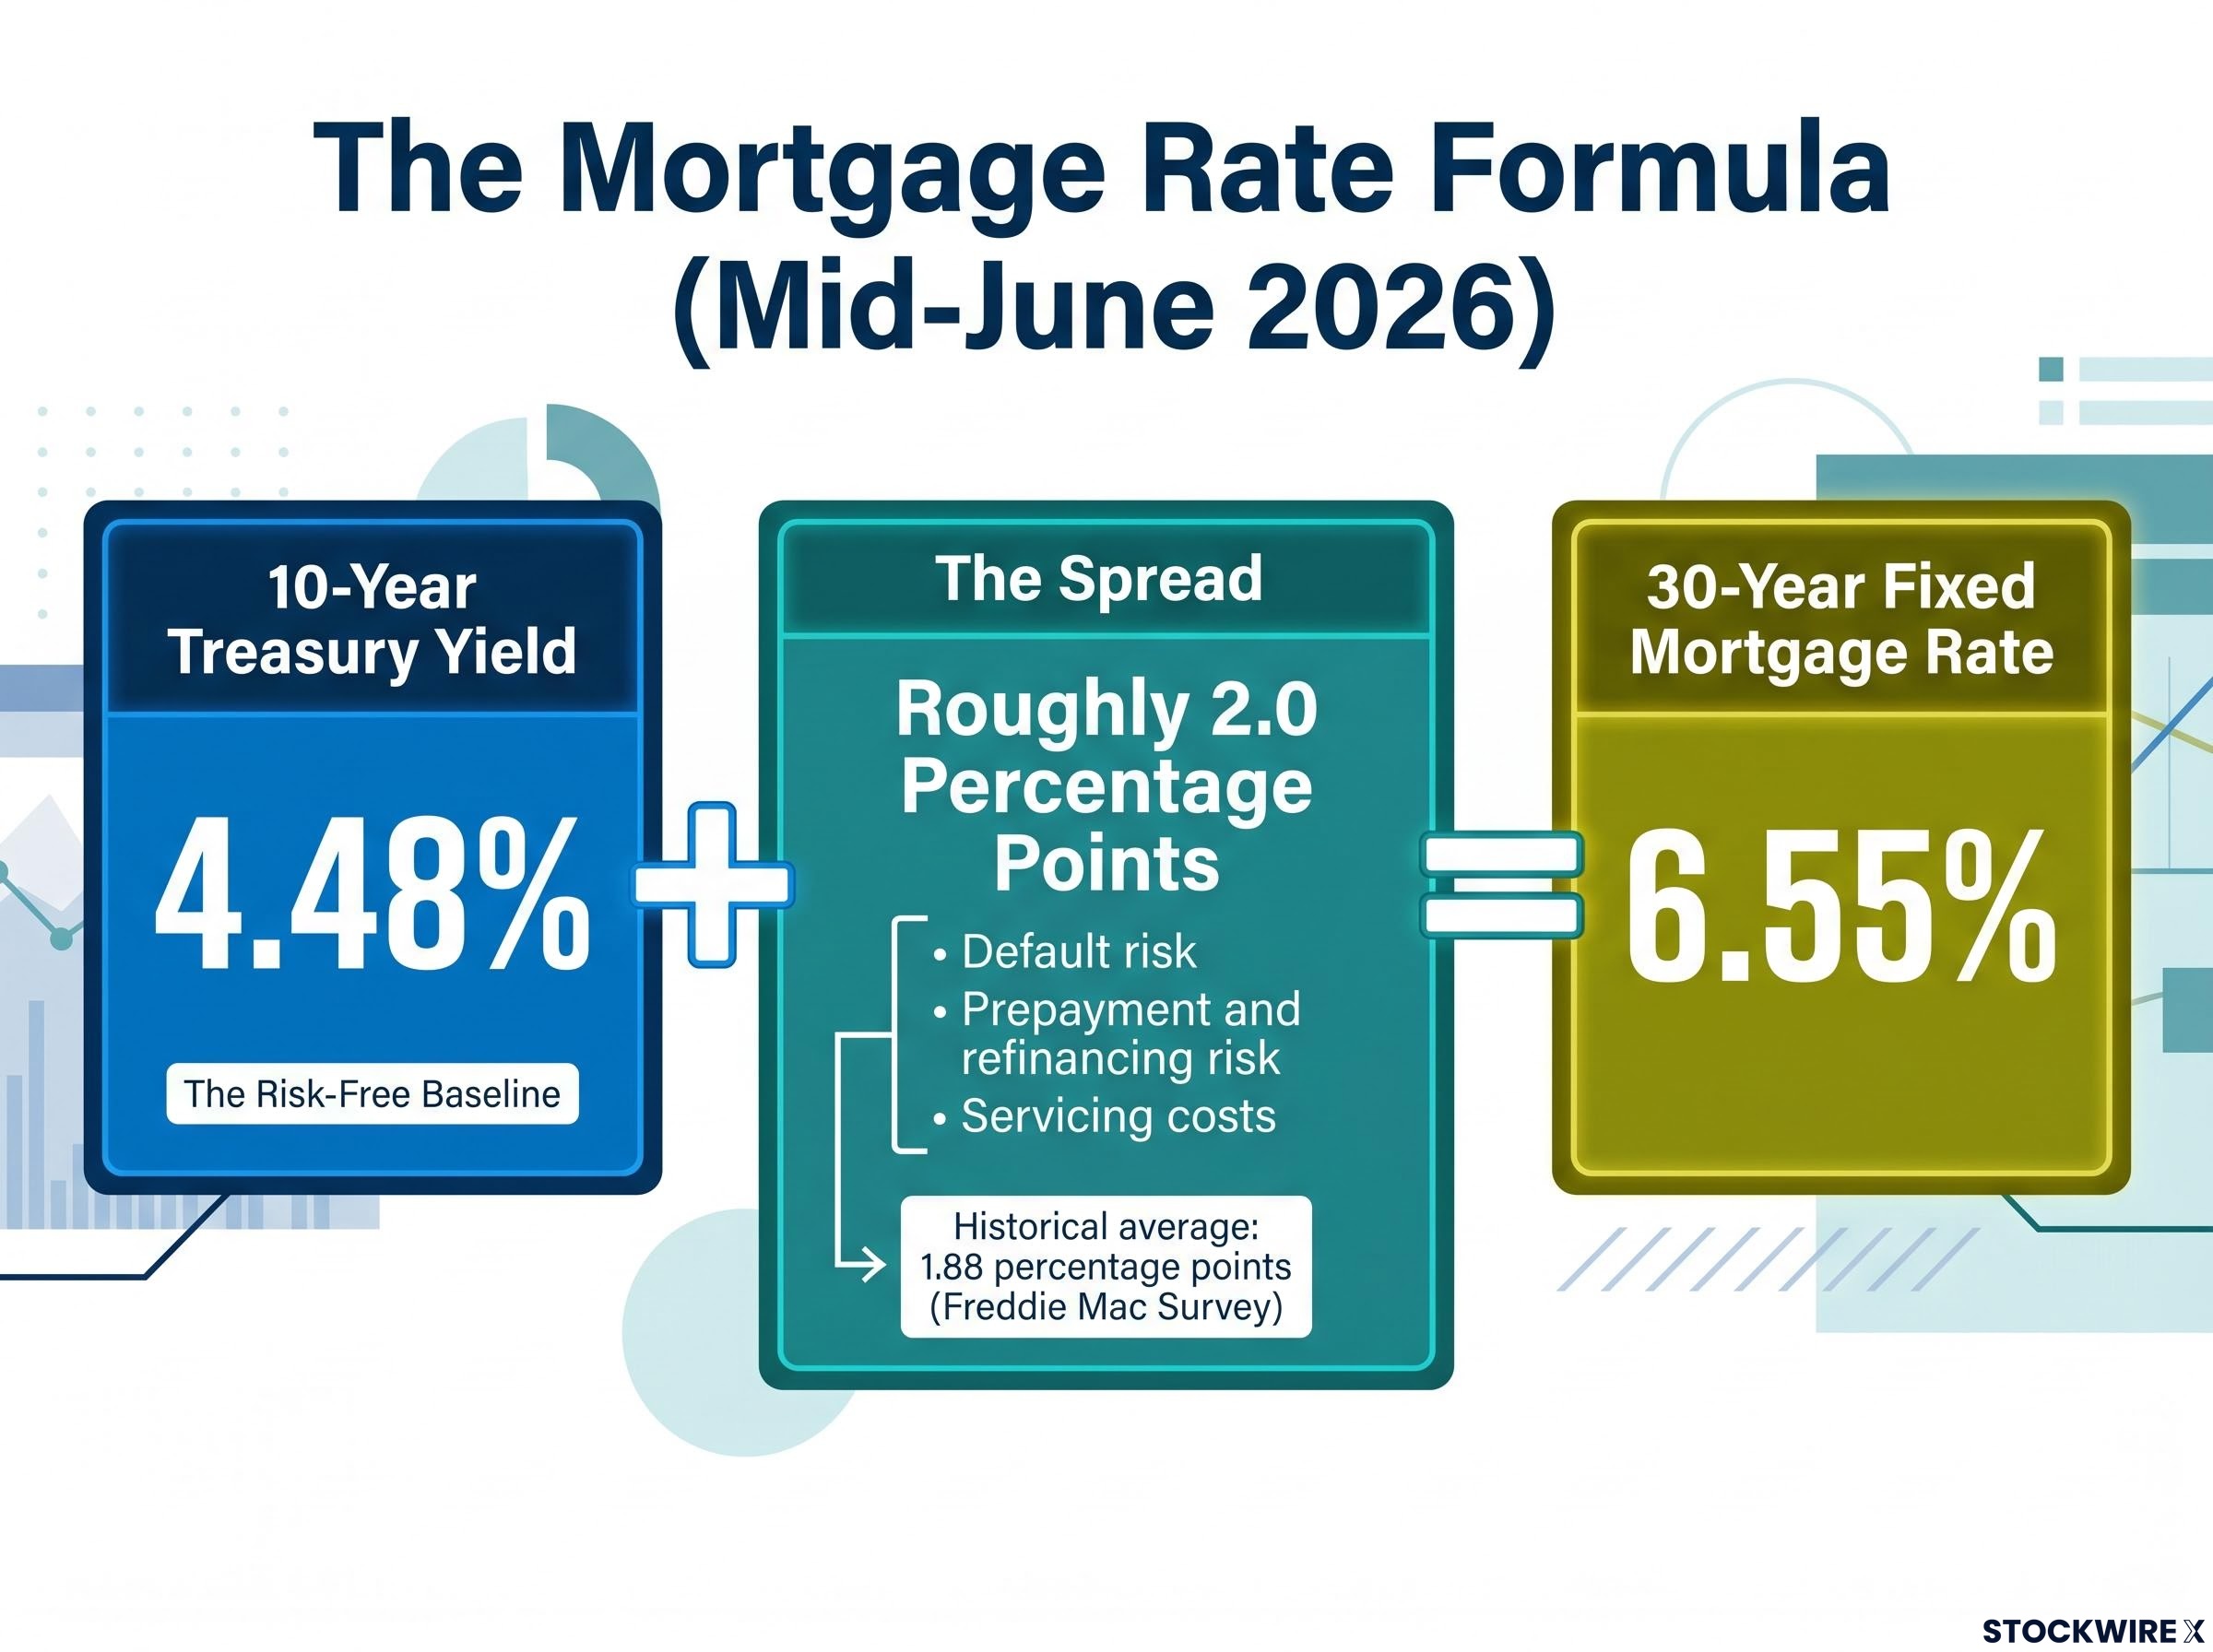
Rule of thumb: 30-year fixed mortgage rate approximately equals the 10-year Treasury yield plus roughly 2 percentage points.
This is a historical average reference point, not a fixed formula. The spread moves with market conditions. But over time, it is a dependable guide, and it explains why every move in the 10-year yield ripples directly into the mortgage rate a buyer is quoted.
A Treasury yield represents what investors earn for lending money to the U.S. government for a defined period. A 10-year Treasury yield of 4.48% means an investor buying that bond today locks in an annualised return of 4.48% for the next decade, backed by the full faith and credit of the federal government. Because the U.S. government has never defaulted on its debt, this return is treated as the baseline against which virtually all other lending rates are priced.
The natural question is why a 10-year maturity anchors a 30-year loan. The answer lies in borrower behaviour. Most 30-year mortgages never reach their full term. Homeowners sell, refinance, or pay off their loans well before the 30th year. The effective duration of a typical mortgage, meaning the average time the loan is actually outstanding, lands much closer to 10 years. That makes the 10-year Treasury a better duration match than the 2-year or 30-year bond.
The yield curve is a line connecting Treasury yields across all maturities, from three months to 30 years. Its shape carries economic signals that feed directly into mortgage pricing.
| Maturity | Yield (Mid-June 2026) | What It Signals |
|---|---|---|
| 3-month | 3.71% | Current short-term Fed policy rate environment |
| 2-year | 4.09% | Market expectations for near-term Fed rate path |
| 10-year | 4.48% | Growth and inflation expectations over the next decade; the mortgage rate anchor |
| 30-year | 5.0% | Long-run inflation compensation and term premium |
The current curve slopes upward, which is the normal configuration. Each successive maturity offers a higher yield, reflecting the greater compensation investors demand for longer time horizons. An upward-sloping curve is consistent with expectations for steady economic growth and no imminent Fed rate cuts, which means higher-for-longer mortgage rates.
When the curve inverts, with short-term yields exceeding long-term yields, the signal flips. Inversions historically precede recessions and eventual Fed rate cuts, which pull mortgage rates lower over time. Research from the Federal Reserve Bank of San Francisco found that all 10 U.S. recessions since 1955 were preceded by a yield curve inversion, a perfect record across roughly 70 years.
The current upward slope suggests that mid-6% mortgage rates are likely to persist in the near term.
A percentage point is an abstraction until it appears on a monthly statement. The current rate environment, with the 10-year yield at approximately 4.48% and the national average 30-year fixed rate at approximately 6.55%, produces a spread of roughly 2.0 percentage points. That spread is behaving normally relative to historical averages.
On a $400,000 loan at current rates, here is what the numbers look like, and what they become if the 10-year yield rises:
| Rate | Monthly P&I ($400K Loan) | Additional Monthly Cost vs. Baseline | Additional 30-Year Total Cost |
|---|---|---|---|
| 6.55% (current baseline) | $2,542 | — | — |
| 7.05% (+0.5 points) | $2,676 | +$134/month | +$48,240 |
| 7.55% (+1.0 points) | $2,812 | +$270/month | +$97,200 |
A half-point move in the 10-year yield, the kind that can occur over a few weeks, translates into roughly $48,240 in additional lifetime mortgage cost. These figures scale proportionally for different loan sizes.
The current spread of approximately 2.0 percentage points as of mid-June 2026 represents a normalisation from the 2022-2023 period, when it widened to approximately 2.2-3.0 percentage points above the 10-year yield.
That normalisation is worth noting. During the tightening cycle, buyers were paying an unusually wide premium over Treasuries. The current environment, while not cheap, at least reflects a normally functioning spread.
The spread’s return toward its long-run average is part of a broader yield normalisation that followed more than a decade of quantitative easing, during which the Fed, Bank of England, ECB, and Bank of Japan collectively suppressed yields below levels consistent with economic fundamentals, creating the distorted baseline against which today’s rates feel extreme.
The numbers from the past five years tell the story more effectively than any commentary.
Freddie Mac’s Primary Mortgage Market Survey recorded a 30-year fixed rate of 2.65% in January 2021, the lowest in the survey’s history. By October 2023, that same rate had climbed to 7.79%.
The Freddie Mac Primary Mortgage Market Survey has tracked 30-year fixed rates since 1971, providing the longest continuous dataset of U.S. mortgage pricing available and forming the foundation for historical spread analysis between Treasury yields and home loan rates.
| Rate Environment | 30-Year Fixed Rate | Monthly P&I on $400K | Total 30-Year Interest Cost |
|---|---|---|---|
| January 2021 (record low) | 2.65% | $1,612 | Lowest in survey history |
| October 2023 (recent peak) | 7.79% | $2,877 | Near-historic high |
| Mid-June 2026 (current) | 6.55% | $2,542 | Moderate relief from peak |
The monthly payment difference between the 2021 trough and 2023 peak is approximately $1,265. Over 30 years, that gap amounts to roughly $455,349 in additional total cost on the same $400,000 loan.
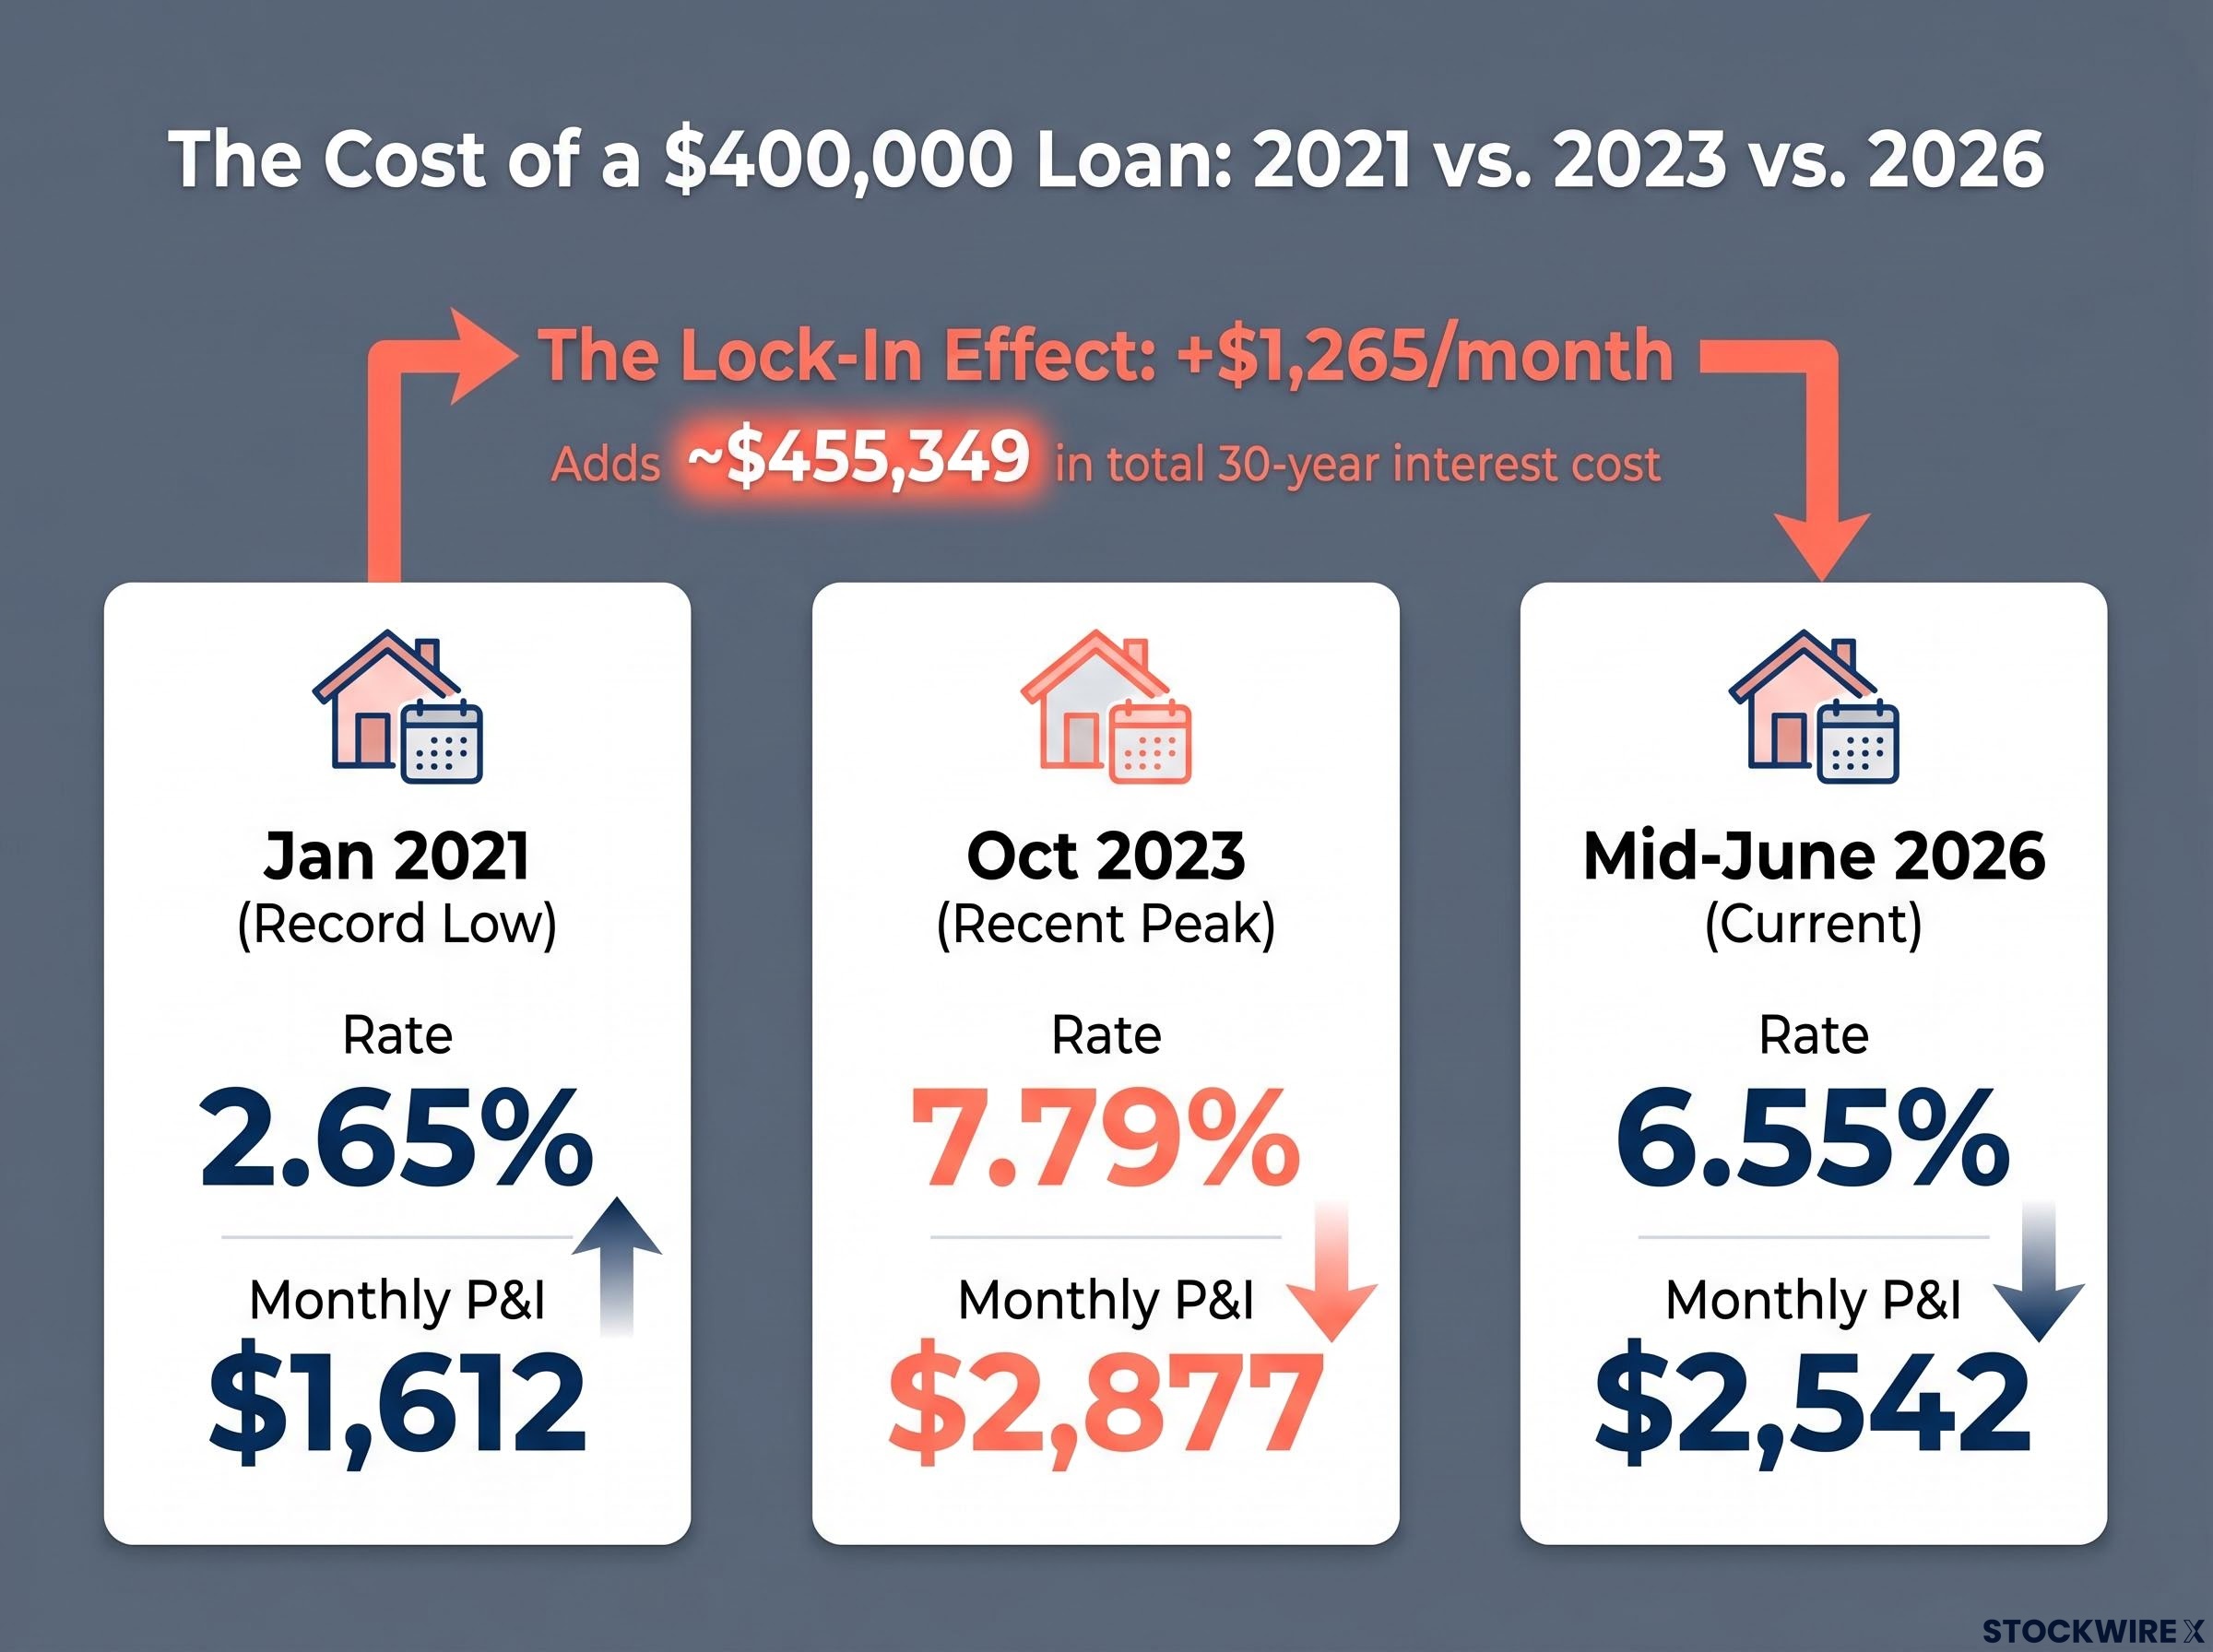
A homeowner who locked a 2.65% rate in 2021 and sells today would take on a new mortgage at more than double the rate, adding approximately $455,349 in lifetime cost. That is the lock-in effect constraining the U.S. housing market.
This dynamic explains why existing home inventory has remained tight. Homeowners with sub-3% mortgages face enormous financial disincentive to sell and take on a new loan at current rates. The result is fewer listings, sustained price pressure, and limited supply for buyers.
The housing supply constraints visible in current listing data reflect the lock-in effect in action: with housing’s direct contribution to GDP having shrunk to the low single digits from a pre-GFC peak of roughly 6.5%, the economic drag from frozen inventory is more muted than the headline figures suggest, even as the affordability pressure on individual buyers remains acute.
The current 6.55% rate represents meaningful relief from the 7.79% peak, saving roughly $335 per month on a $400,000 loan compared with October 2023 pricing. But it remains far from the sub-3% environment that defined 2020-2021. Buyers who calibrate expectations against both ends of this range, rather than anchoring exclusively to either extreme, are better positioned to make a sound decision.
The 10-year yield is a more timely leading indicator than the mortgage rate headlines most buyers rely on. Lenders adjust quotes in near real time to yield movements, while published survey data from Freddie Mac and other sources can lag by several days. Watching the yield directly gives a buyer an earlier signal of where quotes are heading.
Three actions put this relationship to work:
The FRED DGS10 data series from the Federal Reserve Bank of St. Louis publishes the 10-year Treasury constant maturity rate each trading day, giving buyers a free, authoritative source that updates faster than any weekly mortgage rate survey.
Two conditions under which large, sustained rate drops become realistic:
Research from the Richmond Fed indicates that spread movements are driven more by changing mortgage duration and refinancing expectations than by pure risk stress. Without one of those two catalysts, expecting a rapid return to 3-4% mortgage rates is speculative. The current upward-sloping yield curve does not suggest either condition is imminent.
The core mechanic is straightforward: the 10-year Treasury yield moves, and mortgage rates follow. The current spread of approximately 2.0 percentage points signals that this relationship is behaving normally. A 4.48% yield and a 6.55% mortgage rate are exactly where the historical formula says they should be.
The yield curve’s upward slope points toward stability rather than imminent decline in rates. No analyst can reliably time rate turns, and waiting for a return to 3-4% mortgages without a recession catalyst remains speculative. The more productive question is not “when will rates fall?” but “what does the current rate mean for my specific purchase or refinance decision today?”
At current rate levels, the compressed spread between mortgage costs and investment returns has narrowed the once-automatic case for investing surplus cash to under half a percentage point in after-tax terms for non-itemising borrowers in taxable accounts, a margin thin enough that the guaranteed return from principal prepayment now competes meaningfully with expected equity market returns.
The 10-year Treasury yield is the most accessible real-time signal of where mortgage rates are heading. Monitoring it daily takes seconds and puts buyers weeks ahead of published rate surveys.
Readers can bookmark the FRED DGS10 data series to track the 10-year yield directly. Combined with the spread framework and break-even calculations outlined above, it provides a practical toolkit for making mortgage decisions grounded in data rather than headlines.
This article is for informational purposes only and should not be considered financial advice. Investors should conduct their own research and consult with financial professionals before making investment decisions. Past performance does not guarantee future results. Financial projections are subject to market conditions and various risk factors.
The 30-year fixed mortgage rate is priced at roughly 2 percentage points above the 10-year Treasury yield, because mortgage-backed securities must offer a premium over risk-free government debt to attract investors.
Most 30-year mortgages are paid off, refinanced, or sold well before maturity, giving them an effective duration closer to 10 years, which makes the 10-year Treasury a better match for pricing home loans.
On a $400,000 loan, a 0.5 percentage point rate increase adds approximately $134 per month and roughly $48,240 in total interest cost over the life of the loan.
The FRED DGS10 data series from the Federal Reserve Bank of St. Louis publishes the 10-year Treasury constant maturity rate each trading day for free, and it updates faster than weekly mortgage rate surveys from lenders.
The upward-sloping yield curve as of mid-2026 is consistent with expectations for steady economic growth and no imminent Federal Reserve rate cuts, which points toward mid-6% mortgage rates persisting in the near term.