China’s Two-Speed Economy: What the 111% Export Surge Misses
32 mins ago

At a 3% mortgage rate, the arithmetic was straightforward. The S&P 500’s long-run 10% average annual return left a 7-percentage-point spread in favour of investing, and prepayment looked like an expensive form of conservatism. At 6.37% today, that spread has compressed to less than half a percentage point on an after-tax basis in a taxable account. Millions of homeowners are still operating on advice calibrated to a rate environment that no longer exists.
Between 2022 and 2025, roughly 15 million American households locked in mortgages at rates between 6% and 8%. For most of them, the conventional “invest the difference” guidance that proliferated during the 2020-2021 low-rate window is now directionally wrong, or at minimum, far less decisive. Financial planners have updated their frameworks. Many homeowners have not.
What follows is the actual scenario maths at current rates, an honest accounting of what each strategy wins and loses, and a sequenced decision framework calibrated to where rates stand in May 2026.
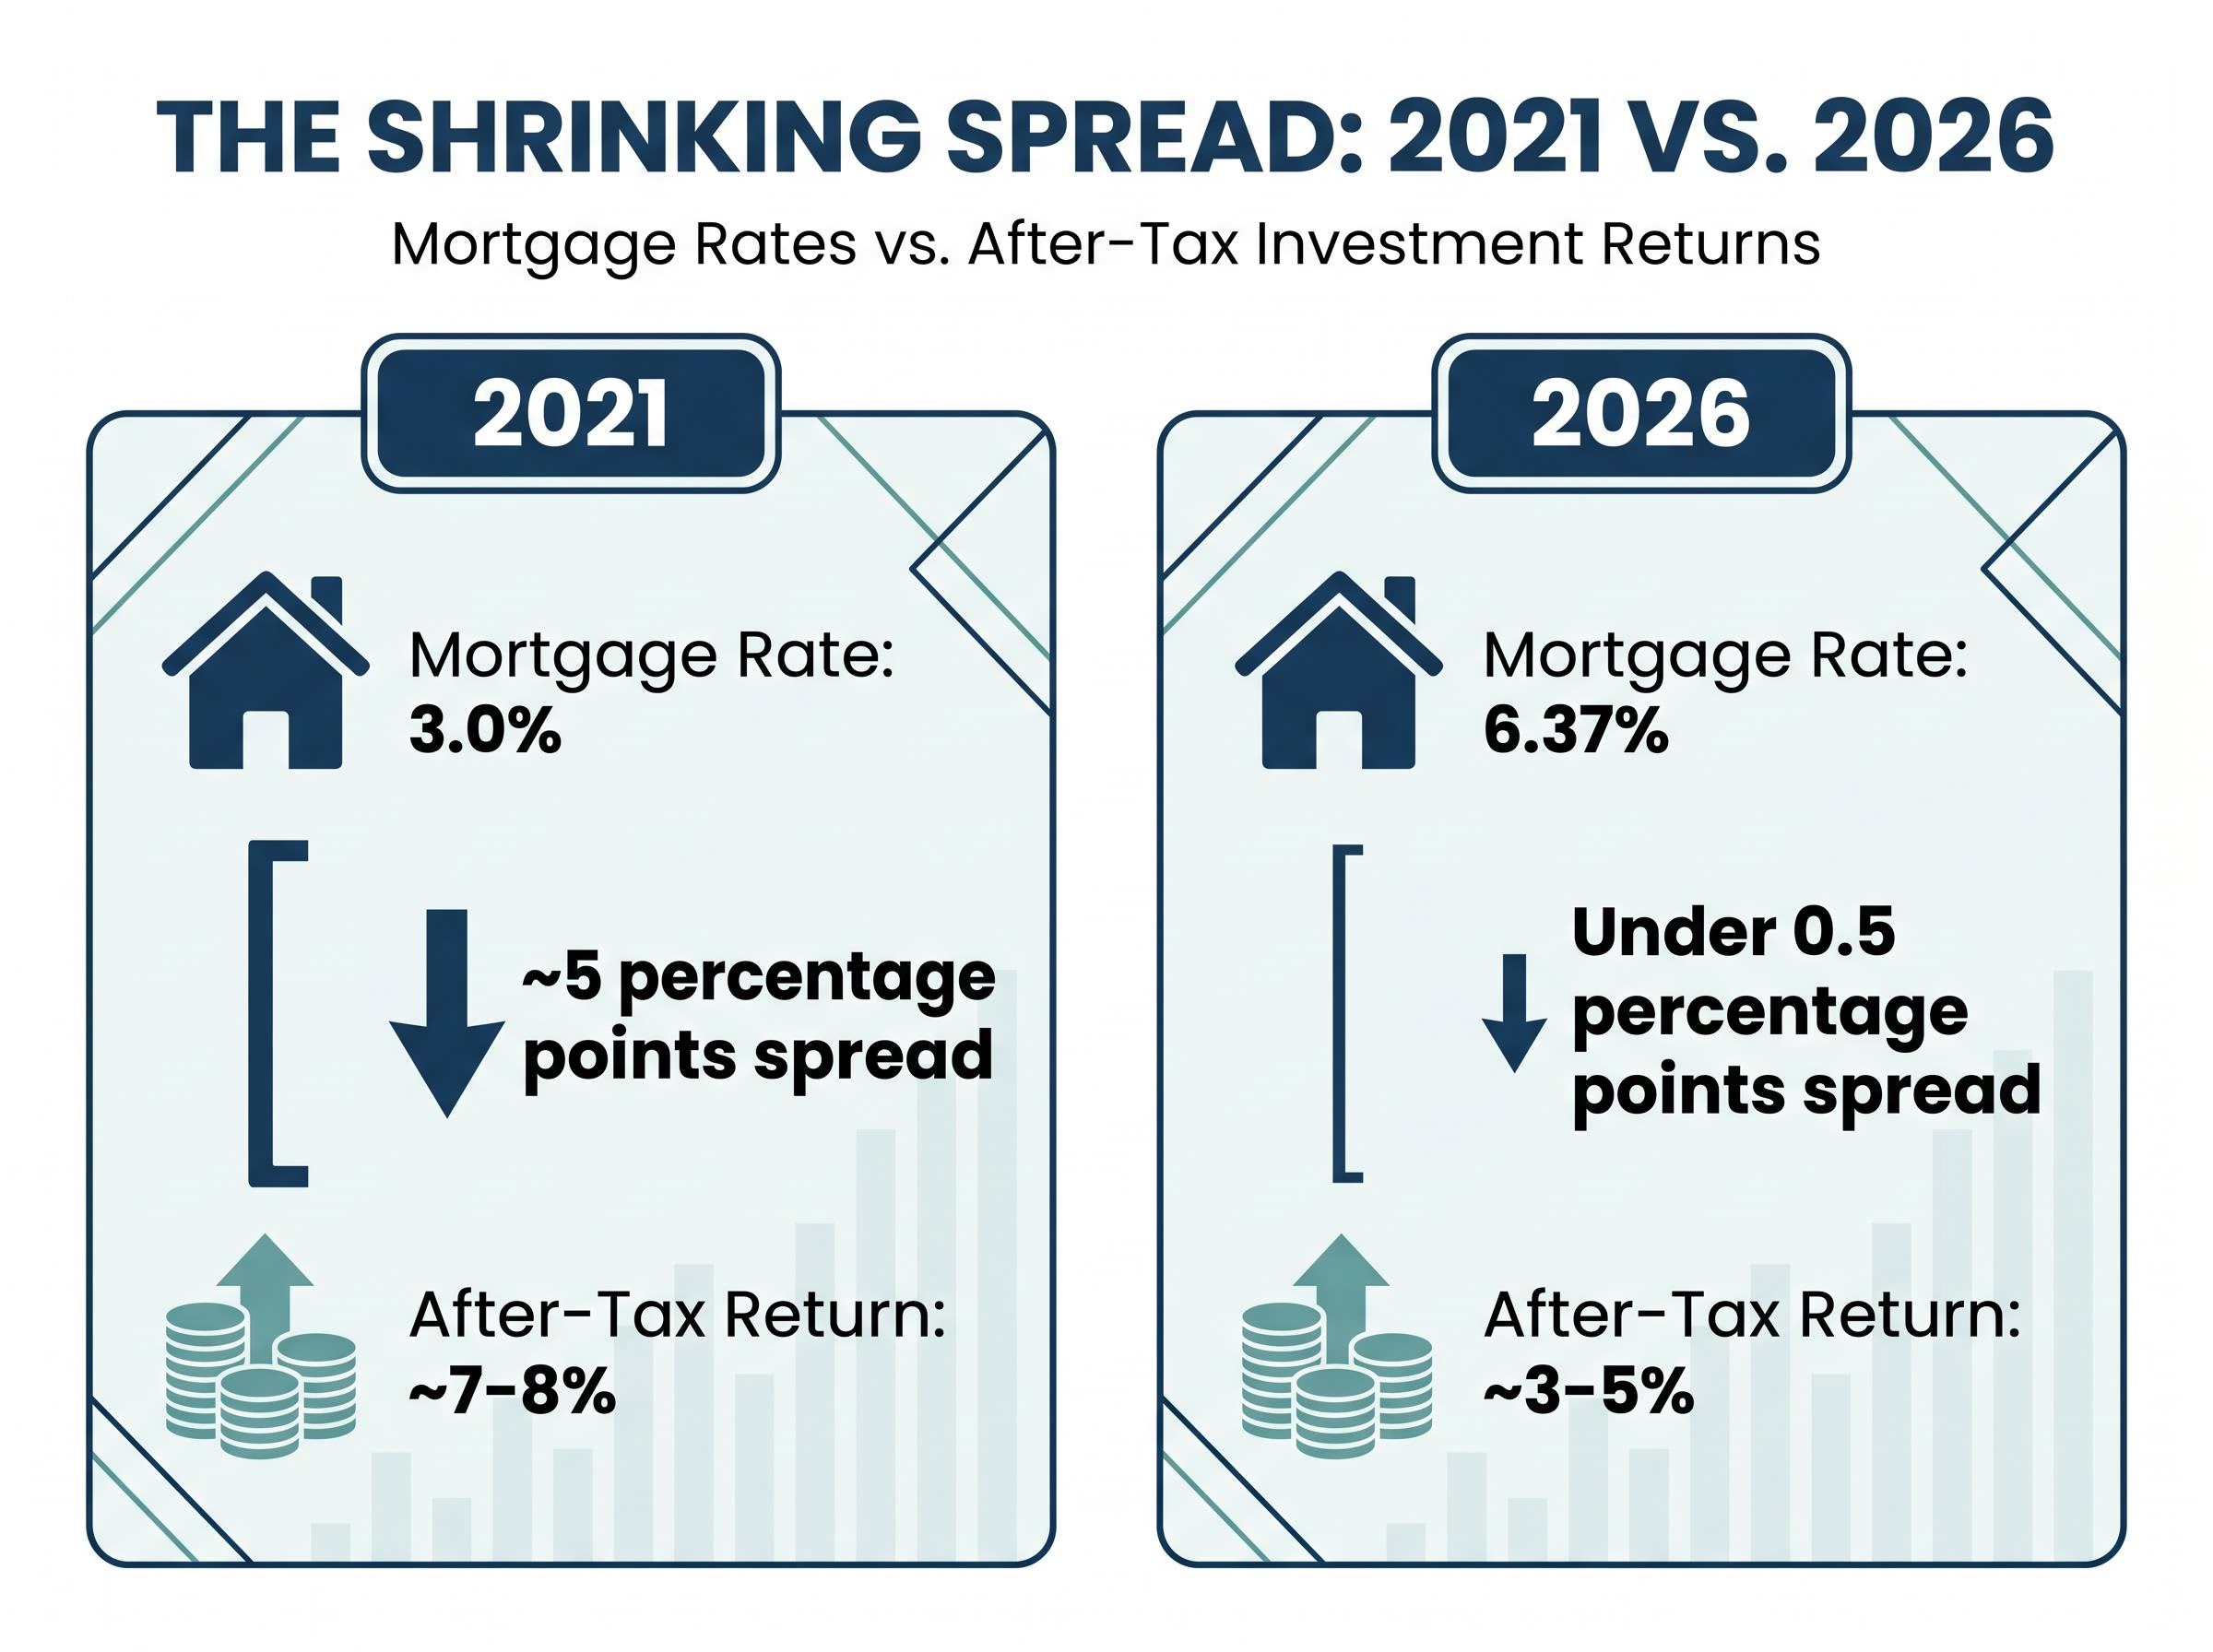
In 2021, a homeowner carrying a 3% fixed mortgage and investing the difference in a broad index fund could reasonably expect a 7-percentage-point annual spread between investment returns and borrowing costs. That spread made the decision nearly automatic.
By May 2026, the 30-year fixed rate has climbed to 6.37%, according to the Freddie Mac Primary Mortgage Market Survey. Forward-looking return expectations have moved in the opposite direction. Vanguard’s April 2026 outlook projects 4%-5% annualised real returns through 2030. JPMorgan’s Q1 2026 guide estimates 5.8% annualised over ten years, roughly half the historical 10% average.
The Fed interest rate outlook matters directly to this decision: borrowers expecting rates to fall below 5% within two to three years may reassess refinancing timelines, which would change the effective cost of carrying a 6.37% mortgage and shift the break-even return threshold for the invest-first strategy.
For most borrowers, the effective cost of a 6.37% mortgage is the full 6.37%. The 2026 standard deduction of $30,000 for married filing jointly means most households cannot itemise, eliminating the mortgage interest deduction that once softened effective borrowing costs.
| Year | Mortgage Rate | Realistic After-Tax Return | Rate Spread |
|---|---|---|---|
| 2021 | 3.0% | ~7-8% | ~5 percentage points |
| 2026 | 6.37% | ~3-5% | Under 0.5 percentage points |
In a taxable account, the after-tax spread between expected investment returns and a 6.37% mortgage now sits below 0.5 percentage points, down from roughly 5 points five years ago.
The compression is not a matter of opinion. It is a measurable shift in the financial arithmetic that once made carrying mortgage debt an easy decision.
The scenario model uses the following starting conditions: a 35-year-old borrower earning $90,000 annually, purchasing a $400,000 home with 20% down, financed at 6.5% over 30 years. Monthly principal and interest on the $320,000 balance comes to approximately $2,022. The borrower has $500 per month in discretionary surplus.
Under the prepayment path, that $500 goes to additional principal each month. The mortgage is eliminated by year 18, freeing $2,522 per month for investing in years 18-30. Under the invest-first path, the $500 goes into a low-cost index fund for the full 30-year term while minimum mortgage payments continue on schedule.
These are modelled calculations, not guarantees. Actual outcomes depend on realised market returns, tax rates, and individual circumstances.
At 7% annualised returns, the invest-first portfolio reaches approximately $612,000, while the prepayment portfolio accumulates roughly $560,000. After capital gains taxes (approximately $61,000 for the invest-first path versus $30,000 for the prepayment path), after-tax net worth lands at roughly $951,000 versus $930,000. The gap: about $21,000, or less than 2.5%.
The outcome, however, shifts entirely depending on realised returns.
| Market Return | Invest-First Net Worth | Prepayment Net Worth | Difference | Winner |
|---|---|---|---|---|
| 5% | ~$830,000 | ~$930,000 | ~$100,000 | Prepayment |
| 6% | ~$890,000 | ~$930,000 | ~$40,000 | Prepayment |
| 7% | ~$951,000 | ~$930,000 | ~$21,000 | Invest-first |
| 8% | ~$1,020,000 | ~$930,000 | ~$90,000 | Invest-first |
| 10% | ~$1,130,000 | ~$930,000 | ~$200,000 | Invest-first |
At a 10-year midpoint check, the prepayment borrower has reduced the remaining balance to roughly $28,000 versus approximately $260,000 still on schedule for the invest-first borrower. The investor holds roughly $87,000 in a brokerage portfolio.
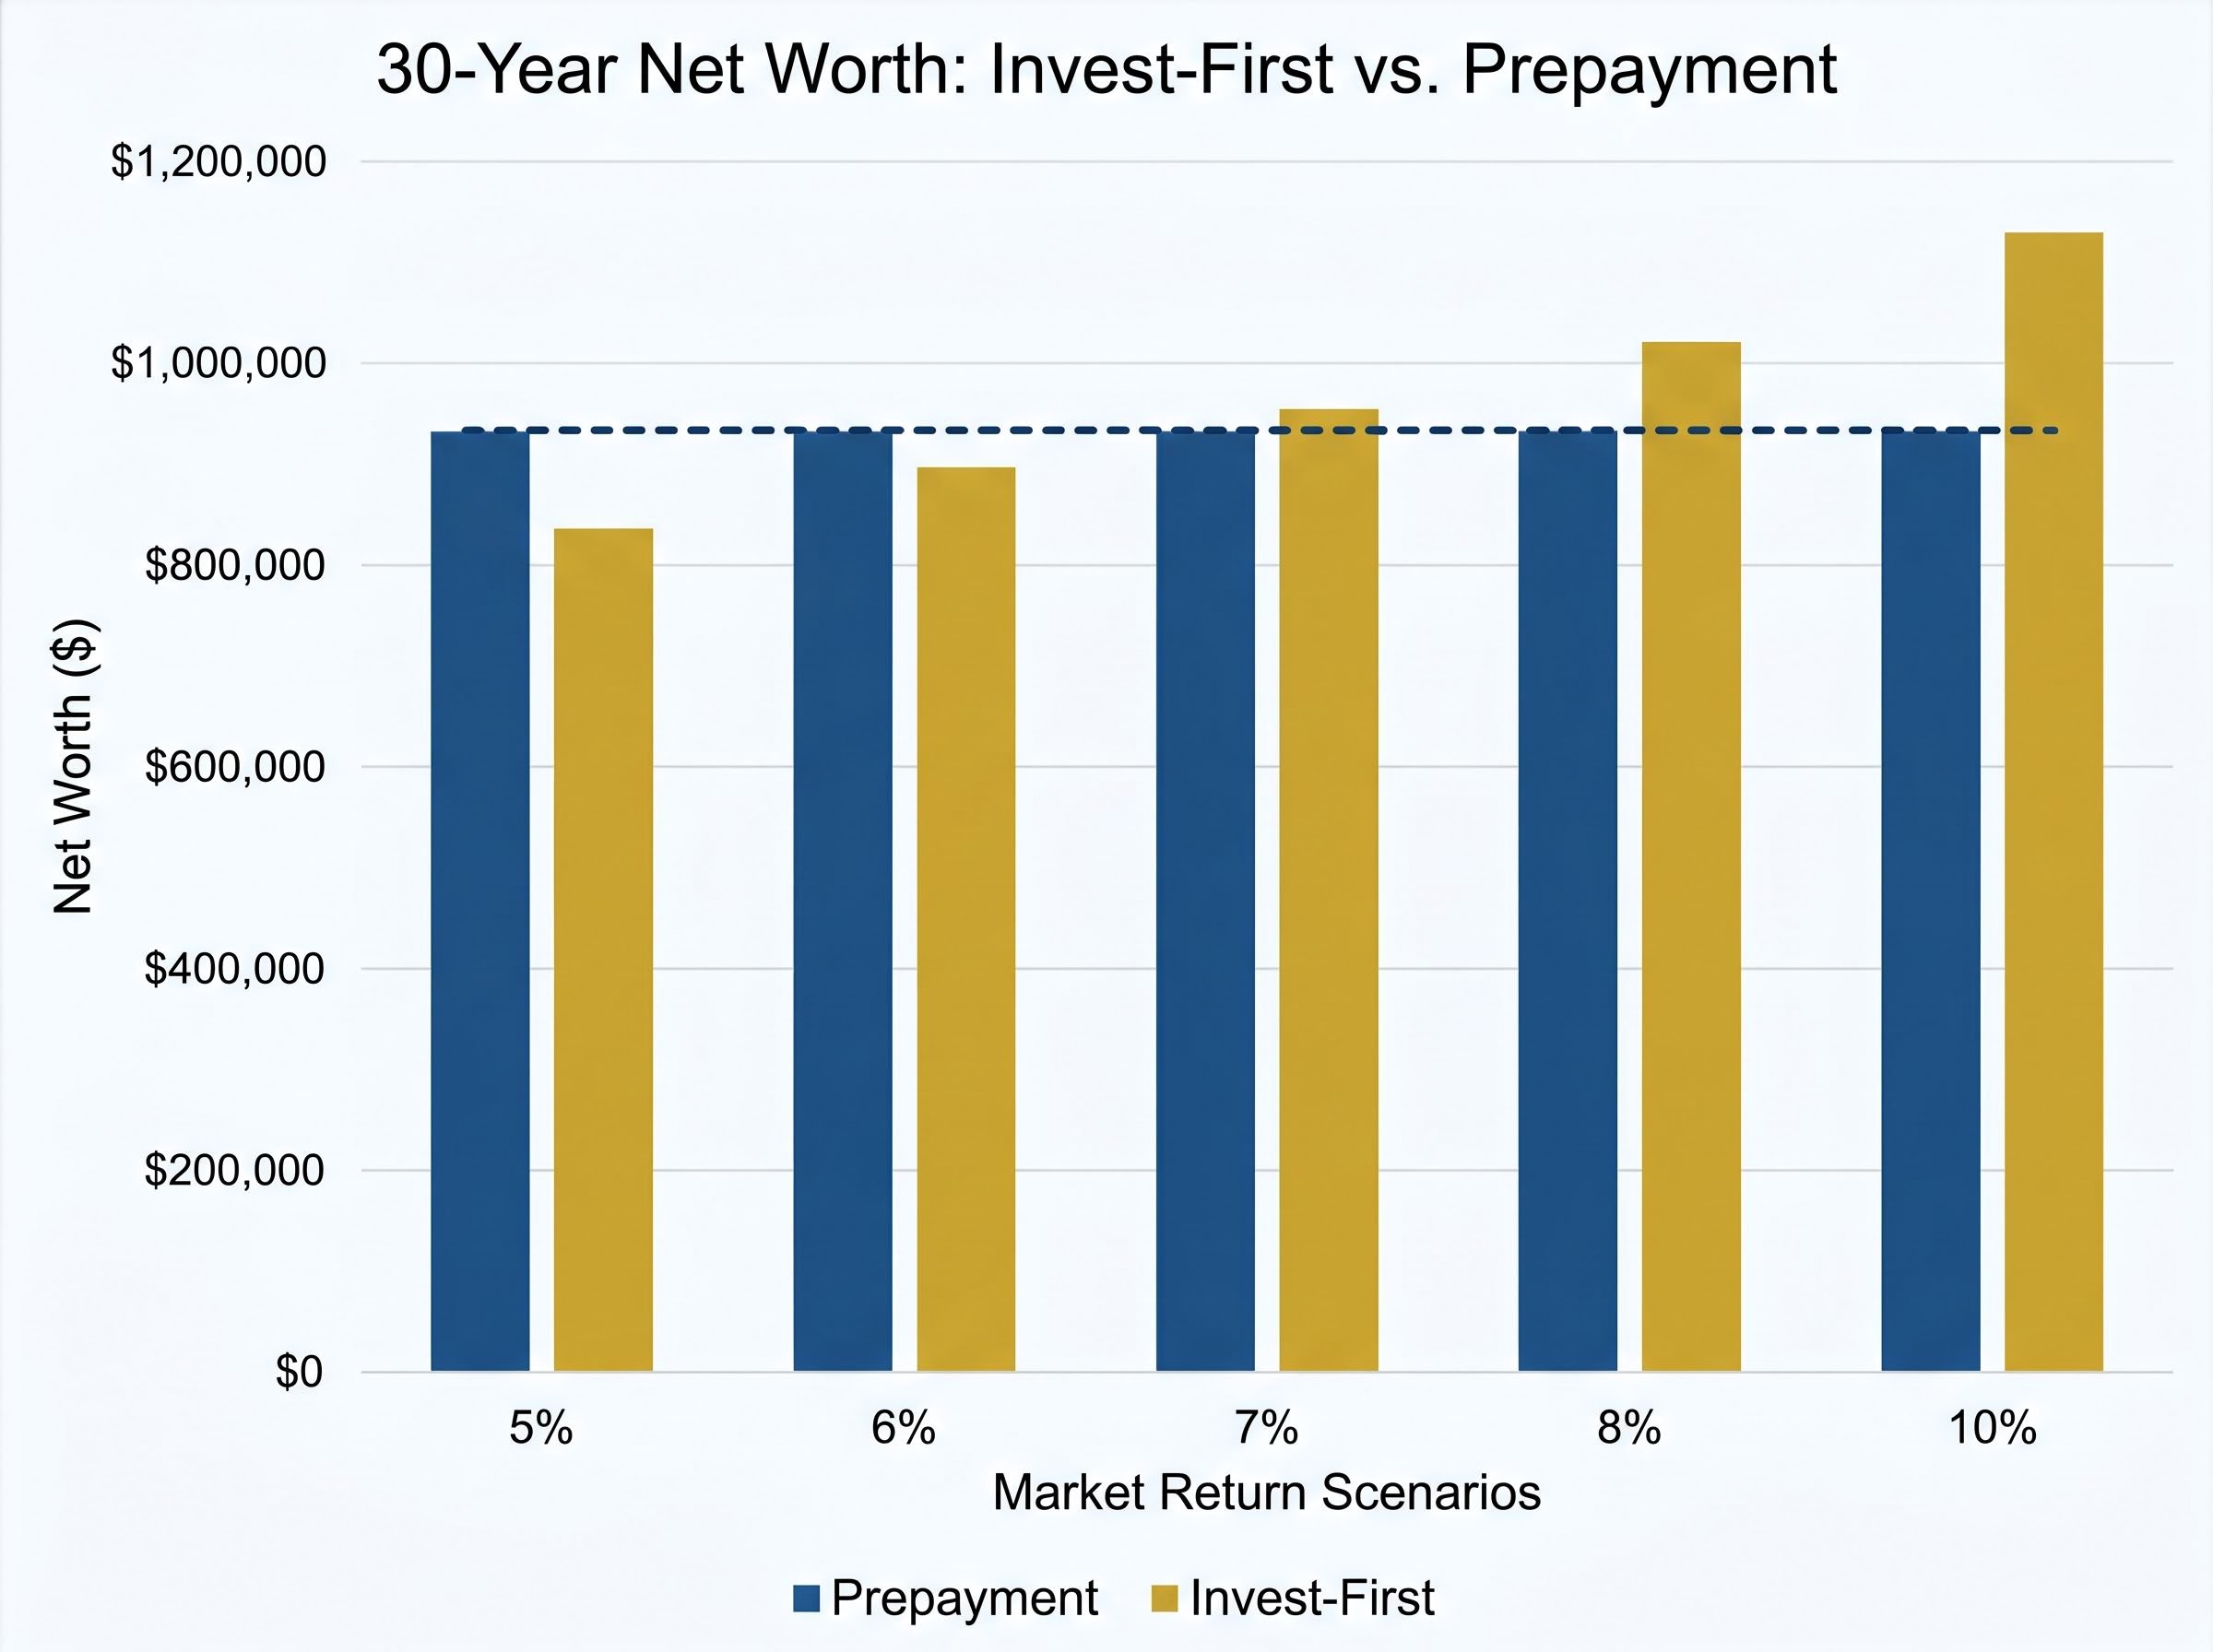
The sensitivity table is the article’s core finding. Neither strategy is a guaranteed winner. The outcome depends almost entirely on the actual market return achieved over 30 years, a variable that no one can predict with certainty.
Long-term compounding mechanics explain why the gap between invest-first and prepayment outcomes widens dramatically at higher return scenarios: the second decade of an uninterrupted investment generates nearly double the dollar gains of the first decade on the same initial capital, which is why the 10% return scenario in the sensitivity table produces a $200,000 advantage rather than a proportional one.
Each dollar applied to mortgage principal at 6.37% delivers a guaranteed, risk-free return equal to the interest that dollar would otherwise have cost. That 6.37% compares favourably to 2026’s alternative risk-free options:
The Freddie Mac Primary Mortgage Market Survey tracks weekly 30-year fixed-rate averages drawn from lenders across the country, making it the benchmark data source that mortgage analysts, financial planners, and policymakers use when assessing current borrowing costs against historical norms.
A guaranteed 6.37% return on prepaid mortgage principal, realised tax-free, exceeds the approximately 4% available from high-yield savings accounts and the roughly 4.5% Treasury yield available in May 2026.
The prepayment case rests on three distinct advantages:
By year 5 under a prepayment strategy, approximately $38,000 in future interest has been eliminated from the loan’s lifetime cost.
The behavioural dimension reinforces the quantitative case. Research in behavioural finance consistently shows the average investor underperforms the broad market by approximately 1%-2% annually through panic selling and mistimed re-entry. That behavioural gap, applied to an already thin theoretical spread, can turn a marginal investing advantage into a realised loss relative to prepayment.
At current rates, prepayment has a quantitative foundation that was absent when mortgages cost 3%. It is a rational financial choice, not merely an emotional one.
The strongest version of the investing case centres on tax-advantaged accounts. A 401(k) employer match delivers an immediate 50%-100% return on contributed dollars, a guaranteed return that exceeds any mortgage prepayment benefit regardless of rate. Tax-deferred or tax-free compounding within a 401(k) (up to the 2026 limit of $24,000 for those under 50) or an IRA (up to $7,000) can outperform the mortgage rate even in a compressed-spread environment.
The taxable account version is where the numbers become less favourable. Capital gains taxes on liquidation reduce the realised portfolio value, and the spread over a 6.37% mortgage in a taxable account is too thin to reliably absorb market volatility across a 30-year window.
Federal long-term capital gains rates of 15% apply to liquidated brokerage positions, and the capital gains tax treatment of investment portfolios could become more complex if state-level proposals gain traction, adding another layer of uncertainty to the after-tax return assumptions that underpin the invest-first case.
Three structural vulnerabilities weaken the taxable invest-first approach at current rates:
The liquidity argument, however, remains legitimate. A brokerage account can be converted to cash within approximately three business days.
| Method | Cost to Access $40,000 | Time to Access |
|---|---|---|
| Brokerage liquidation (year 12) | ~$3,000-$4,000 in capital gains tax | 3 business days |
| HELOC | $1,000-$3,000 closing costs + 8%-9% interest | 4-6 weeks |
For borrowers already heavily concentrated in real estate relative to financial assets, aggressive prepayment worsens portfolio diversification. A home is a single, geographically concentrated, illiquid asset that generates no income. Continued investing, even at higher rates, may improve overall portfolio balance for some borrowers.
The mortgage-versus-invest question is not the first decision. It is the last one. Four prerequisites should be resolved before it enters the picture:
Only after these four steps have been addressed does the remaining discretionary surplus reach the investing-versus-prepayment question.
At that final step, mortgage rate determines the answer:
According to a CFP Board Q1 2026 survey, 55% of certified financial planners now recommend split strategies at current rates, allocating extra cash partially to both prepayment and investing.
An Ameriprise survey of more than 500 advisors found 62% now favour mortgage payoff over pure investing at rates above 6%, compared with just 28% in 2021. The professional consensus has shifted; the question is whether individual financial plans have shifted with it.
The 6%+ rate environment represents a genuine inflection point where the automatic “always invest” rule no longer applies. The scenario model presented above shows a total net worth gap of roughly $21,000 (under 2.5%) at 7% returns, a margin too thin to declare either strategy a clear winner.
The most common error is skipping the sequenced hierarchy and jumping directly to the mortgage-versus-invest question before capturing the guaranteed returns available from employer matches and tax-advantaged accounts. Those steps are unambiguous regardless of mortgage rate.
For homeowners operating on a financial plan designed before 2022, three actions are worth taking:
At 6.37%, neither strategy is reckless. The decision comes down to the reader’s actual numbers: their rate, their tax situation, and their available account types.
For readers who have determined that investing the difference is the right path at their rate tier and want a structured framework for executing it, our full explainer on long-term investment strategies covers dividend investing, index ETFs, international diversification, and the specific tax-advantaged account structures — including IRAs and 401(k) plans — that amplify compounding across a 20-30 year horizon.
This article is for informational purposes only and should not be considered financial advice. Investors should conduct their own research and consult with financial professionals before making investment decisions. Past performance does not guarantee future results. Financial projections are subject to market conditions and various risk factors.
—
At a 6.37% mortgage rate in 2026, an investor needs to consistently earn above 6.37% after taxes in a taxable account to outperform prepayment. After accounting for capital gains taxes of roughly 15%, the required gross return is closer to 7% or higher, which current forward projections place in uncertain territory.
Borrowers with mortgage rates between 5% and 7% are in a grey zone where the financial difference between strategies is small enough that risk tolerance and the psychological value of debt reduction become legitimate tiebreakers. A split allocation, directing surplus cash to both prepayment and investing, is a defensible approach that 55% of certified financial planners now recommend at current rates.
Before addressing the mortgage-versus-invest question, you should maintain a 3-6 month emergency fund, capture the full employer 401(k) match, maximise contributions to tax-advantaged accounts such as a 401(k) up to $24,000 and an IRA up to $7,000, and eliminate private mortgage insurance if applicable. Only surplus cash remaining after these steps should be directed to the mortgage-versus-invest decision.
For most households in 2026, the mortgage interest deduction is no longer available because the standard deduction for married filing jointly is $30,000, meaning most borrowers cannot itemise. This eliminates the tax benefit that once reduced the effective cost of carrying mortgage debt, making the full 6.37% rate the true borrowing cost for most homeowners.
At 7% annualised returns, the invest-first approach produces an after-tax net worth of roughly $951,000 versus $930,000 for the prepayment path, a gap of about $21,000 or under 2.5%. At returns of 5% or 6%, prepayment wins by $40,000 to $100,000, while returns of 8% or more are needed for investing to produce a meaningful advantage.