Vanguard VIHY Declares First Distribution at 49.49 Cents per Unit
2 hrs ago

Zip Co shares gained approximately 66% in a single month. For a stock that many investors had written off entirely, that is not a recovery story. It is a resurrection. The April 2026 surge followed the release of record quarterly earnings on 16-17 April 2026, with the company upgrading its full-year FY2026 guidance to a minimum of A$260 million cash EBTDA (earnings before tax, depreciation, and amortisation). The announcement triggered a 24% single-session spike and sustained buying through the rest of the month. For ASX retail investors, the question is no longer whether Zip has turned around. The question is whether the Zip share price now reflects everything worth knowing.
What follows is an examination of what drove the April rally, what the numbers reveal about Zip’s competitive position, and how to think about valuation when a survivor stock has already run hard.
The headline figures arrived on 16 April 2026, and they were difficult to dismiss. A summary of the key metrics:
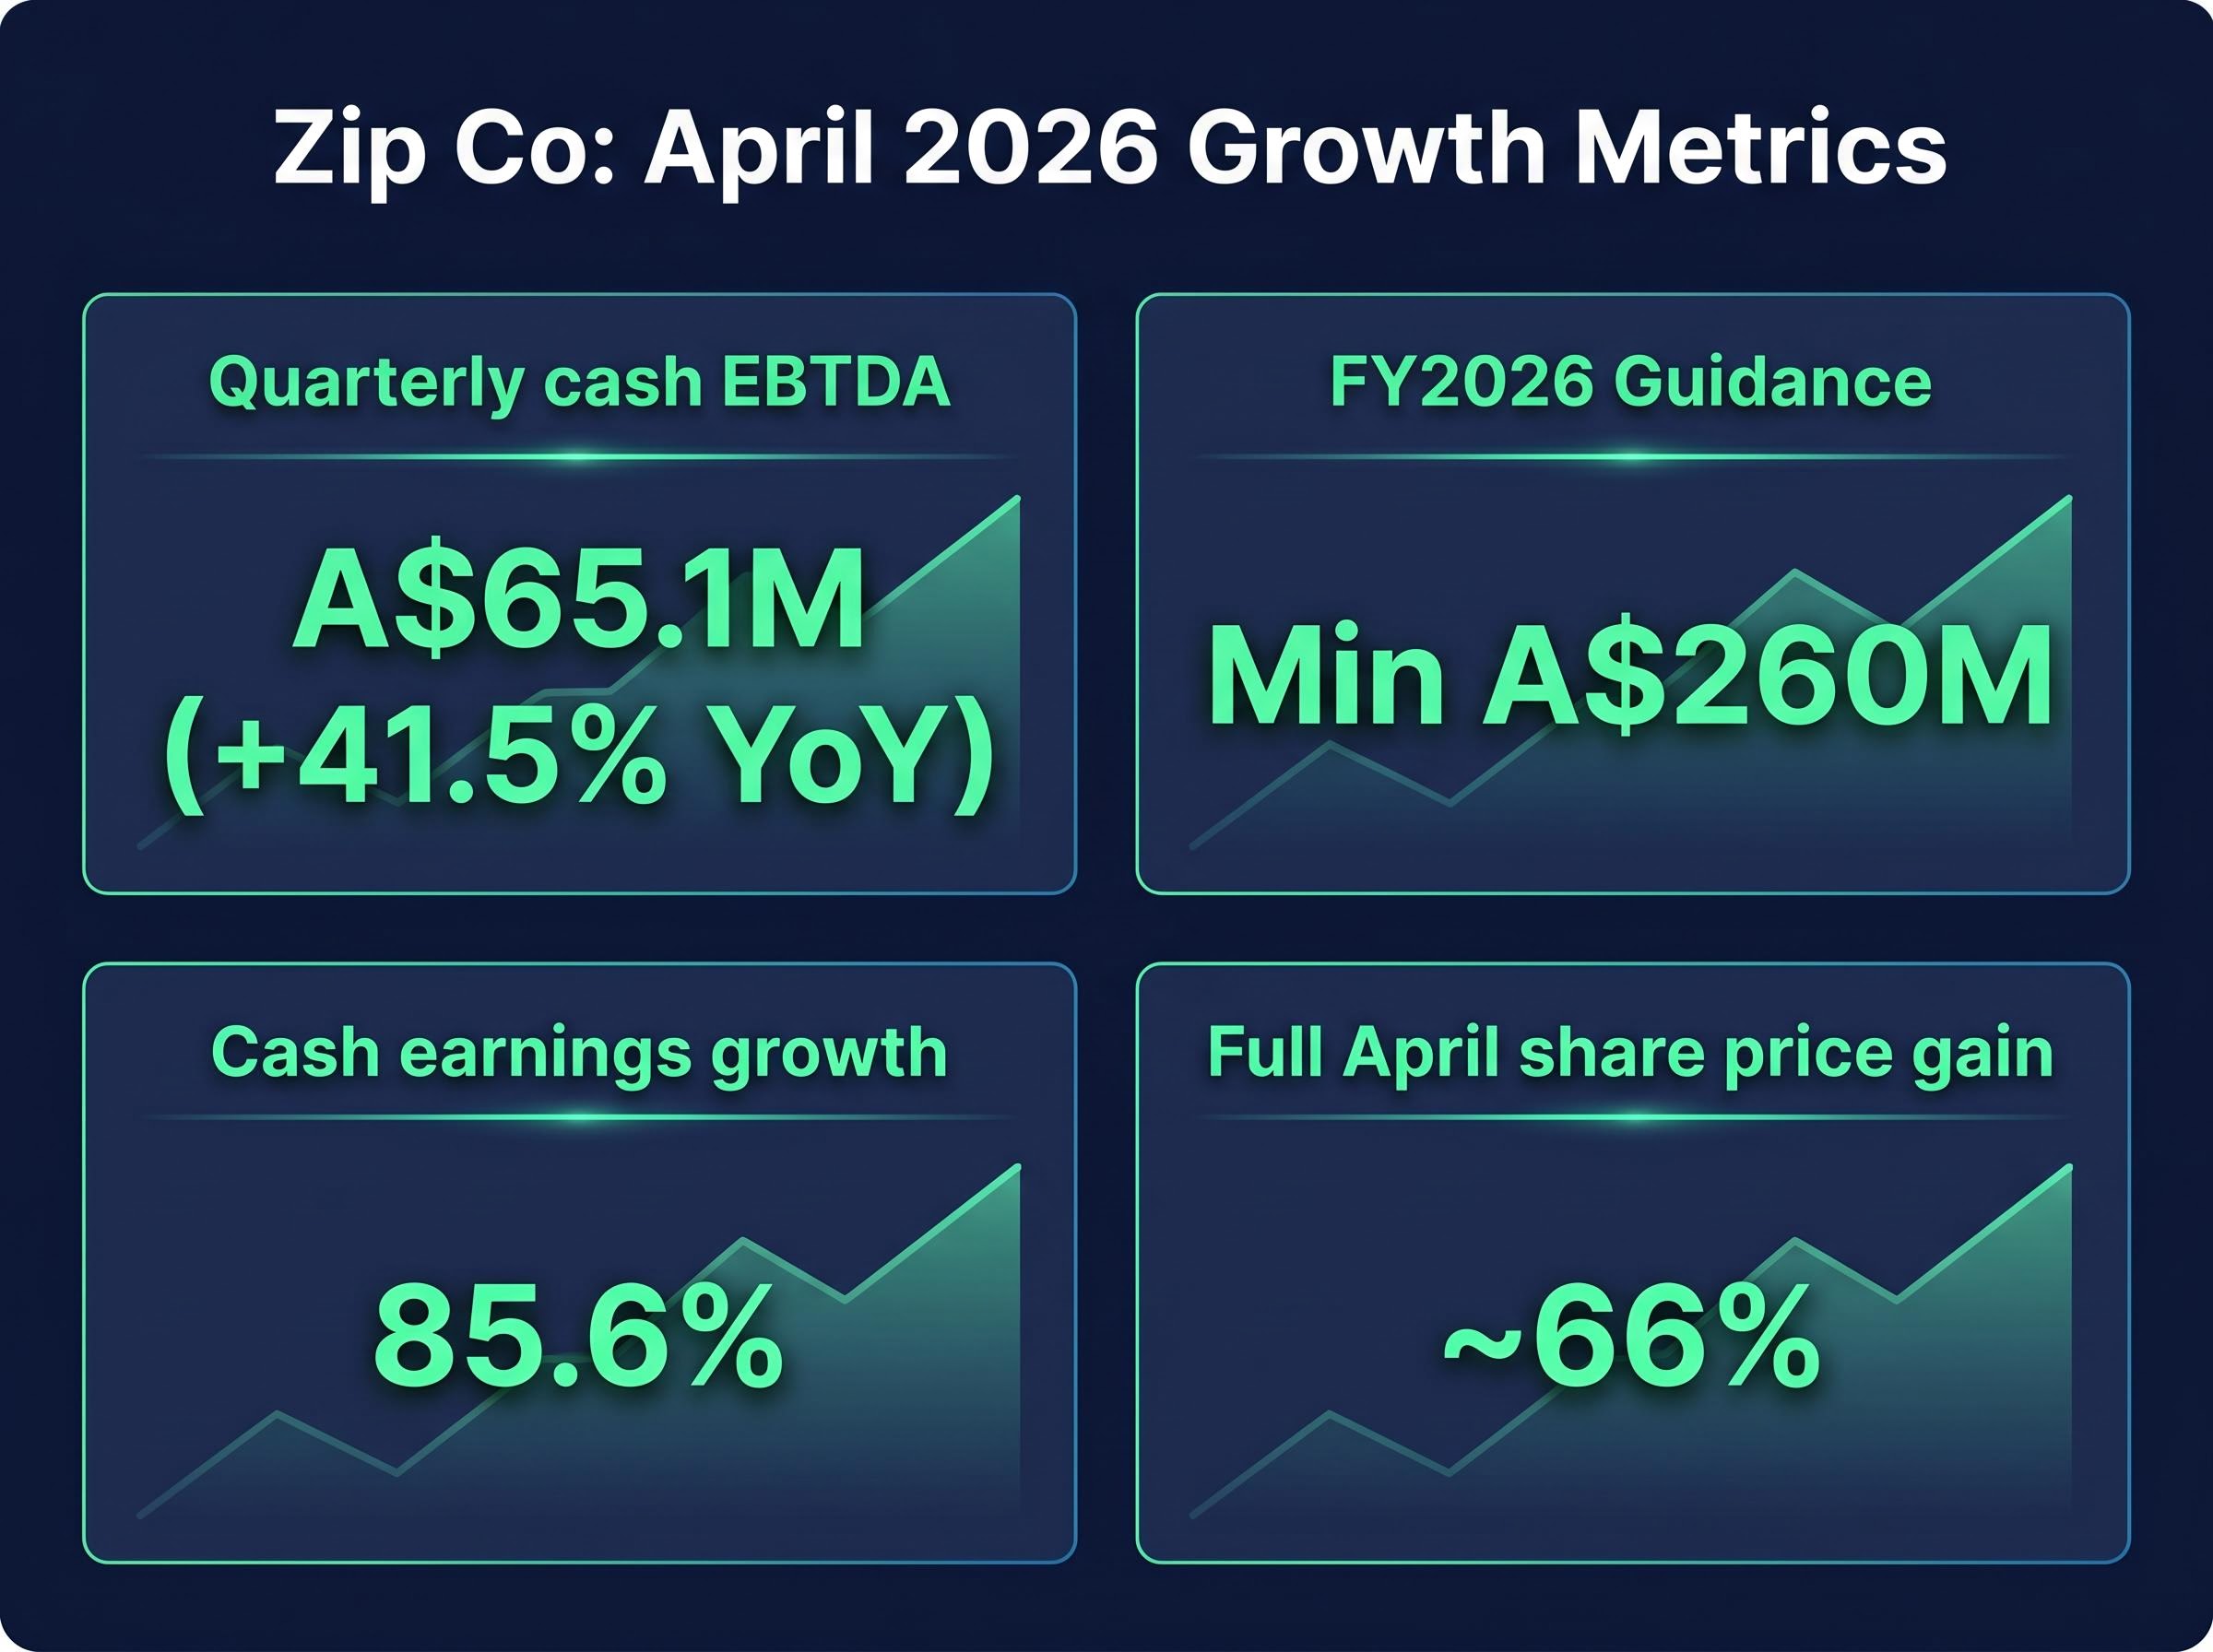
The standout figure: Cash earnings growth of 85.6% at this scale is qualitatively different from early-stage recovery metrics. It signals margin expansion, not just revenue growth.
The guidance upgrade deserves particular attention. Management revised full-year cash EBTDA to a minimum of A$260 million, a forward commitment that carries weight given how recently Zip Co was loss-making. This is not a backward-looking celebration. It is a statement about where the company expects to be when the full-year result lands.
The distinction matters for investors trying to separate signal from noise. A single strong quarter can be seasonal, or driven by one-off factors. A guidance upgrade alongside that quarter, backed by 85.6% cash earnings growth, shifts the conversation from “is the recovery real?” to “how far does it run?”
Zip Co’s guidance upgrade was explicitly tied to US growth acceleration. CEO and investor relations communications from 17 April 2026 cited the US segment as the primary driver, making it the swing factor in the investment case rather than the Australian legacy business.
The operational evidence supports the narrative. On 31 March 2026, Zip released an update on new US payment partner additions, broadening merchant network coverage and consumer access. Expanded shopping flexibility and partner variety are the mechanism by which Zip US grows transaction volume, and transaction volume is the leading indicator for future EBTDA improvement.
For Australian investors, the US segment’s trajectory determines whether the earnings upgrade represents a floor or a ceiling. If US growth is structural, driven by merchant network expansion and consumer adoption, then the current guidance may prove conservative. If it is cyclical or driven by short-term promotional spending, the earnings base becomes harder to sustain.
The current US focus did not happen by accident. In 2023, Zip executed strategic exits from non-core international markets, a decision that looked defensive at the time but has since proved to be the precondition for concentrated capital deployment into its strongest growth engine. The rationalisation of Zip’s geographic footprint is directly visible in the improved unit economics of the Q3 result. Fewer markets, lower overhead, sharper focus.
The buy now, pay later sector attracted enormous capital and competitive entry between 2020 and 2022. When interest rates rose and credit losses mounted, the sector suffered a severe derating. Weaker players exited, were absorbed, or scaled back. What remained was a thinner competitive field, and that thinning carries structural implications.
When competition contracts in a growing market, the remaining players benefit from conditions that are difficult to replicate through internal effort alone. The characteristics of a survivor premium scenario typically include:
Zip’s own 2023 market exits were a deliberate rationalisation, not a forced retreat. That distinction matters. The company chose to shed unprofitable geographies before the market forced the issue, positioning itself as a leaner operator rather than a casualty. Many investors had written off BNPL entirely as unviable, making the recovery a sentiment-reversal story layered on top of a genuine earnings story.
BNPL sector consolidation is progressing beyond the exit of weaker players: Credit Corp’s pursuit of Humm Group through formal due diligence represents the next phase of the cycle, where surviving operators and adjacent financial services businesses begin absorbing remaining assets, compressing the competitive field further and potentially concentrating transaction volume among fewer platforms.
Buy now, pay later operators earn revenue through three primary channels, each carrying distinct risk profiles. Understanding these mechanics clarifies why so many operators failed and why Zip’s current profitability is notable.
| Revenue Type | Source | Key Risk | Rate Sensitivity |
|---|---|---|---|
| Merchant fees | Percentage of transaction value charged to retailers | Merchant pushback as competition increases | Low (not directly rate-linked) |
| Account fees | Monthly or per-use fees charged to consumers | Consumer churn to free alternatives | Moderate (consumer spending sensitivity) |
| Late payment fees | Penalties for missed instalment payments | Regulatory caps and reputational risk | High (defaults rise with rate pressure) |
| Funding costs | Cost of capital used to fund consumer loans | Margin compression when rates rise | Very high (direct exposure to rate cycle) |
The structural tension at the heart of BNPL is straightforward: funding costs rise when interest rates rise, but the product often cannot pass those costs to consumers without losing them to credit cards or other alternatives. This is the dynamic that caused widespread BNPL distress in 2022-2023, as operators funded consumer loans at rising wholesale rates while merchant fees remained compressed by competition.
Cash EBTDA is the most relevant profitability metric for BNPL operators specifically because it captures the operating economics of the lending model before non-cash charges and tax structuring. Zip’s record A$65.1 million quarterly EBTDA therefore signals that the company is generating genuine cash profitability from its core operations, not just reporting accounting improvements.
The ASX fintech profitability inflection playing out at Zip is not an isolated event: MoneyMe reached positive Normalised NPAT for the first time in the same quarter, with net credit losses falling from 3.7% to 2.6% and risk-adjusted net interest margin expanding materially, suggesting the conditions that allowed Zip to generate record EBTDA are also benefiting other operators that survived the rate cycle.
By late April, ZIP had entered overbought territory according to technical commentary published on 22 April 2026 by thebull.com.au. The rapid approximately 66% monthly gain pushed the stock past the pace at which incremental news flow could justify continued momentum buying.
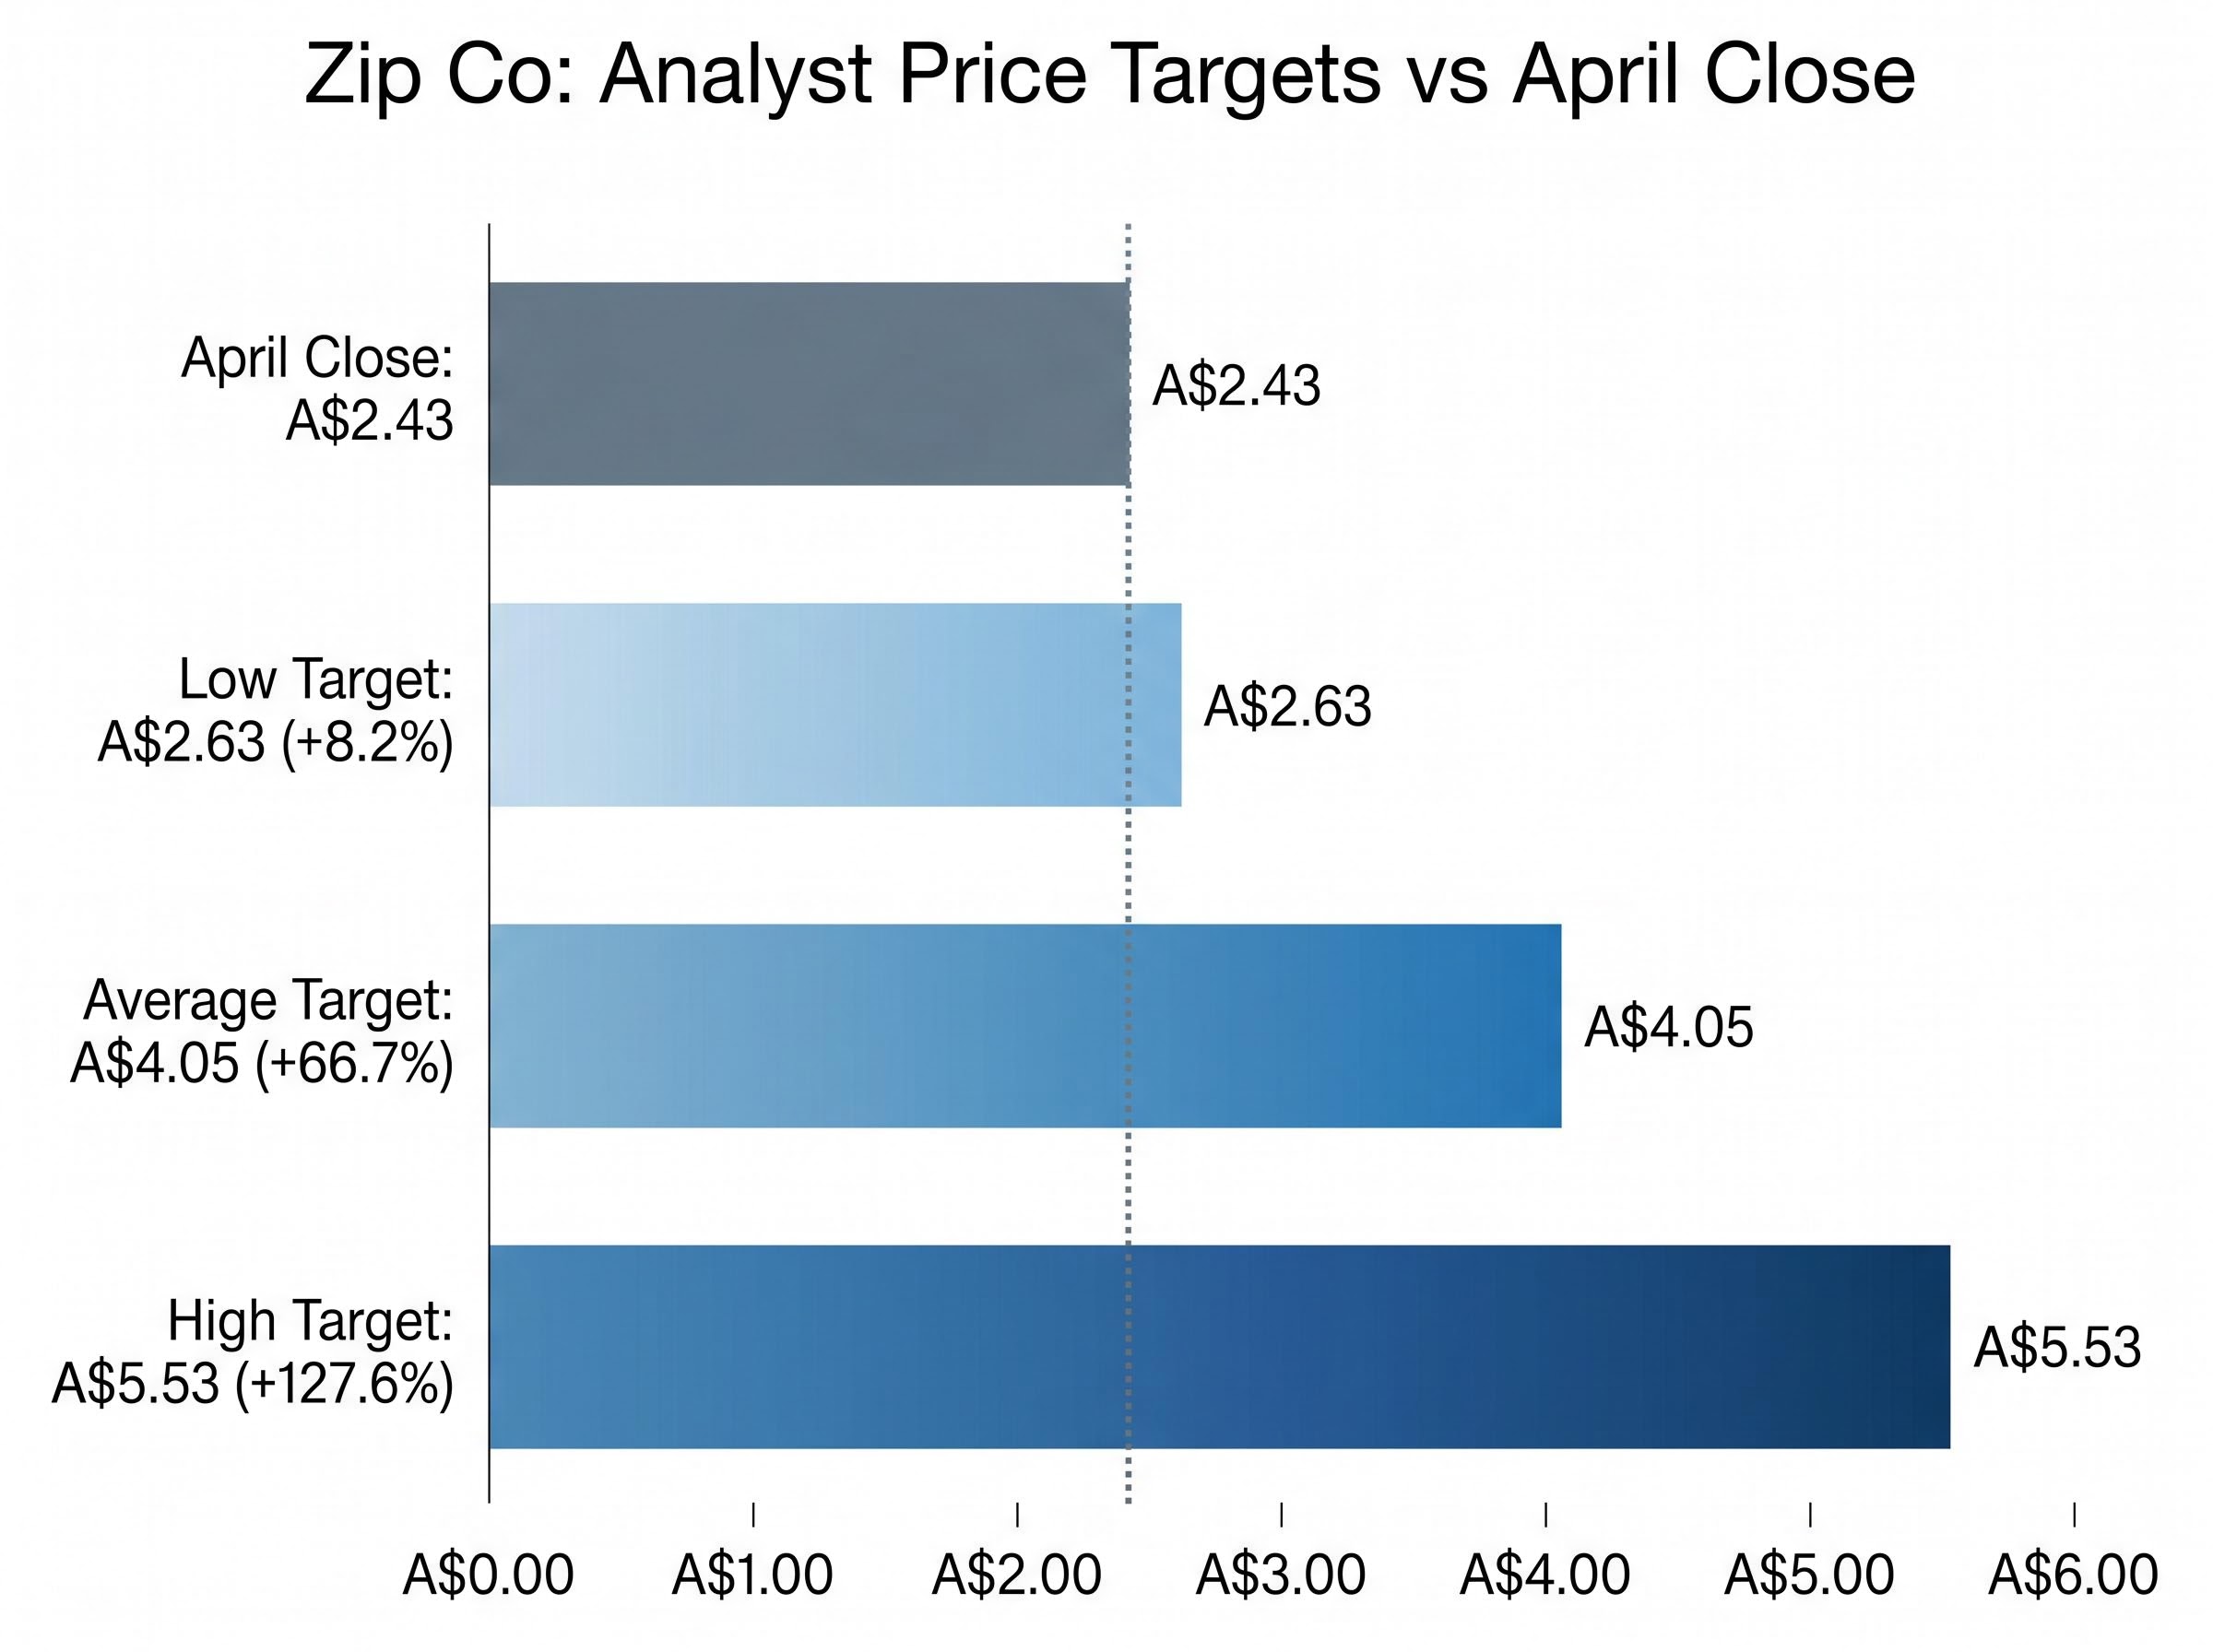
The fundamental case tells a different story. The average one-year analyst price target sits at A$4.05, according to Fintel.io, implying substantial upside from the A$2.43 April close.
| Scenario | Price Target | Implied Upside from A$2.43 |
|---|---|---|
| Low analyst target | A$2.63 | 8.2% |
| Average analyst target | A$4.05 | 66.7% |
| High analyst target | A$5.53 | 127.6% |
The spread matters as much as the average. A range of A$2.63 to A$5.53 reflects genuine disagreement about Zip’s growth trajectory, not a consensus on fair value.
The question “is it priced in?” requires specificity. The turnaround is real. The earnings inflection is confirmed. What the market is debating is whether the current price already discounts the best-case earnings path, or whether the base-case path still offers a margin of safety. The low-end target of A$2.63 sits only 8.2% above the April close, suggesting at least some analysts believe the rally has consumed most of the near-term upside. The high-end target of A$5.53 suggests others see a company still in the early innings of a structural re-rating.
This is not a tension that resolves neatly. Investors with a shorter time horizon face an overbought technical signal. Investors with a twelve-month view face an analyst consensus that implies significant further upside. The framework for choosing between them depends on the next catalyst, not on the last one.
A split analyst consensus with a wide price target range is not unique to Zip: ANZ’s 14-analyst coverage sits at 6 buy, 6 hold, and 4 sell at an identical moment in the rate cycle, with targets spanning A$26 to A$43, and the RBA’s May decision is the shared catalyst that will likely resolve near-term uncertainty for both ASX financials and fintech operators exposed to the same funding cost dynamics.
The widely cited thesis that BNPL operators benefit from falling interest rates rests on sound logic: lower funding costs improve unit economics, and investor appetite for growth equities increases when discount rates fall. For a company like Zip Co, whose profitability is directly sensitive to the cost of capital used to fund consumer loans, the rate environment is a material input.
The RBA cash rate target of 4.10% represents the benchmark against which BNPL operators price their wholesale funding arrangements, making the May 5 board decision a material event for Zip’s near-term unit economics.
The complication is that the rate environment may not cooperate. The RBA cash rate stands at 4.10% as of 2 May 2026. Market-implied pricing from the ASX RBA rate tracker suggests a potential hike to 4.35% at the 5 May 2026 meeting, with implied rates for July 2026 sitting at approximately 4.385%.
Australia’s March 2026 CPI reading of 4.6% year-on-year is nearly double the top of the RBA’s 2-3% target band, and while trimmed mean inflation held steadier at 3.3%, the headline acceleration has been sufficient to push market-implied rate hike probability well above 50% for the May meeting.
The two scenarios carry distinct implications:
Investors who anchor their ZIP thesis entirely on a rate-cut tailwind may be building on a macro assumption that the market itself is not yet pricing. That does not invalidate the earnings story, but it does mean the rate environment should be treated as an open question rather than a guaranteed tailwind.
The evidence supports a clear conclusion on one half of the question: Zip has demonstrably turned the corner on profitability. A approximately 66% April gain, A$65.1 million in quarterly EBTDA, and upgraded full-year guidance of A$260 million-plus are not ambiguous signals. The US growth engine is operational, the survivor premium is a legitimate structural thesis, and the company is generating cash earnings at a rate that separates it from the BNPL operators that did not survive the rate cycle.
The other half of the question remains genuinely open. The April rally compressed a significant amount of good news into a short window. Technical signals flag near-term caution. The macro backdrop, specifically the rate environment, is less certain than growth stock positioning would prefer. The analyst consensus target of A$4.05 implies further upside, but the spread from A$2.63 to A$5.53 reflects a market that has not converged on what Zip is worth.
The question investors should hold: What is the next catalyst that would justify buying at current prices rather than waiting? The most likely candidates are the full-year FY2026 result or further evidence of US growth acceleration. Until one of those arrives, the difference between a stock that has recovered and a stock that will compound from here remains unresolved.
This article is for informational purposes only and should not be considered financial advice. Investors should conduct their own research and consult with financial professionals before making investment decisions. Past performance does not guarantee future results. Financial projections are subject to market conditions and various risk factors.
Zip Co shares gained approximately 66% in April 2026 after the company reported record quarterly cash EBTDA of A$65.1 million and upgraded its full-year FY2026 guidance to a minimum of A$260 million, triggering a 24% single-session spike on 16 April 2026.
Cash EBTDA stands for earnings before tax, depreciation, and amortisation, and it is the most relevant profitability metric for BNPL operators because it captures the genuine operating economics of the lending model before non-cash charges and tax structuring.
The average one-year analyst price target for Zip Co sits at A$4.05, implying approximately 66.7% upside from the April 2026 closing price of A$2.43, though targets range from A$2.63 at the low end to A$5.53 at the high end.
Zip Co's profitability is directly sensitive to funding costs, so a potential RBA rate hike to 4.35% at the May 2026 meeting would compress BNPL margins, while a rate cut would improve unit economics and likely boost investor sentiment toward the stock.
According to the analysis, the most likely next catalysts are the full-year FY2026 result and further evidence of US growth acceleration, as the April rally has already compressed a significant amount of positive news into the current share price.