10 Approved Rivals, Yet S&P Global’s Moat Keeps Compounding
1 hr ago

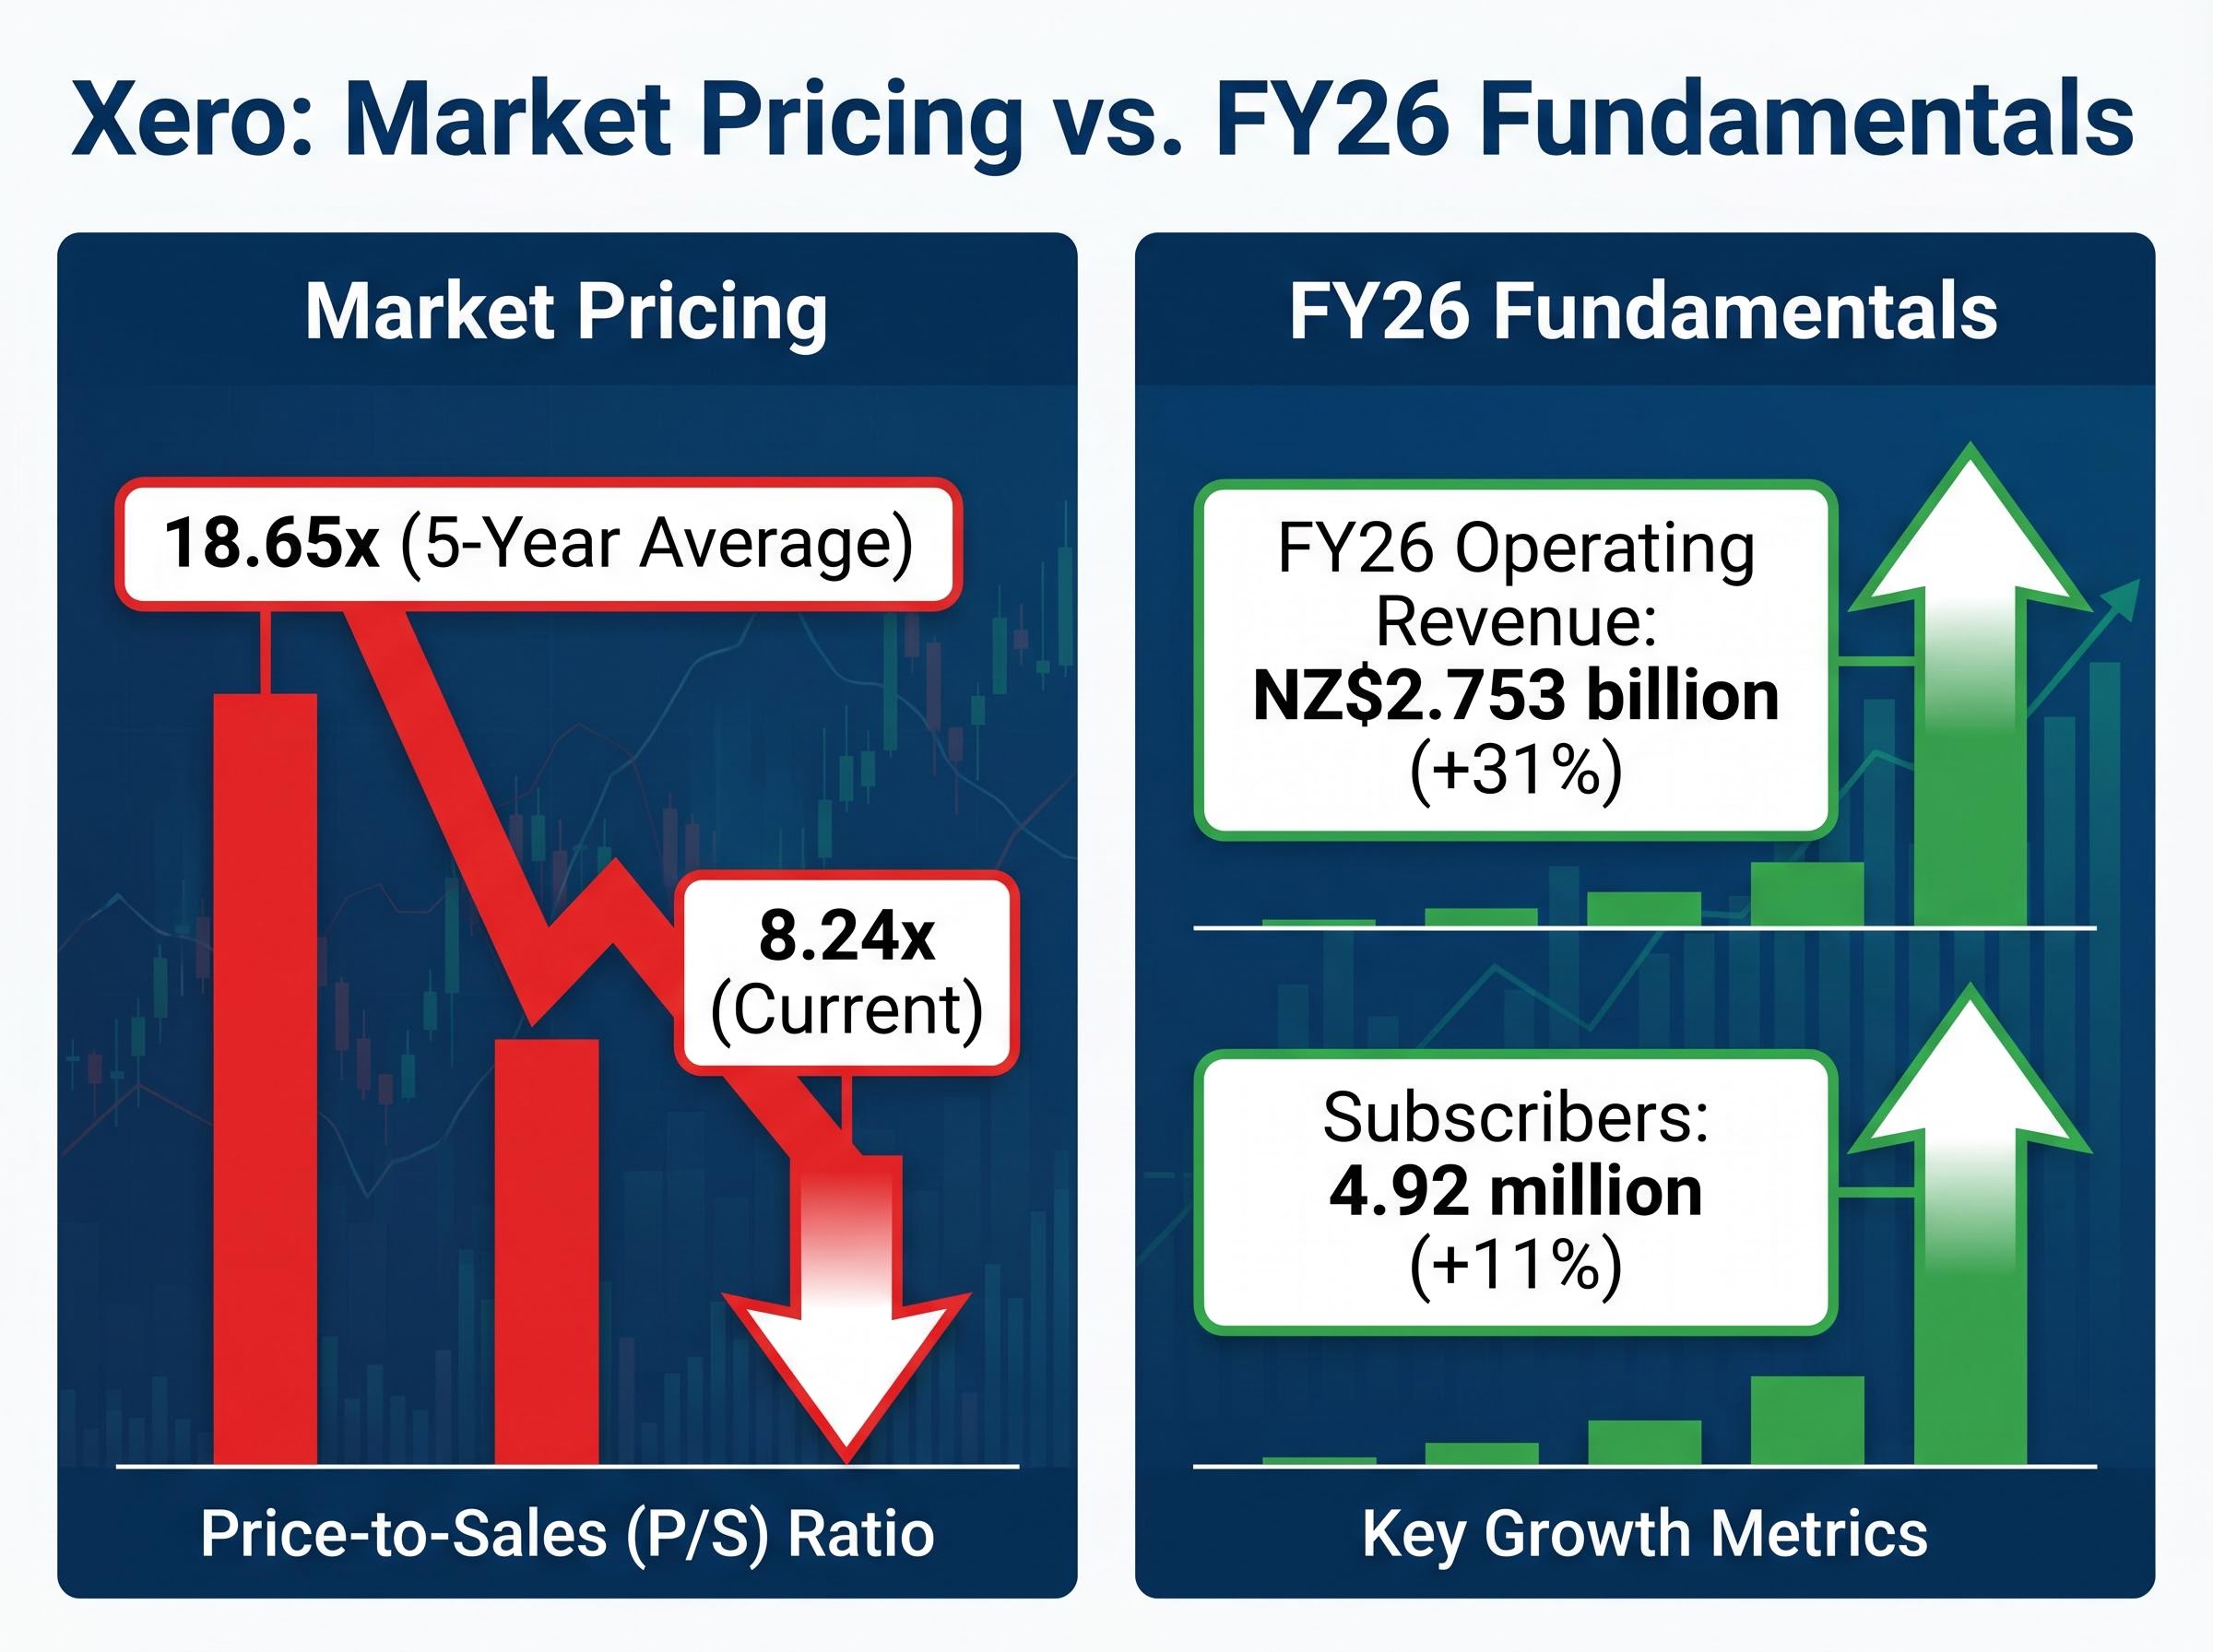
Xero’s share price has fallen roughly 32% since the start of 2025, and its price-to-sales ratio now sits at 8.24x, less than half its five-year historical average of 18.65x. For Australian investors scanning for beaten-down quality, those numbers demand attention.
A compressed multiple, however, is not the same as a margin of safety. The question worth asking is whether Xero has been mispriced by a nervous market, or rationally re-rated by one that has recalibrated what a cloud accounting business is worth in a higher-rate world. With FY26 full-year results now published (operating revenue of NZ$2.753 billion, up 31%), there is fresh data to test both interpretations.
What follows is a walk through the macro forces behind the de-rating, Xero’s current business fundamentals, and the valuation frameworks that move beyond a single ratio. The aim is to give readers a structured way to assess whether the price decline represents opportunity or fair correction.
The decline did not begin inside Xero’s business. It began in the bond market.
When interest rates rise, the present value of future cash flows falls. For long-duration growth stocks, companies whose value rests heavily on earnings expected years from now, that repricing is severe. The mechanism is straightforward: a dollar of profit in 2032 is worth less today when the discount rate used to value it has climbed from 3% to nearly 5%.
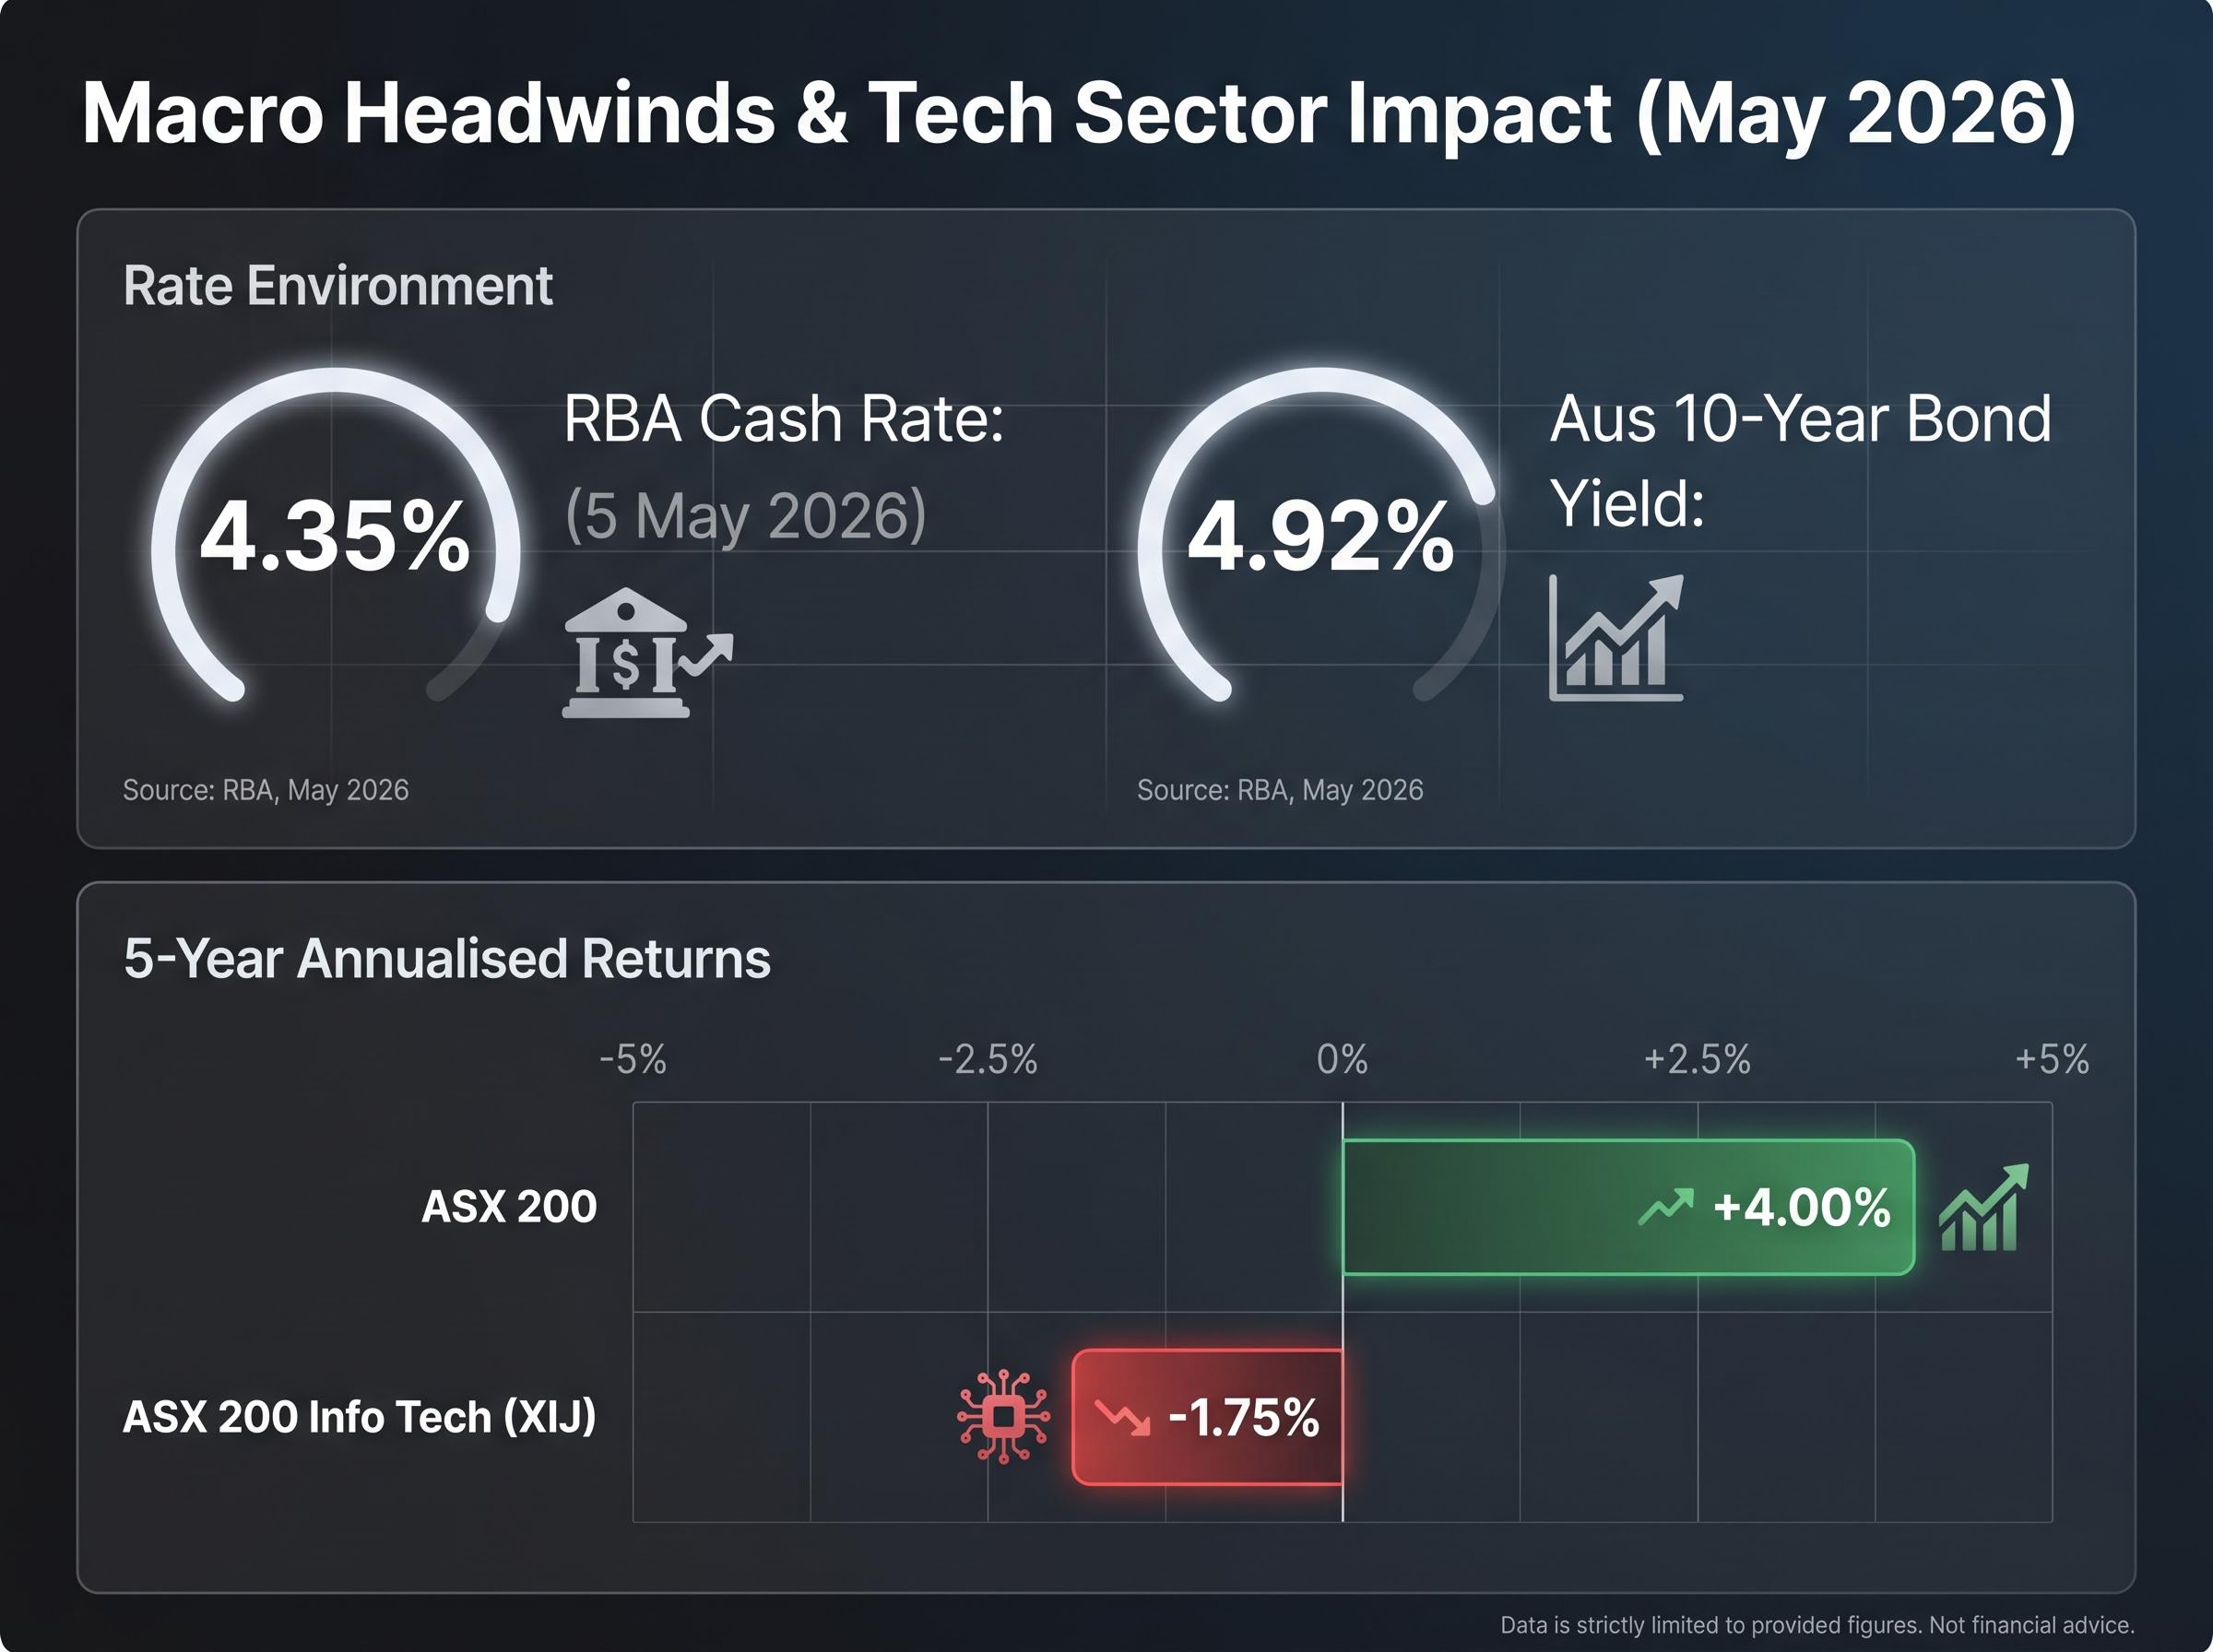
The specific rate environment pressing on Xero’s valuation includes the Reserve Bank of Australia (RBA) cash rate at 4.35% following the 5 May 2026 hike, and Australian 10-year government bond yields trading around 4.92% in late May 2026. Those are not abstract numbers. They are the discount rates baked into every institutional valuation model pricing ASX-listed growth equities.
The RBA’s May 2026 Statement on Monetary Policy confirmed the Board’s decision to lift the cash rate to 4.35%, citing persistent inflationary pressure and a cautious economic outlook, providing the direct institutional backdrop against which ASX-listed growth equities have been repriced.
Four macro forces converged to drive the compression:
The sector-wide damage is visible in the numbers. The ASX 200 Information Technology Index (XIJ) has delivered a five-year annualised return of -1.75%, against 4.00% for the broader ASX 200.
The compression Xero has experienced is not isolated: growth stock valuation discounts across the technology category reached levels seen less than 5% of the time since 2011, according to Morningstar data from March 2026, with names including Nvidia, Meta, and Microsoft all repricing sharply as the same higher-rate mechanics that pressed on Xero worked across the sector.
Xero’s 52-week range: A$67.93 to A$196.52. That spread captures the full force of the de-rating, from 2024 peak optimism to 2026 compression.
Understanding this macro context matters. It prevents investors from misreading a market-driven de-rating as evidence of business failure, and it frames the follow-up question: is the re-rating permanent, or cyclical?
The share price tells one story. The operating metrics tell a different one.
Xero’s FY26 full-year results, released in May 2026, showed a business that accelerated while its share price declined. Operating revenue reached NZ$2.753 billion, up 31% on a reported basis and 28% in constant-currency terms, stripping out exchange-rate distortion. Subscribers grew 11% year-on-year to 4.92 million, and annualised monthly recurring revenue (AMRR) hit NZ$3.273 billion, up 37% reported and 25% on an organic basis.
Average revenue per customer climbed 23% to NZ$55.44, a signal that Xero is extracting more value from its existing base through pricing power and product expansion, not merely adding lower-value accounts.
| Metric | FY26 Result | Year-on-Year Change |
|---|---|---|
| Operating Revenue | NZ$2.753 billion | +31% reported (+28% constant currency) |
| Subscribers | 4.92 million | +11% |
| Gross Margin | 88.20% | — |
| Operating Margin | 15.10% | — |
Gross margin of 88.20% places Xero among the highest-margin software businesses listed on the ASX. Operating margin reached 15.10%, reflecting improving cost discipline as revenue scales.
The gross margin contraction from 89% to 83.9% represents the largest single-year compression in Xero’s listed history and is directly attributable to the lower-margin economics of integrating Melio’s payments infrastructure, a detail that sits beneath the headline 88.20% figure reported across the full-year results and that bears on whether the current operating margin of 15.10% is a sustainable floor or a transitional low.
The Rule of 40, a SaaS-specific benchmark that adds revenue growth to profit margin (companies scoring above 40 are generally considered to have a healthy balance of growth and profitability), came in at 44.5%. That score suggests the business is not sacrificing profitability for growth, or growth for profitability, at the current stage.
At a share price of A$75.84 (as of 22 May 2026) and a market capitalisation of approximately A$13.16 billion, the gap between operational momentum and market pricing is the productive tension this analysis sets out to resolve.
The price-to-sales (P/S) ratio divides a company’s market capitalisation by its annual revenue. It is commonly applied to high-growth software businesses that may not yet show large net profits, because it offers a way to compare valuations when earnings-based ratios are unreliable or negative.
Xero’s current P/S of 8.24x sits well below its five-year historical average of 18.65x.
That represents a 55.8% compression from the historical average, a figure that looks like a screaming discount on its face.
The problem is that P/S does not account for the cost of capital. In a low-rate world, investors could pay a high multiple for future revenue because the discount rate used to value those revenues was minimal. In a higher-rate world, the same revenue stream is worth less in present-value terms, and the P/S multiple a rational investor should be willing to pay falls accordingly, even if the company’s growth rate has not changed.
The mechanics work in three steps:
This distinction matters: a stock can be cheaper than its own history and still not be cheap in absolute terms. Multiple compression does not equal fundamental deterioration, but neither does it automatically equal a buying opportunity. The next step is to look at how analysts are modelling the business itself, and why their conclusions diverge.
The broker consensus on Xero leans constructive. Most ratings are Buy or Overweight. The price targets, however, tell a more complicated story.
| Analyst / Firm | Price Target | Implied Stance |
|---|---|---|
| UBS | ~A$127 | Moderate upside, rate-cautious |
| Macquarie | ~A$223+ | Strong upside, growth-confident |
| Morningstar | Cautious | Still expensive relative to own history |
A spread of nearly A$100 between UBS and Macquarie is not a disagreement about last quarter’s results. Both firms can see the same FY26 numbers. The divergence sits in discounted cash flow (DCF) assumptions: specifically, what growth rate each analyst assigns to Xero’s free cash flows over the next decade, and what discount rate they apply.
DCF analysis (which estimates what a business is worth by projecting its future cash flows and discounting them back to today’s value at an appropriate rate) has gained favour over P/S in the current environment precisely because it forces analysts to make their rate assumptions explicit. A DCF model using a 10% discount rate will produce a materially higher valuation than one using 12%, even if every other input is identical.
The single largest source of uncertainty sits with the Melio acquisition, completed in June 2025 for an initial US$2.5 billion in cash and stock, with up to US$500 million in contingent payments.
Melio accelerates Xero’s US payments and accounts-payable capabilities. The strategic rationale is sound: embedded payments represent a large addressable revenue pool, and the US market remains Xero’s most underpenetrated geography.
The risk is execution and timing. Melio is expected to reach EBITDA break-even on a run-rate basis in H2 2028, more than two years away. Until then, the acquisition weighs on near-term free cash flow and introduces integration complexity at scale. The smaller Syft Analytics acquisition (US$70 million, September 2024) provides a lower-risk parallel integration, but Melio is a different order of magnitude.
An investor’s view on whether the current price is attractive depends heavily on whether they believe the Melio integration timeline holds.
Investors wanting to track the specific metrics that will confirm or challenge the H2 2028 breakeven thesis will find our dedicated guide to Xero’s Melio integration milestones covers the enhanced US disclosure framework, Melio’s expected revenue synergies, and the AI adoption signals (including the 61% increase in JAX engagement over three months) that management has nominated as the leading indicators of integration progress.
The analytical framework covered across the preceding sections converts into five concrete questions worth answering before making a position decision:
The consensus leans constructive, with most brokers rating Xero as a Buy. But Buy ratings alongside a target range spanning A$139 to A$188 limit the signal value of the rating alone. The range itself is the signal: it says the valuation question is open.
For investors wanting to stress-test the rate outlook assumption in their DCF models, our full explainer on the RBA’s divergence from global peers examines why Australia’s central bank is the most aggressive in the developed world at present, with a rate gap of up to 235 basis points relative to the Fed, ECB, and Bank of England, and identifies the trimmed mean CPI and M3 money supply signals that would confirm whether further hikes are warranted or whether the tightening cycle is approaching its peak.
The distinction that matters most: “Is Xero a good business?” is a different question from “Is Xero a good buy at A$75.84?” The FY26 numbers answer the first. The second requires assumptions about rates, Melio, and growth durability that each investor must form independently.
Xero’s P/S compression from 18.65x to 8.24x is real, and the business underneath is operationally healthy by every standard metric: 88% gross margins, a Rule of 40 score above the benchmark, 31% revenue growth, and nearly 5 million subscribers.
That combination, falling price and rising fundamentals, is precisely what makes the stock attractive to growth-oriented investors. The analyst consensus, spanning A$139 to A$188 against a current price of A$75.84 (as of 22 May 2026), implies substantial upside if the constructive case proves correct.
The qualification is equally real. Morningstar’s more cautious read and the width of the target range both point to genuine uncertainty in the valuation inputs. The Melio acquisition introduces a US$2.5 billion variable that will not resolve until H2 2028 at the earliest. And the discount rate environment, the single largest mechanical driver of the de-rating, remains elevated with no confirmed easing timeline.
The question is not whether Xero is a quality company. The question is whether the current price adequately compensates for the Melio integration risk and the rate sensitivity of a long-duration growth profile.
For Australian investors, the answer depends less on the headline P/S figure and more on the DCF assumptions and integration milestones this analysis has flagged. The numbers make Xero worth analysing seriously. They do not resolve the analysis for the investor.
This article is for informational purposes only and should not be considered financial advice. Investors should conduct their own research and consult with financial professionals before making investment decisions. Past performance does not guarantee future results. Financial projections are subject to market conditions and various risk factors.
A price-to-sales ratio divides a company's market capitalisation by its annual revenue, giving investors a way to compare valuations when earnings-based ratios are unreliable. Xero's current P/S of 8.24x sits well below its five-year historical average of 18.65x, representing a 55.8% compression that reflects both macro rate pressures and investor sentiment shifts rather than deteriorating business fundamentals.
Xero's share price decline of roughly 32% since the start of 2025 was primarily driven by macro forces including the RBA's tightening cycle lifting the cash rate to 4.35%, rising Australian 10-year bond yields near 4.92%, and a broad risk-off rotation away from high-multiple growth stocks, rather than any deterioration in Xero's own business performance.
Xero's FY26 full-year results showed operating revenue of NZ$2.753 billion, up 31% year-on-year, with subscribers reaching 4.92 million, gross margins of 88.20%, an operating margin of 15.10%, and a Rule of 40 score of 44.5%, all indicating a business that accelerated operationally while its share price declined.
Xero acquired Melio in June 2025 for an initial US$2.5 billion in cash and stock, plus up to US$500 million in contingent payments, to accelerate its US payments and accounts-payable capabilities. Melio is not expected to reach EBITDA break-even until H2 2028, which weighs on near-term free cash flow and is a key source of uncertainty in analyst price target spreads.
Rising interest rates increase the discount rate applied to future cash flows, reducing the present value of revenue expected in later years and compressing the price-to-sales multiple that rational investors are willing to pay, even if a company's growth rate has not changed. For long-duration growth stocks like Xero, this mechanical repricing can be severe, as demonstrated by the ASX 200 Information Technology Index delivering a five-year annualised return of -1.75%.