Oil prices have fallen for three straight sessions even as Houthi missiles struck Saudi infrastructure, US-Iran tensions escalated toward the seventh month of open conflict, and daily vessel transits through the Strait of Hormuz dropped to a quarter of their historical average.
That contradiction sits at the centre of the crude market right now. WTI crude has shed roughly 5% across three sessions in mid-September 2026, settling near $71.50 per barrel on 18 September 2026 with an intraday low around $68.50/bbl. Goldman Sachs and JPMorgan project further softening toward $66-70/bbl.
Yet the same market carries a live warning label. The World Bank cautions that a single infrastructure shock could push Brent to $95/bbl, and Bank of America’s tail-risk scenario reaches $150/bbl.
So the reader is standing inside a market pulling hard in two directions at once: bearish fundamentals dragging prices down, structural conflict risk holding a floor beneath them.
Here is what the data actually tells you about why crude is falling during active conflict, what is keeping a floor under it, and which specific conditions would need to change for the balance to flip.
What is actually driving WTI lower right now
Start with the arithmetic, because that is where the answer lives. The world’s largest oil desks are converging on the same conclusion: 2026 is shaping up as a surplus year, and surplus years pull prices down regardless of the headlines.
Goldman Sachs projects the market will tip into an oversupply of 1.5-2 million b/d in 2026, with visible global stocks rising and average prices drifting toward $66/bbl for WTI. JPMorgan and Macquarie sit close behind. The forecasts differ in degree, not direction.
The WTI backwardation spread, currently running at roughly $34 between spot and the one-year forward contract, is the market’s own quantified estimate of how much of today’s crude price is fear premium rather than physical supply-and-demand reality.
| Institution | Brent Target | WTI Target | 2026 Surplus Estimate |
|---|---|---|---|
| Goldman Sachs | ~$70/bbl | ~$66/bbl | 1.5-2 million b/d |
| JPMorgan | ~$72/bbl | ~$68/bbl | Oversupply expected |
| Macquarie | ~$74/bbl | ~$70/bbl | Oversupply expected |
The second force is rerouting, and it has held up far better than the market feared. According to the International Energy Agency (IEA), alternative export routes through Saudi Arabia’s Red Sea ports, the UAE’s Fujairah, and Iraq’s Ceyhan pipeline ramped up to move around 7 million b/d, against less than 4 million b/d before the crisis.
That resilience matters more than any single missile strike. When barrels keep flowing through the back door, a disruption at the front door stops translating into a price spike.
The third force is demand. Concerns over inflation and softening global growth are suppressing consumption expectations, and that pressure compounds the supply glut rather than offsetting it.
The clearest illustration came earlier in the conflict.
On 9 July 2026, oil prices fell approximately 2% on the same day US forces struck Iran. Economic weakness explicitly outweighed supply concern in the market’s calculus.
That single session tells you something precise about how this market processes news. Once the conflict is already priced in, a fresh geopolitical event stops being new information. The supply-demand arithmetic simply reasserts itself.
For anyone trading or holding energy positions on headlines alone, that is the essential correction. Rerouting resilience and surplus forecasts are now doing more of the price work than the news flow, and a model built on conflict headlines is a model missing its heaviest variable.
When big ASX news breaks, our subscribers know first
Why geopolitical risk has not disappeared, it has just been capped
None of this means the risk is gone. It means the risk has a ceiling and a floor, and the floor is structural. To see why, look at the one chokepoint that has no adequate workaround.
Approximately 20 million b/d of crude and petroleum products normally transit the Strait of Hormuz. The bypass infrastructure, the pipelines that can move Gulf oil around the strait entirely, can handle only 3.5-5.5 million b/d. That is between 17% and 27% of normal throughput.
A chokepoint you can only partially route around is not a manageable risk. It is an unhedgeable one. That is why the geopolitical floor beneath prices is built on structure, not sentiment, and why it does not soften just because the surplus data looks bearish.
The transit numbers make the strain concrete rather than abstract:
- 18 September 2026: four commodity vessels transited Hormuz, against a 10-day average of approximately 16
- 11 September 2026: seven vessels transited, against an average of approximately 15
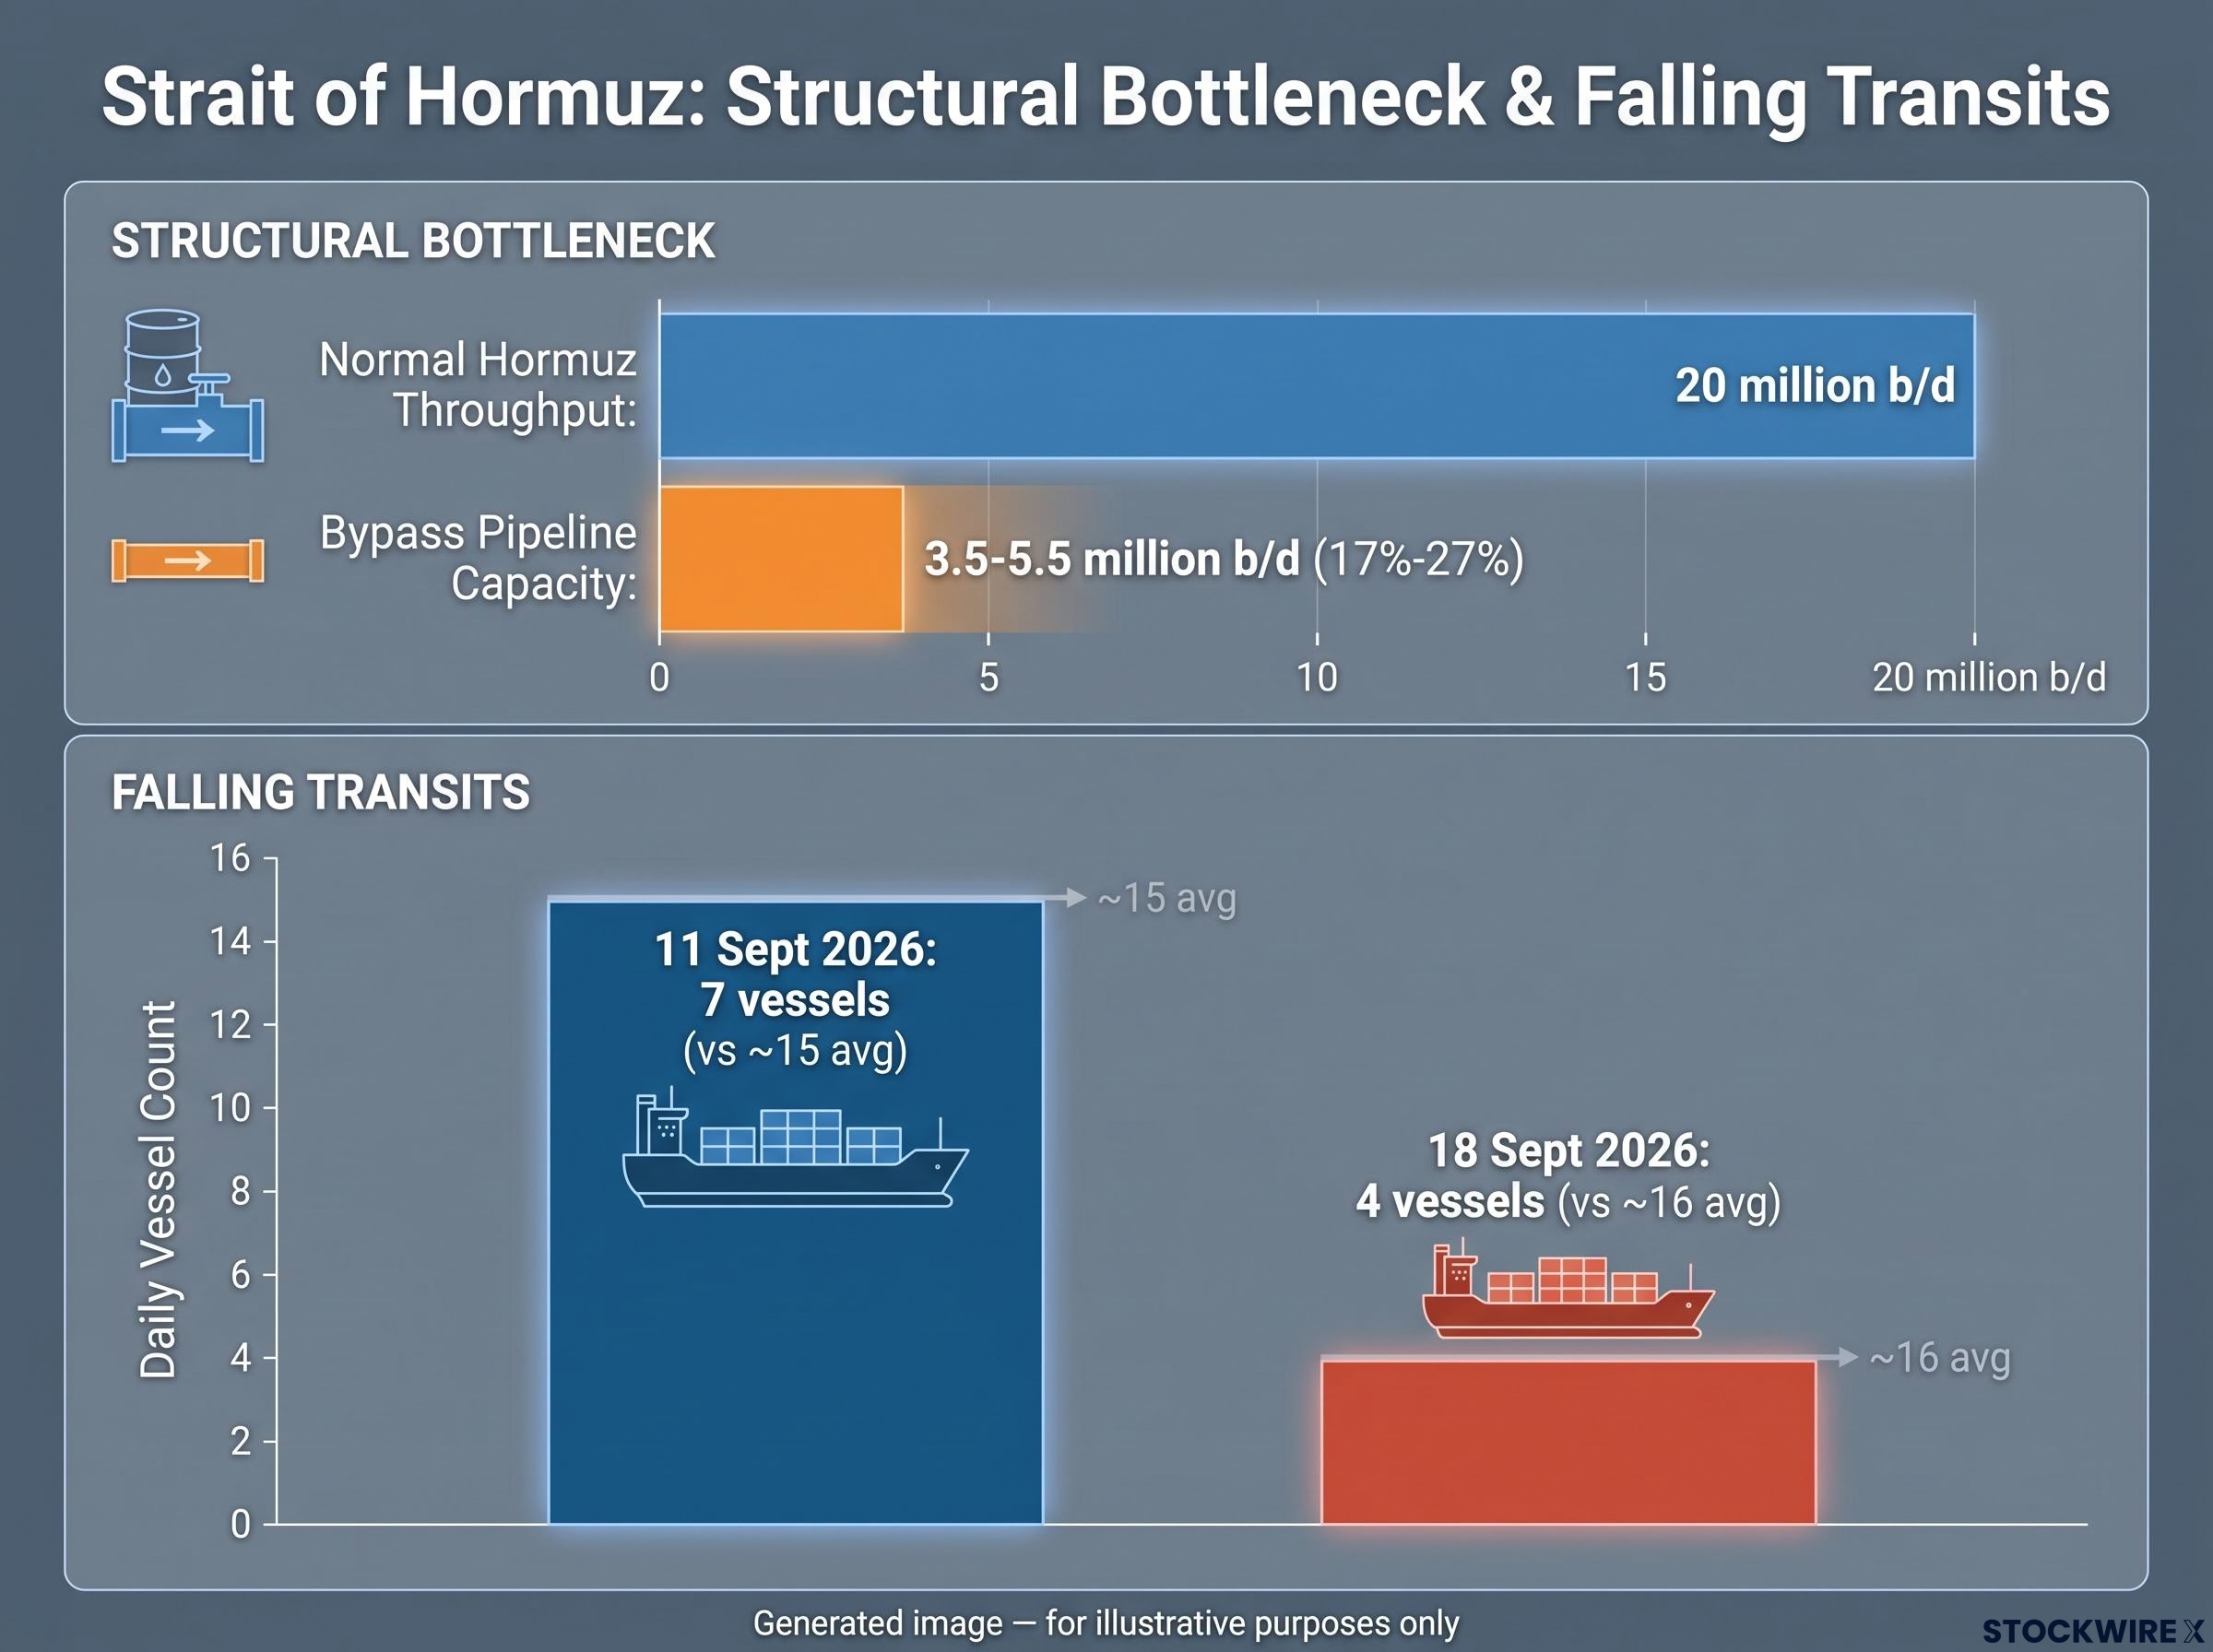
That data gives you a live indicator worth watching. When daily crossings recover toward the historical average, the floor softens. When they fall further, the upside tail risk grows. It is one of the few variables in this market that updates in near real time.
Saudi export volumes and the supply floor beneath the floor
Beneath the Hormuz story sits a second constraint. Houthi strikes on Saudi infrastructure, including the East-West pipeline and loading operations at Yanbu, have already suppressed the kingdom’s output.
The IEA’s 11 September 2026 report stated Saudi crude supply fell to 6 million b/d in August, the lowest level in more than three decades. Maritime analytics firm Kpler put Saudi crude exports at roughly 3.2 million b/d for the month, which it described as the lowest in 13 years.
The Saudi pipeline outage crystallises why the IEA’s 6 million b/d figure for August is structurally different from earlier production cuts: the East-West pipeline has been offline since 10 September 2026, and recovery depends on a geopolitical settlement rather than engineering, removing the fast-repair precedent set by the 2019 Abqaiq attack.
Both figures sit well below the pre-conflict norm of around 7 million b/d. That is a serious loss of physical barrels.
And yet prices have fallen. That apparent contradiction is precisely the point: rerouting has partially compensated for the Saudi shortfall, which is why the market drifted lower rather than spiking. The open question, the one that determines everything from here, is whether that rerouting capacity can absorb the next disruption on top of this one.
What history says about oil prices and active conflict
If the current pattern feels counterintuitive, history suggests it is anything but unusual. Prices falling during active conflict has happened before, more than once, and the mechanism tends to repeat.
Consider two cases side by side:
- The 1990-91 Gulf War. World oil supplies fell by over 4 million b/d, a far larger loss than anything the current conflict has produced. Prices initially climbed into the $30-40/bbl range, then dropped below their pre-war level to roughly $20/bbl. Saudi Arabia raised production to cover the gap, strategic reserves were released, and winter demand faded. The Gulf War I risk premium of $15-20/bbl unwound entirely within three to six months.
- The 1980s Iran-Iraq War. Prices rose about $3/bbl at the outset, then began declining through 1981. Global recession, energy conservation, and expanding non-OPEC supply steadily offset the conflict premium.
Neither case was an anomaly. A 2026 study of the broader record puts the pattern in stark terms.
A study of 20 major geopolitical conflicts since 1980 found that only three produced oil-price impacts lasting longer than two years. War premiums typically unwind within 6 to 18 months.
IJFMR geopolitical conflict research published in May 2026 examines how war-driven supply disruptions create short-term oil price volatility that structural market forces subsequently absorb, lending academic weight to the pattern the Gulf War and Iran-Iraq cases illustrate.
The lesson is not that geopolitical risk is irrelevant. It is that the premium tends to be a borrowing of future price rather than a permanent addition to it. The market pays now and claws it back later as supply adapts, reserves deploy, and demand adjusts.
For an investor, that reframes the whole question. The mistake to avoid is treating a conflict-driven spike as a new price regime. History gives you a realistic time horizon instead: measured in months, not years, and reversible once the physical market rebalances.
The conditions that could rapidly reverse the current downtrend
The historical pattern holds until it doesn’t, and the exceptions matter. What follows are not predictions. They are the specific triggers that could overwhelm the surplus dynamic, ranked by how forcefully each would move the market. These are the variables worth monitoring.
- Fresh damage to Saudi export infrastructure. The East-West pipeline and Yanbu loading operations are the named vulnerabilities. A previous significant attack on the pipeline pushed Brent to around $108-109/bbl and WTI above $100/bbl. With that infrastructure already degraded, any new strike lands on a weakened base.
- A prolonged Hormuz closure beyond bypass capacity. Goldman Sachs views persistent Hormuz disruptions as a catalyst for $100-120/bbl Brent, with a worst-case chokepoint closure capable of spiking prices beyond $135/bbl. This is the scenario the transit counts are quietly tracking.
- A coordinated OPEC+ production cut. Attacks and the Iran blockade have already trimmed OPEC+ output by roughly 1.8 million b/d to 38.8 million b/d. A deliberate, coordinated cut on top of that involuntary loss could abruptly reverse the downtrend.
OPEC pricing power has been structurally eroding for years, and the UAE’s formal exit on 1 May 2026 reduced the cartel’s coordinated share of global supply to roughly 27-28%, which means a deliberate OPEC+ cut would need to be unusually large to offset a surplus already running at 1.5-2 million b/d.
- A dual-chokepoint stress event. Simultaneous disruption at both Hormuz and the Bab el-Mandeb strait is the tail-risk case, capable of spiralling global shipping costs well beyond a simple crude spike.
Now hold two numbers together. Goldman’s base case sits at $66/bbl WTI. Bank of America’s tail risk reaches $150/bbl Brent, with the World Bank warning of $95/bbl on severe infrastructure damage.
That enormous gap is not analytical sloppiness. It is the precise size of the uncertainty you are navigating, and the practical value here is knowing what moves you from one end of it to the other.
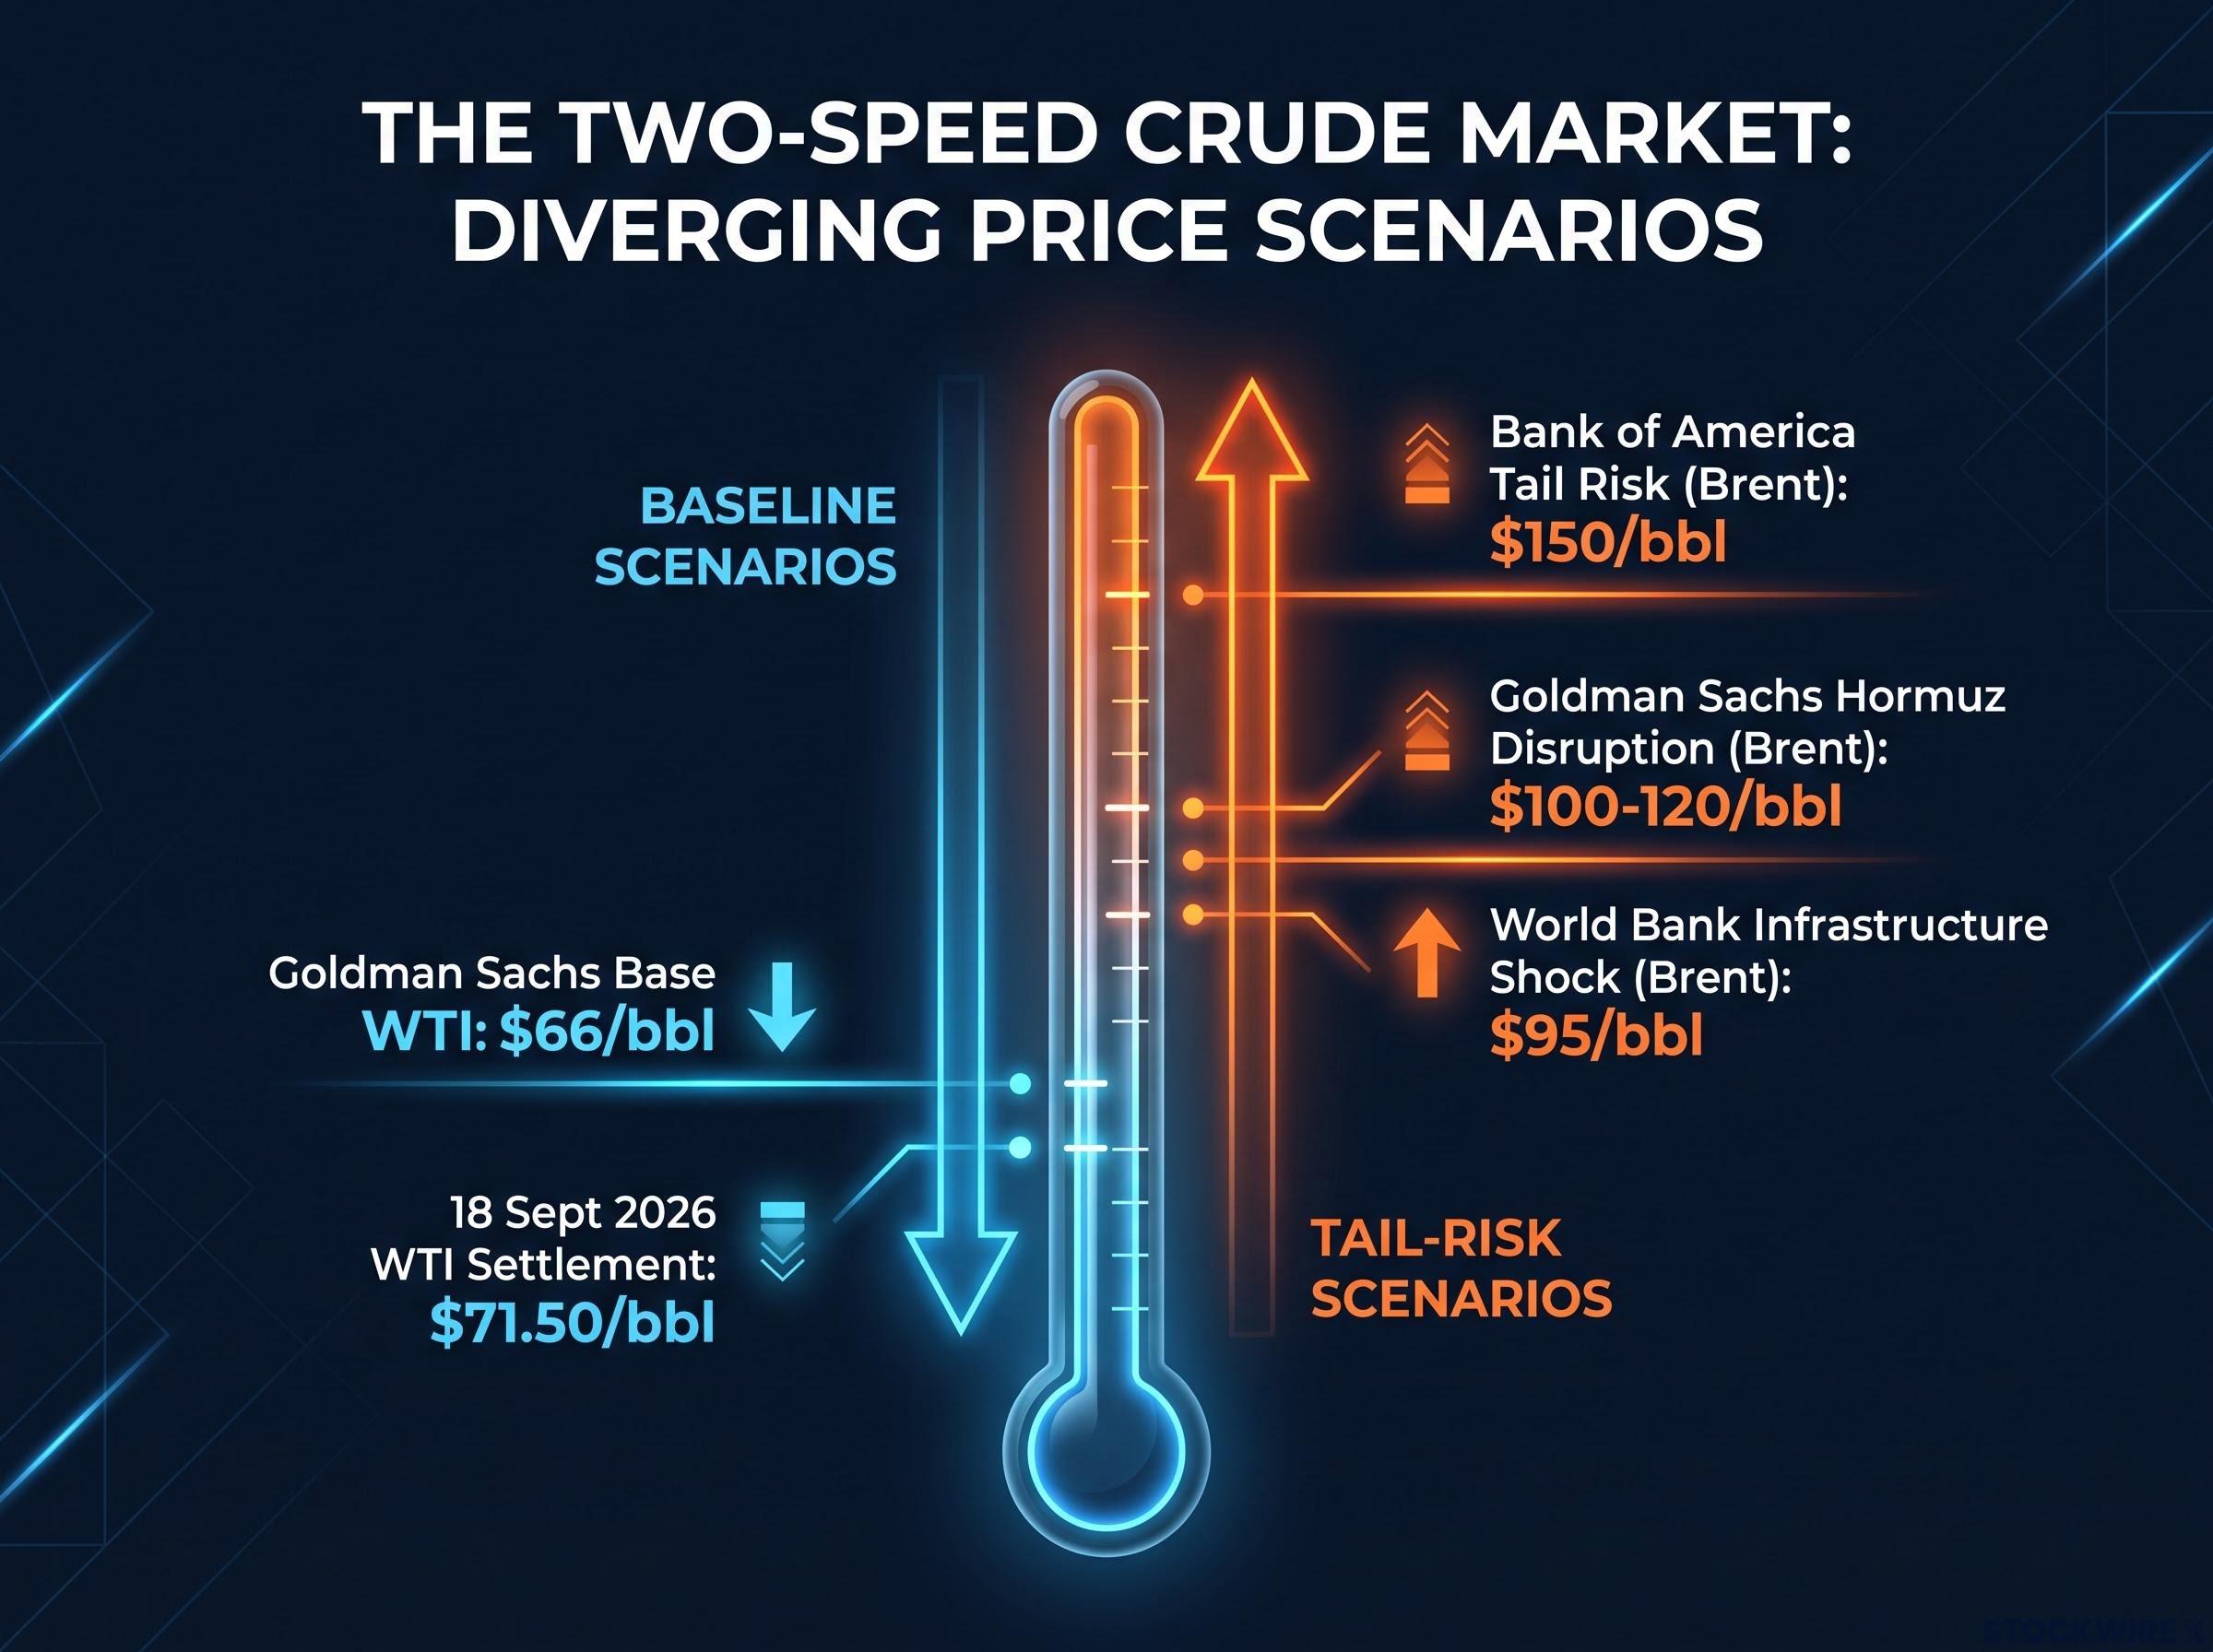
The leading indicators are specific and observable: the physical integrity of Saudi export infrastructure, the daily Hormuz vessel counts, and any shift in OPEC+ language on deliberate cuts. Those three variables, not a single price target, are what tell you which scenario is materialising.
Navigating crude in a two-speed market
The tension is real and it is not resolving soon. Right now, supply-side data and rerouting resilience are doing the heavy lifting on price direction, which is why WTI sits near $71.50/bbl with Goldman forecasting a drift toward $66/bbl. But the structural vulnerabilities at Hormuz and across Saudi export infrastructure mean the floor beneath prices is genuine, not illusory. The upside tail remains live, with the World Bank flagging $95/bbl on infrastructure damage and Goldman $100-120/bbl on sustained Hormuz disruption.
Two variables are worth watching above all others:
- Hormuz daily vessel transit counts as the live geopolitical indicator
- The major bank surplus forecasts as the structural demand anchor
History suggests conflict premiums typically unwind within 6 to 18 months, and the tail-risk outcomes would generally require several of the named triggers to strike at once. The question for the months ahead is not whether geopolitical risk exists. It plainly does. It is whether any trigger materialises with enough force to overwhelm the surplus dynamic currently winning the argument.
For investors wanting to understand how the risk premium is sized and how fast it can collapse on a credible de-escalation signal, our full explainer on the geopolitical risk premium breaks down Goldman Sachs’ estimate of roughly $14 per barrel of embedded premium and the Federal Reserve dilemma it creates.
This article is for informational purposes only and should not be considered financial advice. Investors should conduct their own research and consult with financial professionals before making investment decisions. Past performance does not guarantee future results. Financial projections are subject to market conditions and various risk factors, and forward-looking scenarios are speculative and subject to change based on market developments.