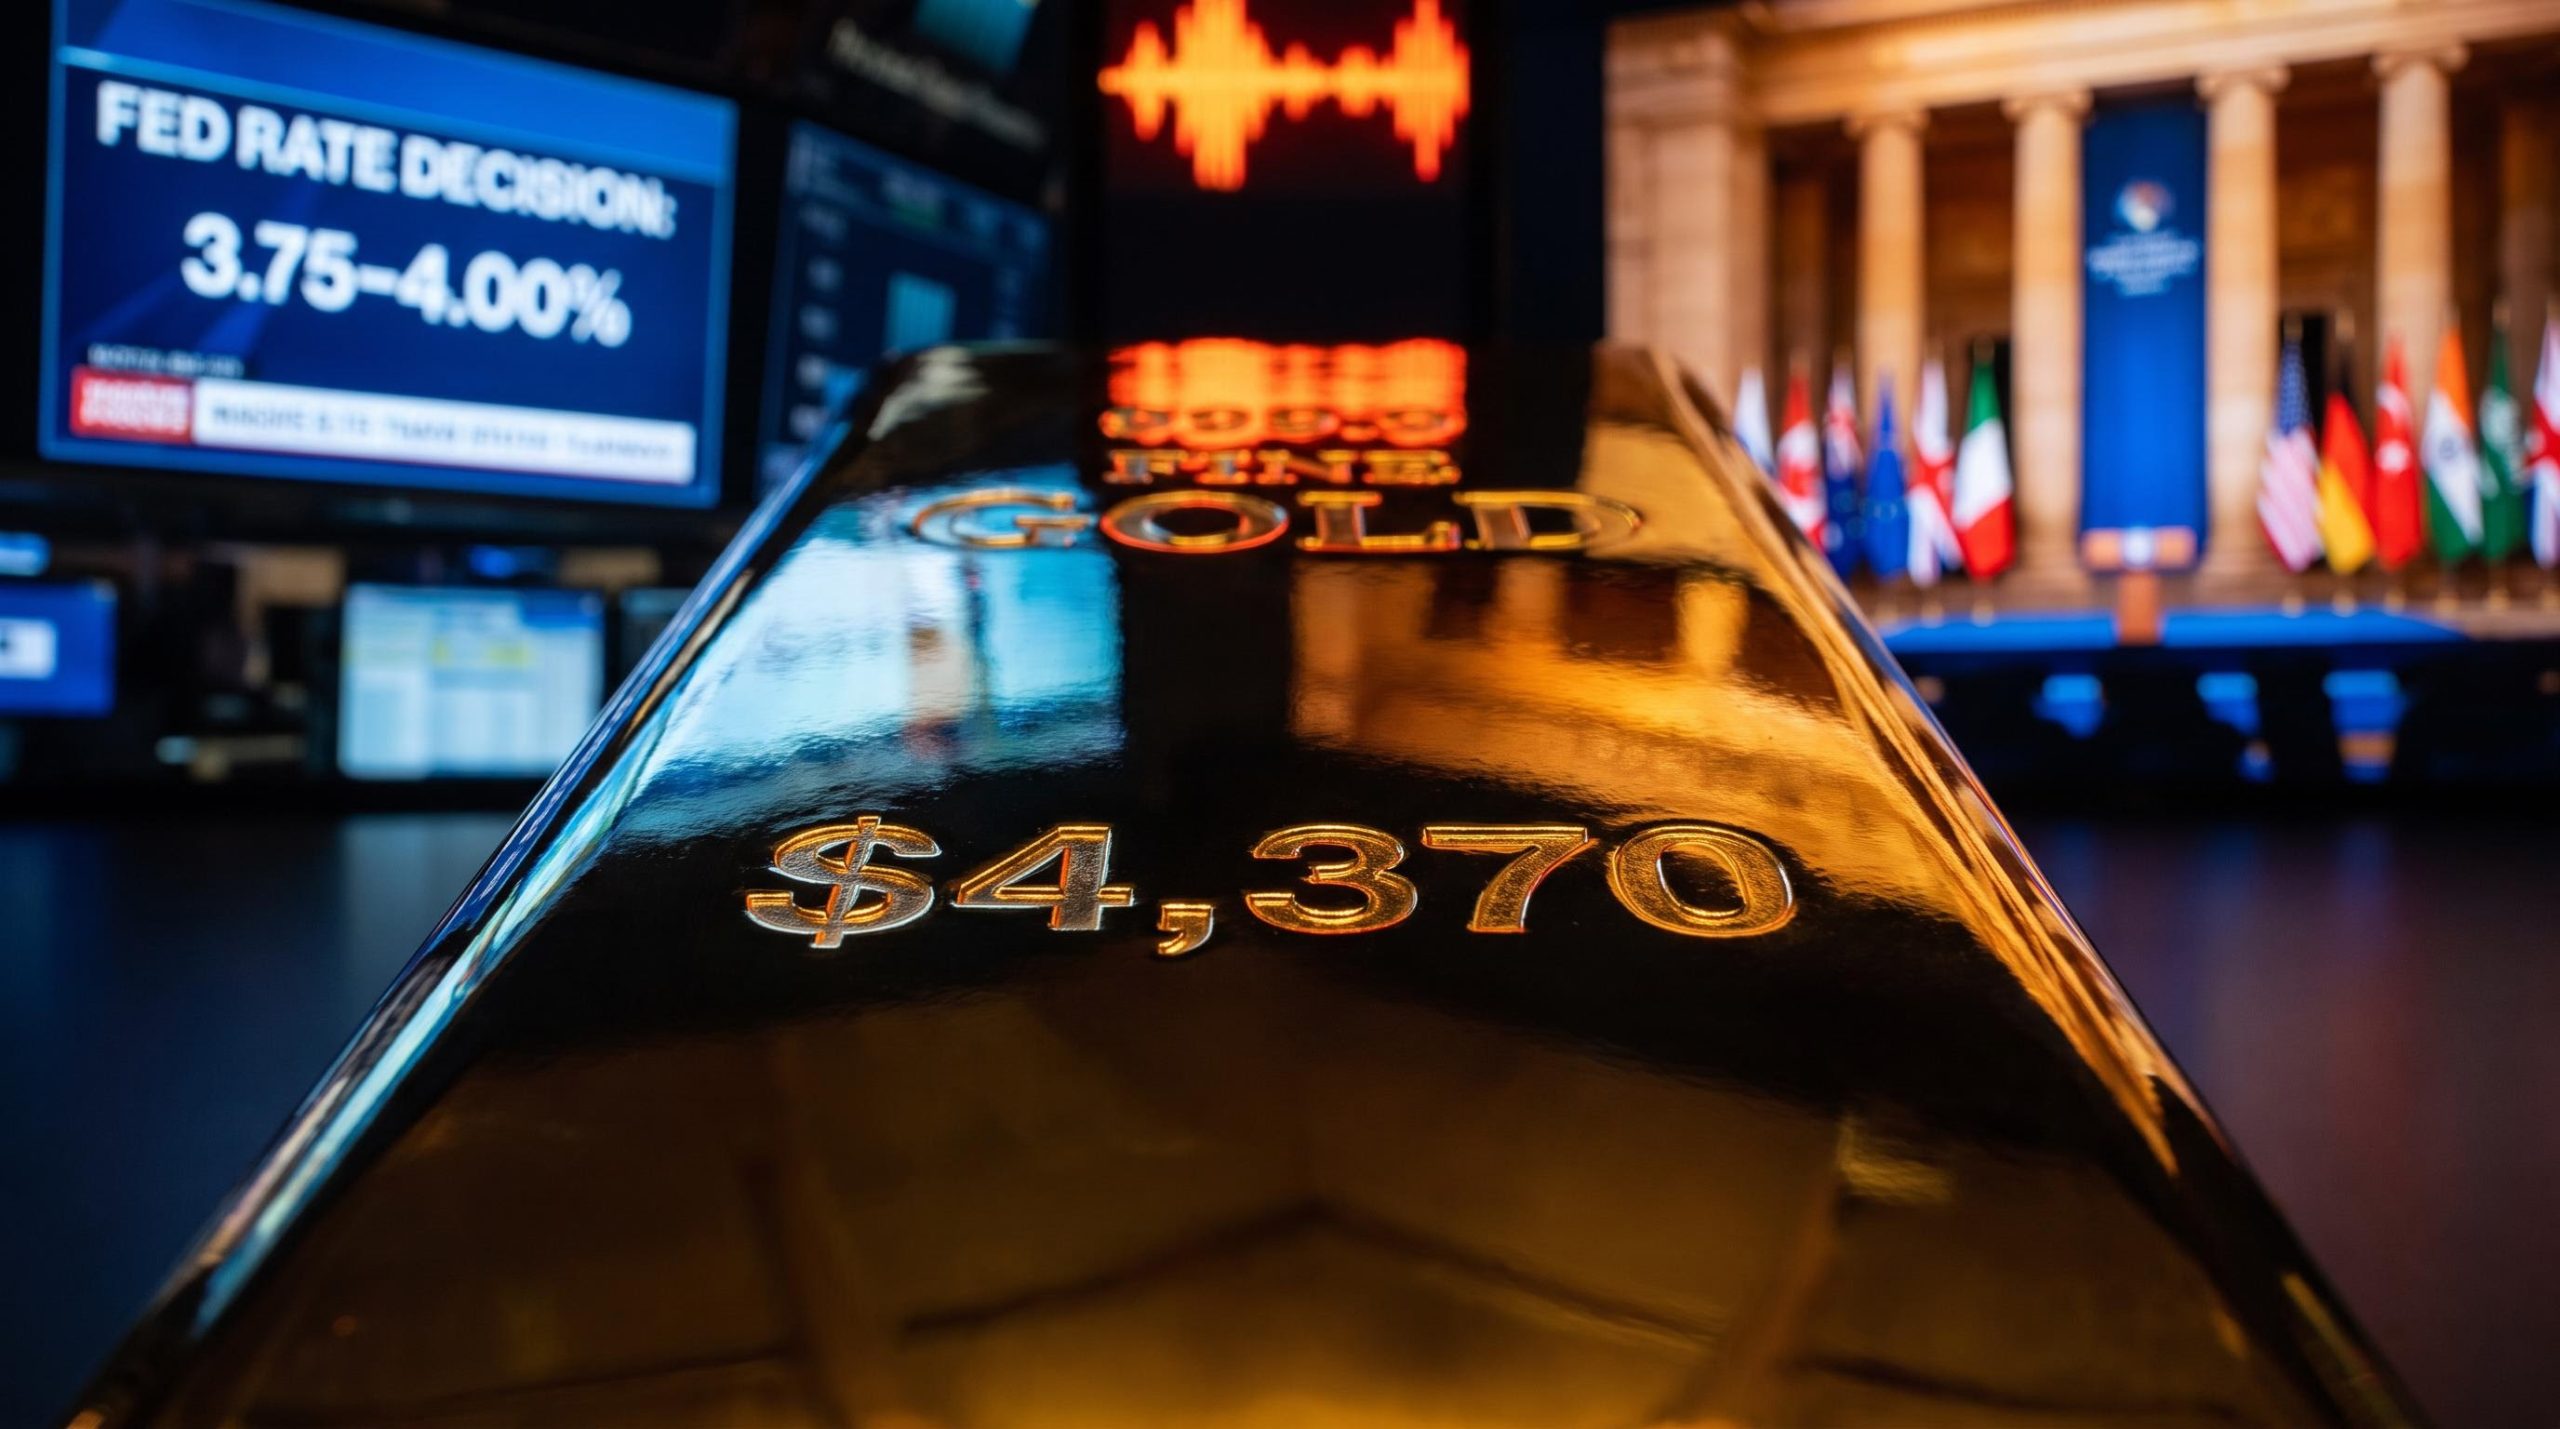
The US Federal Reserve has ended its three-year pause with a 25-basis-point interest rate increase, and that single move has changed the calculus for every asset class you hold. A basis point is one hundredth of a percentage point, so this is a quarter-point rise, the first tightening step since 2023.
This is not a one-off. Market-implied odds of a follow-up increase at the October 2026 meeting have surged to roughly 56.5%, driven by unusually blunt commentary from the central bank’s leadership, which now treats inflation as unacceptably persistent.
For you, that rapid repricing of monetary policy opens fresh vulnerabilities in both your equity and fixed-income positions. Borrowing costs are rising, and the assets most sensitive to them are already moving.
This piece gives you a working framework for reading the predictive tools professionals use to forecast central bank moves, so you can pinpoint exactly where your portfolio is exposed to the higher cost of money.
Why the Federal Reserve is keeping its foot on the brake
After three years without a move, the Fed lifted its benchmark rate by 25 basis points in September 2026 and made no attempt to soften what came next. Policymakers signalled that further tightening remains firmly on the table if inflation refuses to cooperate.
The reasoning traces back to prices that simply will not settle. The Fed’s preferred inflation gauge, the Personal Consumption Expenditures index (PCE), which tracks what households actually spend across goods and services, continues to run well above the central bank’s 2% target.
Fed Chair Kevin Warsh made the point without hedging at his press conference on 16 September 2026.
Warsh’s policy inheritance matters here: he was confirmed into an already-elevated inflation environment with CPI at 3.8% and Brent crude above $107, which shaped the hawkish instincts now on display in his September press conference commentary.
“The plain fact is that inflation is too high and has been for too long. Our predominant focus is on the price stability side of our mandate. This summer’s inflation readings do not tell me that underlying trends have meaningfully improved.”
That messaging tells you something concrete about your returns. Inflation dynamics, not growth, will set the direction of markets for the foreseeable future, and the Fed has effectively told you it is willing to sacrifice near-term expansion to break the price cycle.
The economy is not the reason for caution here. It is the reason the Fed feels free to keep hiking. Warsh described US activity as strengthening, pointing to improved hiring, rising household incomes, and firmer capital spending. A resilient labour market and healthy corporate investment give policymakers the confidence that the economy can absorb tighter conditions.
Minneapolis Fed President Neel Kashkari reinforced the tone. His most recent remarks scored 6.2 on the FXS Speechtracker, a tool that rates the hawkishness of individual officials, and that reading sits almost exactly on his historical average of 6.3, confirming a consistently tight stance rather than a one-off outburst.
The takeaway for you is discipline. Recognising the Fed’s unwavering commitment to its 2% goal helps you avoid the trap of buying dips prematurely on false hopes of a sudden policy reversal. This central bank has told you, repeatedly, that it is not close to finished.
When big ASX news breaks, our subscribers know first
Decoding the market rate expectation tools
Professional investors do not wait for a news headline to tell them what the Fed will do. They watch a live set of probabilities that update the moment expectations shift, and you can read the same dashboards they do.
The primary one is the CME FedWatch Tool. It translates prices from 30-day Fed Funds futures, contracts that track where the effective federal funds rate is heading, into implied probabilities for each upcoming FOMC meeting. In plain terms, it converts where traders are placing their money into a percentage chance of a hike, hold, or cut.
The CME FedWatch Tool translates futures pricing into probabilities, but reading those probabilities accurately requires knowing which FOMC members actually set policy: only 12 officials vote at each meeting, and the FOMC structure determines whether a hawkish regional president’s remarks carry binding weight or serve merely as context.
The recent move in FedWatch is the story in miniature. Odds of an October hike jumped from roughly 42.5% to around 56.5% in the space of a week, according to figures reported by TMGM and Mitrade on 21 September 2026. That swing happened because Warsh’s hawkish tone forced the market to reprice almost overnight.
The second tool is the FXS Fed Sentiment Index, which quantifies how hawkish or dovish the Fed’s communication sounds. A reading of 100 is neutral. The latest figure sits at 150.61 after a modest 1.47-point decline, which keeps it firmly in hawkish territory even after easing slightly from the week’s high.
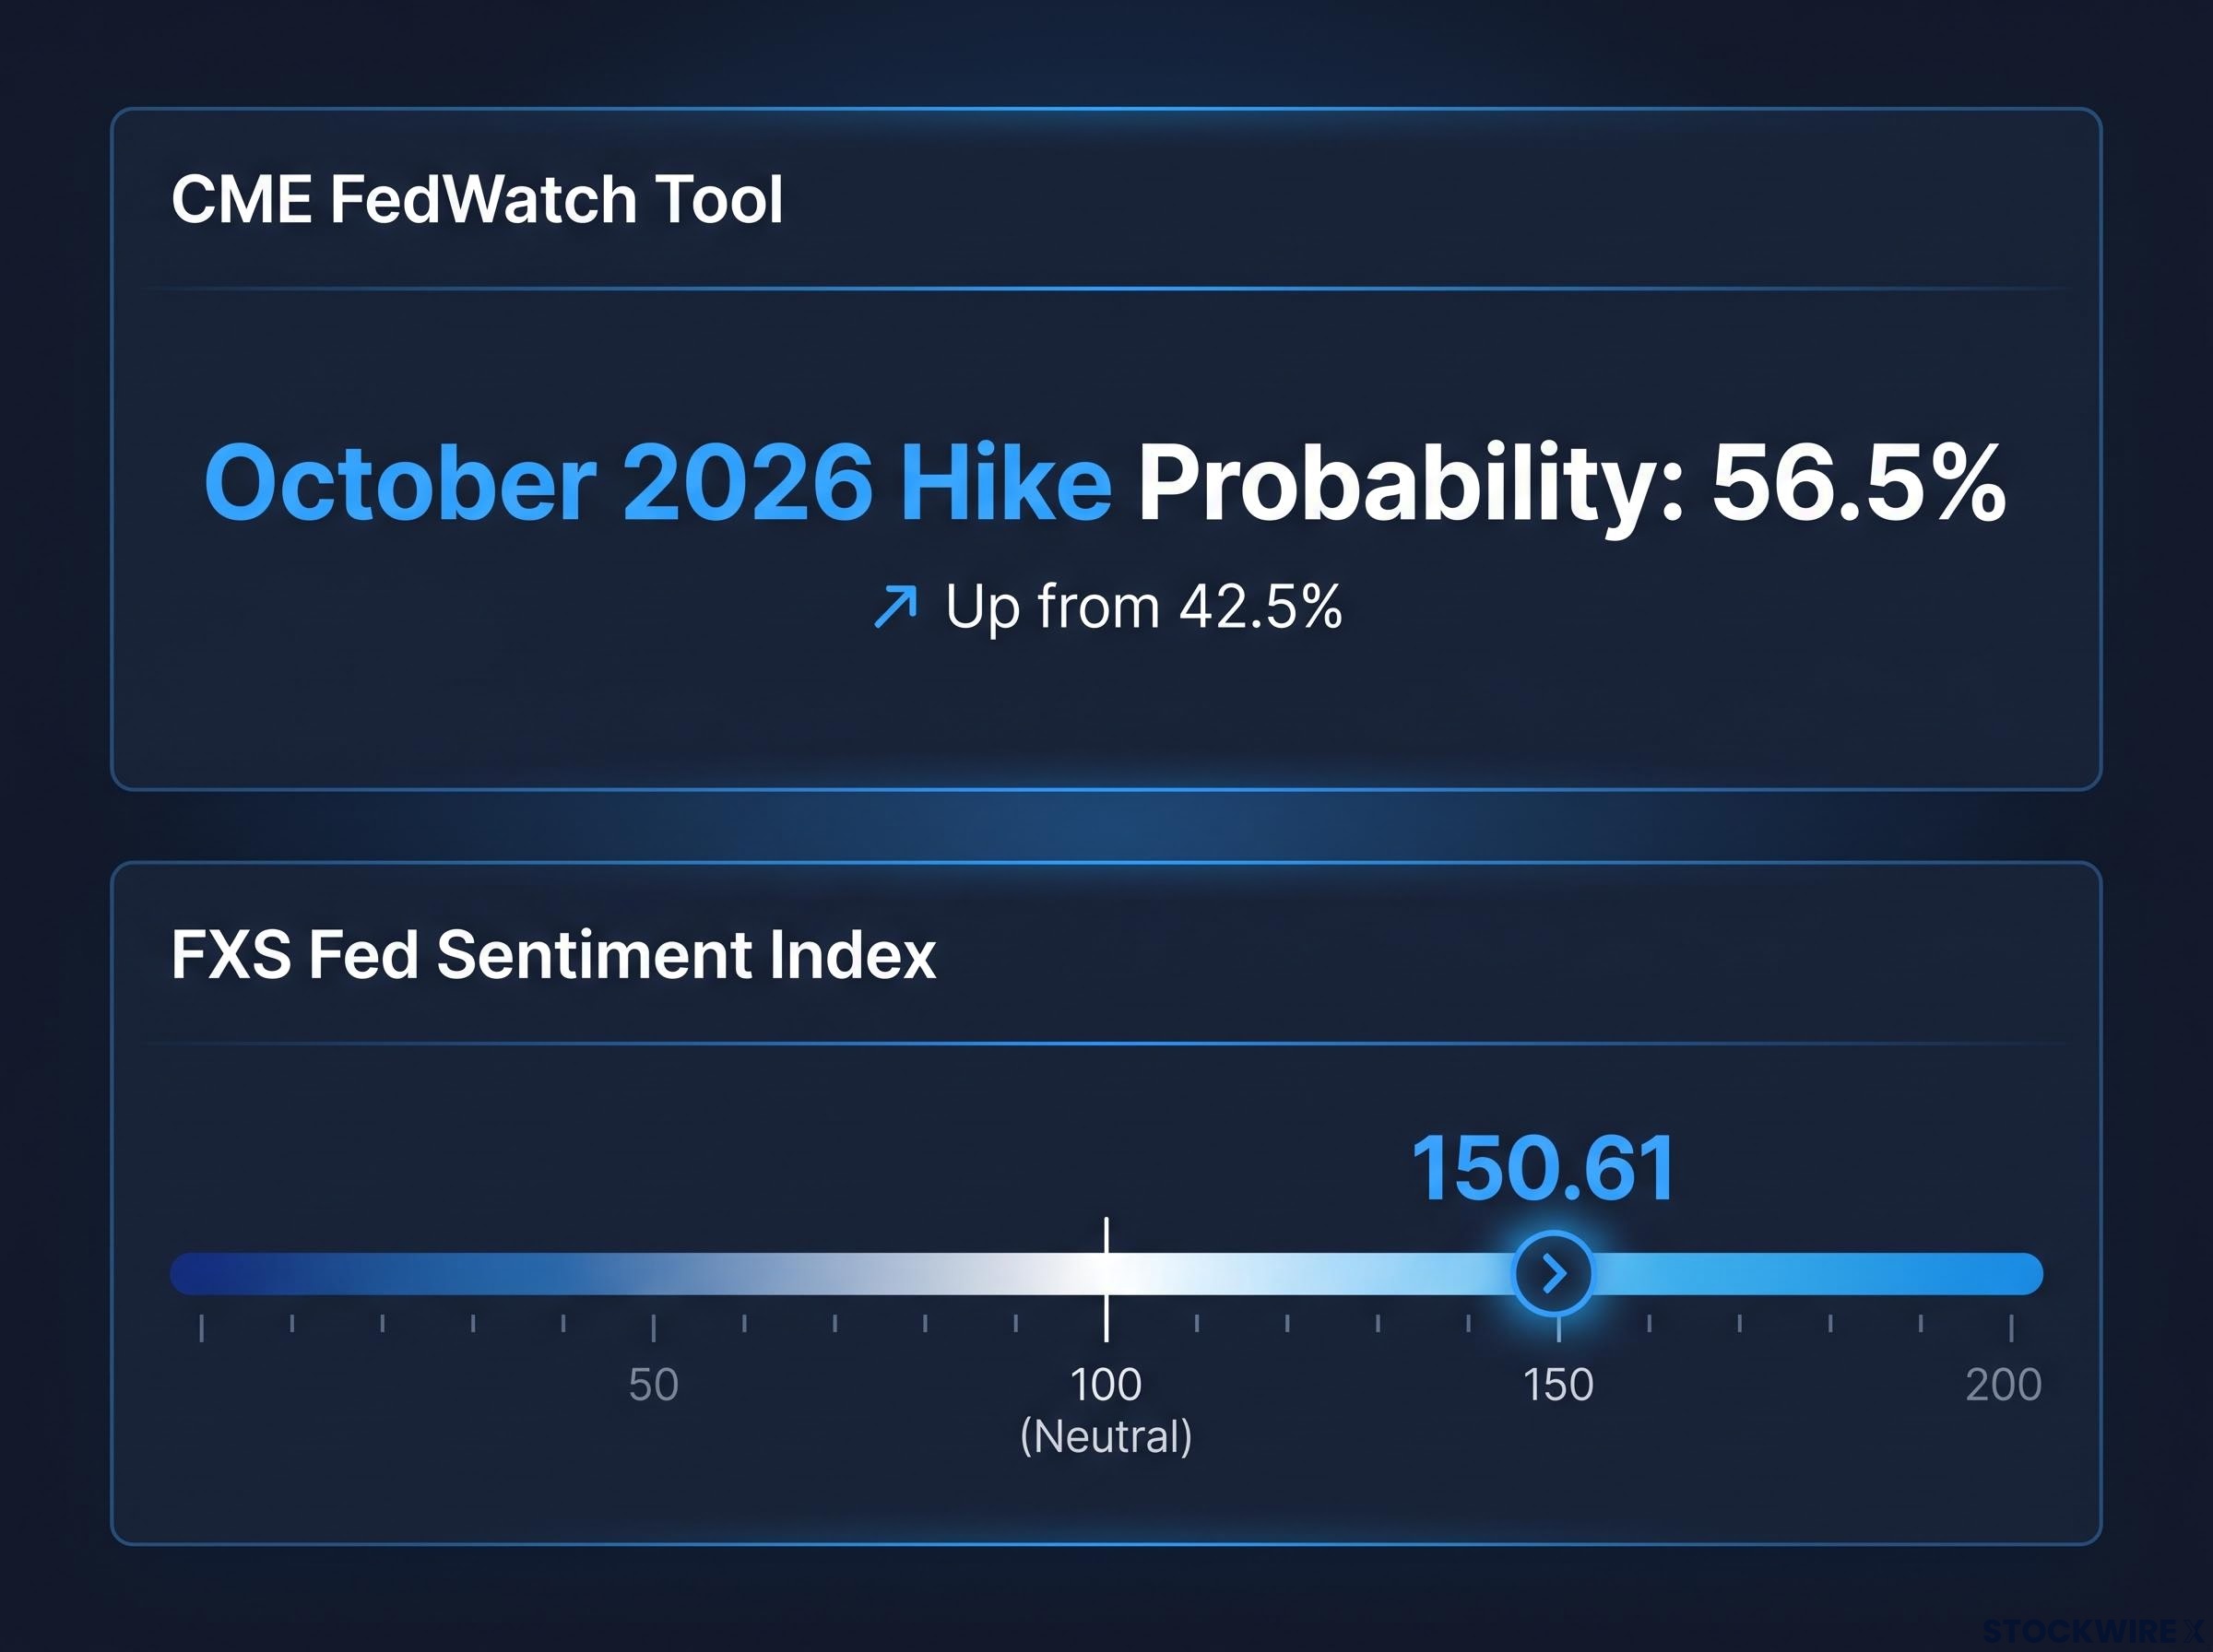
Reading these together gives you an edge. When probabilities and sentiment both climb, you can position ahead of a widely anticipated decision rather than reacting after it is announced and already priced in.
| Tool name | What it measures | Current September reading | Practical use for your portfolio |
|---|---|---|---|
| CME FedWatch Tool | Implied probability of a rate hike, hold, or cut, derived from 30-day Fed Funds futures | ~56.5% odds of an October hike, up from ~42.5% a week earlier | Gauge consensus before a meeting and time adjustments to duration and sector exposure |
| FXS Fed Sentiment Index | Perceived hawkishness or dovishness of Fed communication | 150.61, down 1.47 points but well above the neutral 100 baseline | Confirm the tone behind the numbers and sense-check whether hike odds are backed by rhetoric |
One caveat matters. As CME’s own methodology stresses, these tools reflect current market pricing, not guaranteed outcomes. They show what is priced in, not what will happen, so treat them as dynamic signals of market belief and combine them with your own read on the economy.
The tension between a soft landing and recession risk
The market is telling two stories at once, and your portfolio has to survive whichever one turns out to be true. The optimists point to the data. Warsh himself describes a strengthening economy, with improved hiring, rising incomes, and solid corporate investment, which suggests the Fed can keep tightening without stalling growth.
Some strategists go further. In a Reuters “VIEW” piece on 16 September 2026, one market strategist argued that the market may be overpricing the path of future hikes, and that the Fed could stop short of the aggressive tightening that futures currently imply. On that reading, growth absorbs the pressure and the expansion continues.
Where the recession case gets its teeth
The pessimists focus on how far the Fed may have to go. Kashkari’s warning that inflation now affects “all aspects” of the US economy, not just volatile categories like oil, supports a view in which price pressures have become broad-based and the Fed feels compelled to tighten until the cycle breaks.
That determination raises the stakes. Reuters’ post-meeting coverage noted Fed officials suggested more hikes were coming, with FedWatch data pointing to roughly a 90% probability of another quarter-point increase by year-end. Sustained restrictive policy of that kind has historically squeezed corporate earnings and household borrowing capacity, and CNBC’s analysis described markets bracing for higher rates for longer.
History offers a warning here rather than a rulebook. Previous episodes of stubborn inflation forced central banks to hold rates elevated for extended stretches, and markets repriced risk assets sharply once the effects fed through. Expectations in those earlier cycles also swung fast, flipping when economic data surprised to the downside.
What this means for you is straightforward. You cannot bet the portfolio on a single macro forecast. Prepare for both a durable expansion and a sudden credit squeeze, and identify which of your holdings quietly assume a perfect outcome that may not arrive.
Repositioning your assets for sustained higher rates
Enough theory. The question that matters is where your money is actually exposed when the cost of capital keeps climbing, and the honest answer is that rising rates work against most of what a typical portfolio holds.
Higher rates lift the discount rate used to value future company earnings. When that rate rises, the present value of profits expected years from now shrinks, which is why long-duration growth and technology stocks tend to fall hardest. Bonds face the mirror image: as yield expectations climb, the prices of existing fixed-income securities drop, exposing you to duration risk, the sensitivity of a bond’s price to changes in interest rates.
Treasury yield repricing is already underway: the 10-year yield hit approximately 5.01% on 18 September 2026, and a move toward 6% would push 30-year mortgage rates to 7.7-8% while compressing equity multiples by up to 300 basis points, amplifying every pressure the current article describes.
The market has already shown you the pattern. Morningstar’s coverage of the first hike in three years noted declines in gold and broader risk assets as investors digested the prospect of further increases, while Reuters reported stocks falling after the hawkish move.
Here is where the pressure lands across the three areas most investors hold:
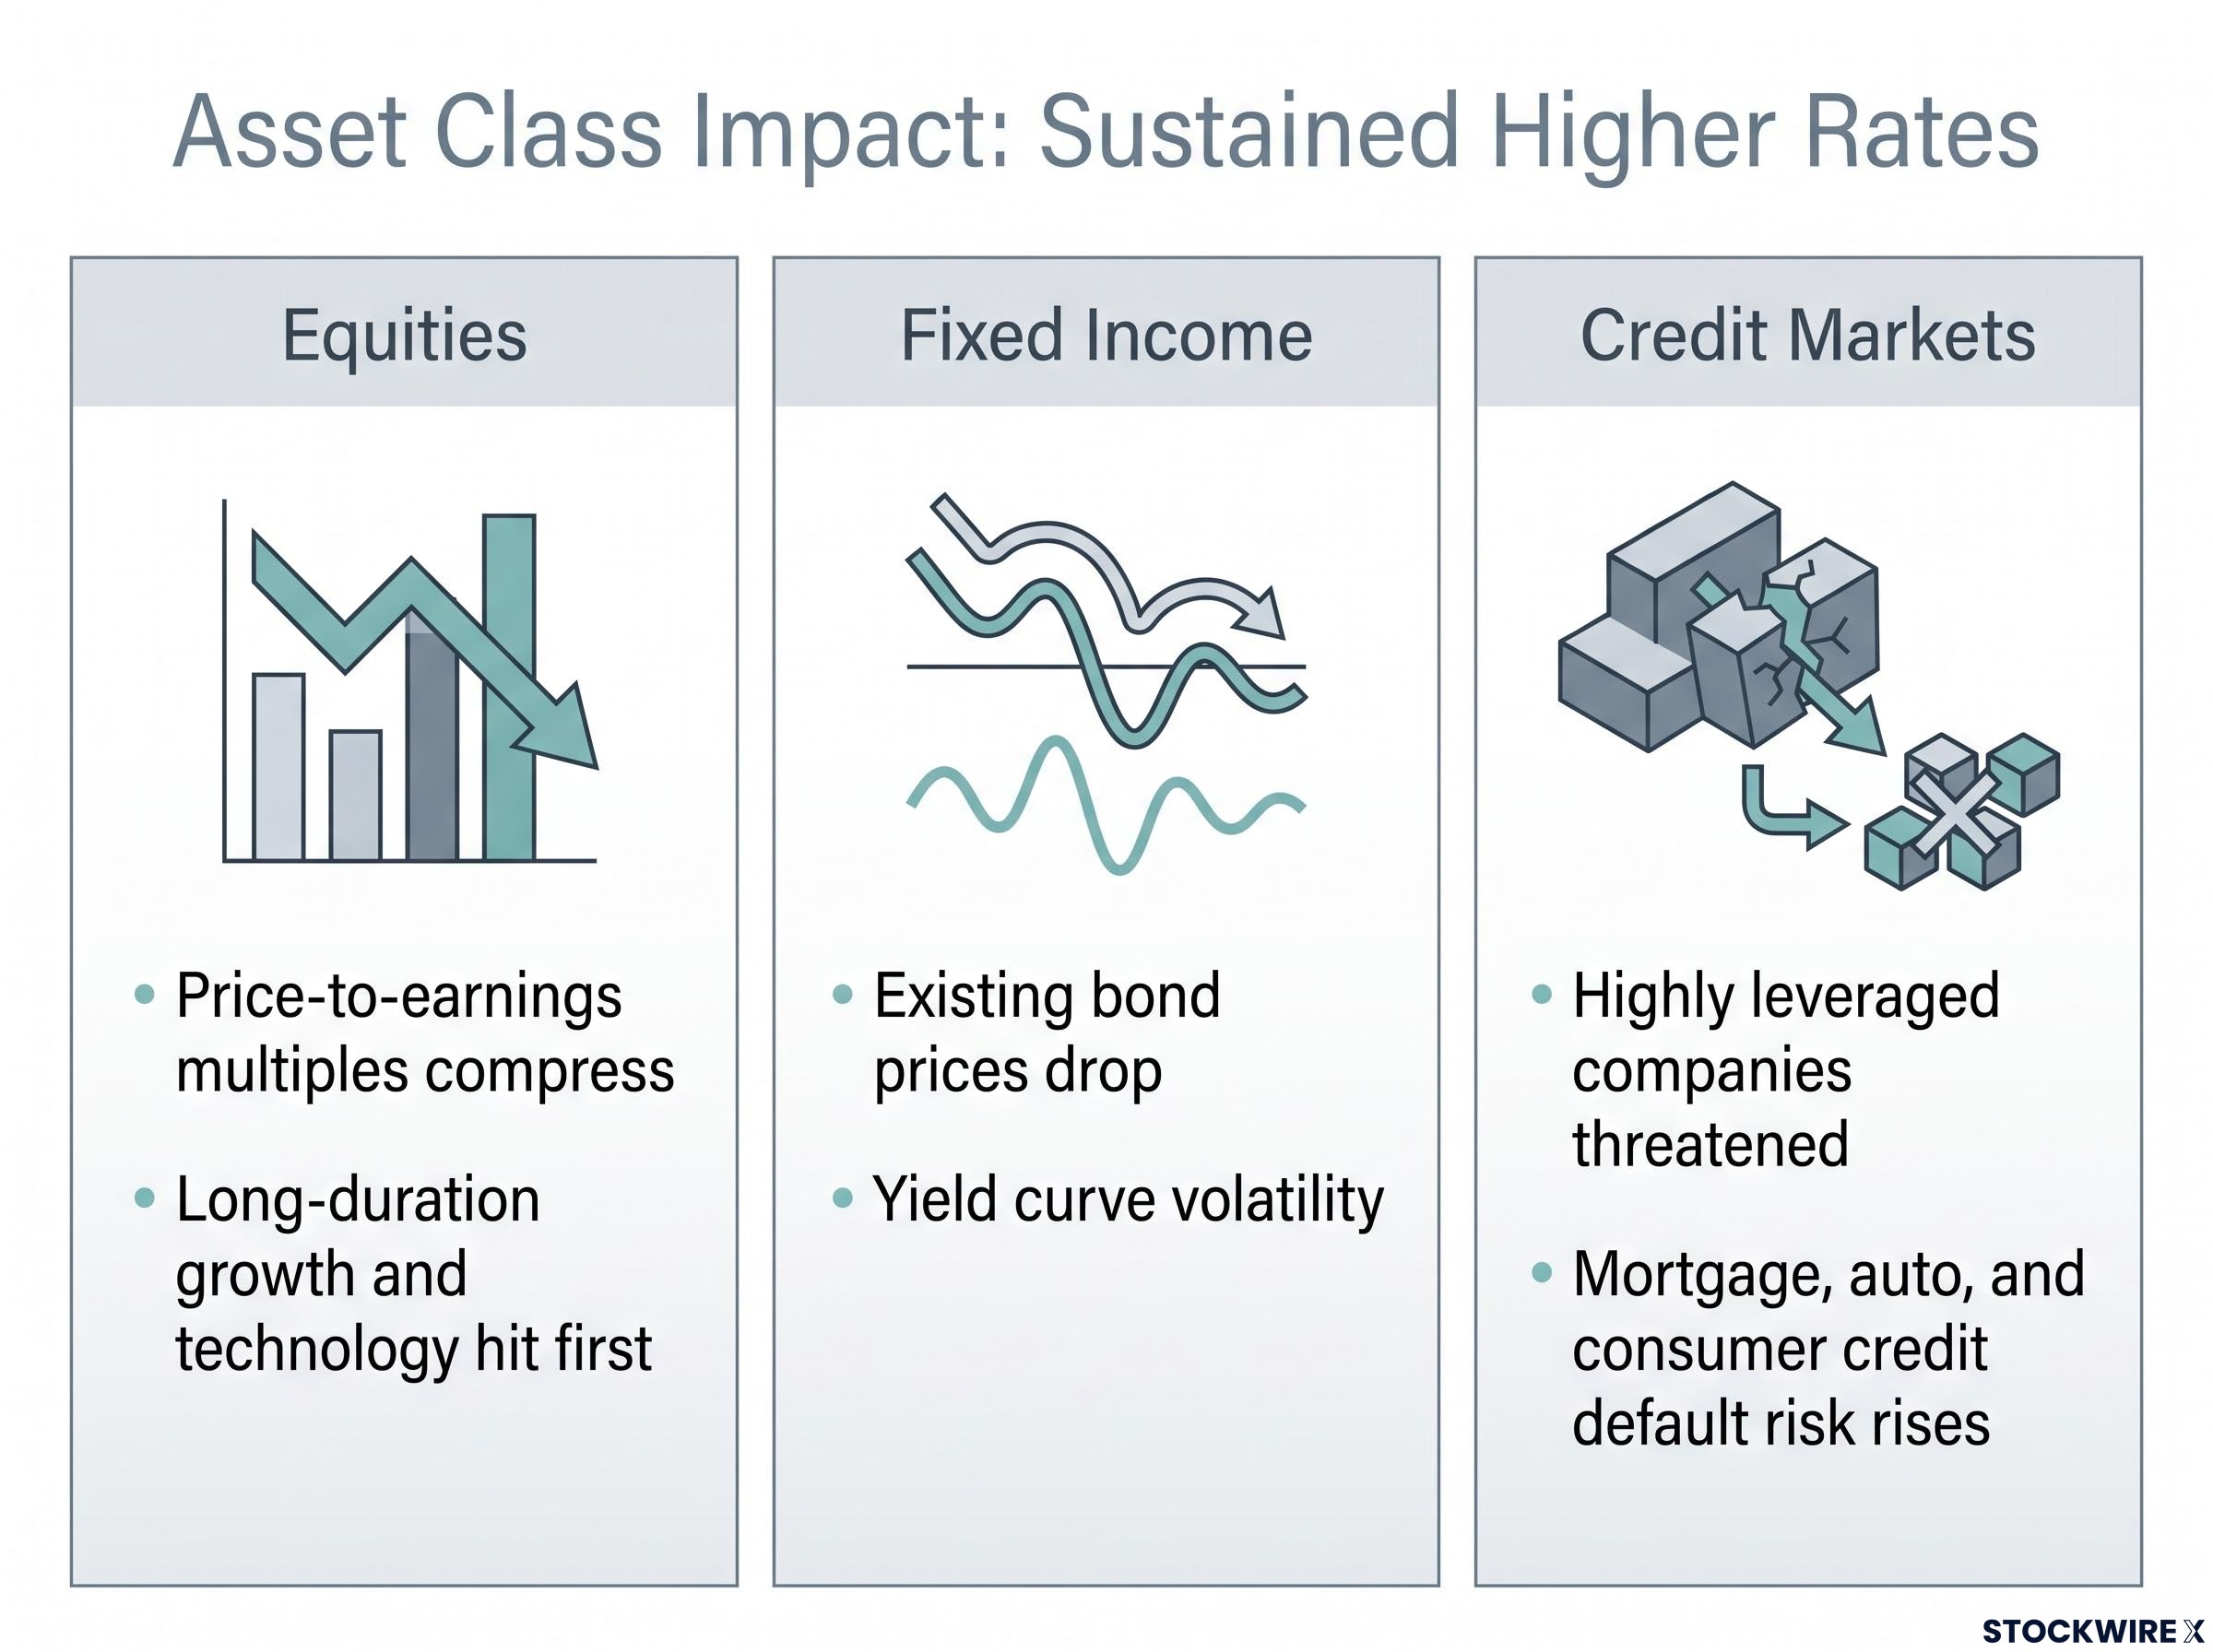
- Equities: Higher discount rates compress price-to-earnings multiples, hitting long-duration growth and technology names first as their distant future earnings lose value today.
- Fixed income: Rising implied rates, visible in the shift in 30-day Fed Funds futures pricing, push existing bond prices lower and drive volatility across the yield curve, the biggest risk sitting in longer-dated holdings.
- Credit markets: Elevated borrowing costs threaten highly leveraged companies and feed through to mortgage, auto, and consumer credit, raising default risk in the more indebted corners of the market.
The read for you is active, not passive. A rising cost of capital directly compresses the valuations of your growth stocks and your existing bonds, which means simply riding a broad market index leaves you fully exposed to the headwind. Stress-test your current holdings against a higher-for-longer scenario and consider rotating toward sectors that have historically held up better during tightening cycles.
This article is for informational purposes only and should not be considered financial advice. Investors should conduct their own research and consult with financial professionals before making investment decisions. Past performance does not guarantee future results, and these statements are speculative and subject to change based on market developments.
Setting your strategy for an unpredictable tightening cycle
The three-year era of accommodation is over. Multiple rate increases are now the baseline expectation rather than a tail risk, and the Fed’s leadership has given you no reason to expect a quick pivot back to easier money.
Use FedWatch and the FXS Sentiment Index the way professionals do, as dynamic inputs that frame scenarios, not as certainties that dictate a single trade. They tell you where consensus sits and how fast it is moving, but they reflect market belief, not confirmed outcomes.
Fiscal dominance adds a structural constraint the simple rate-hike framework does not capture: US federal debt has risen to roughly 122% of GDP, meaning each 1-percentage-point increase in the average interest rate on that debt now costs approximately 1.2% of GDP annually, four times the cost imposed by Volcker’s own campaign.
The action is yours to take, and the clock is running toward the October meeting. Review your portfolio’s duration risk and leverage exposure now, before the next decision lands. Identify the holdings that quietly depend on rates falling, and decide whether you are comfortable carrying that bet into a central bank that has told you, plainly, that its work is not done.