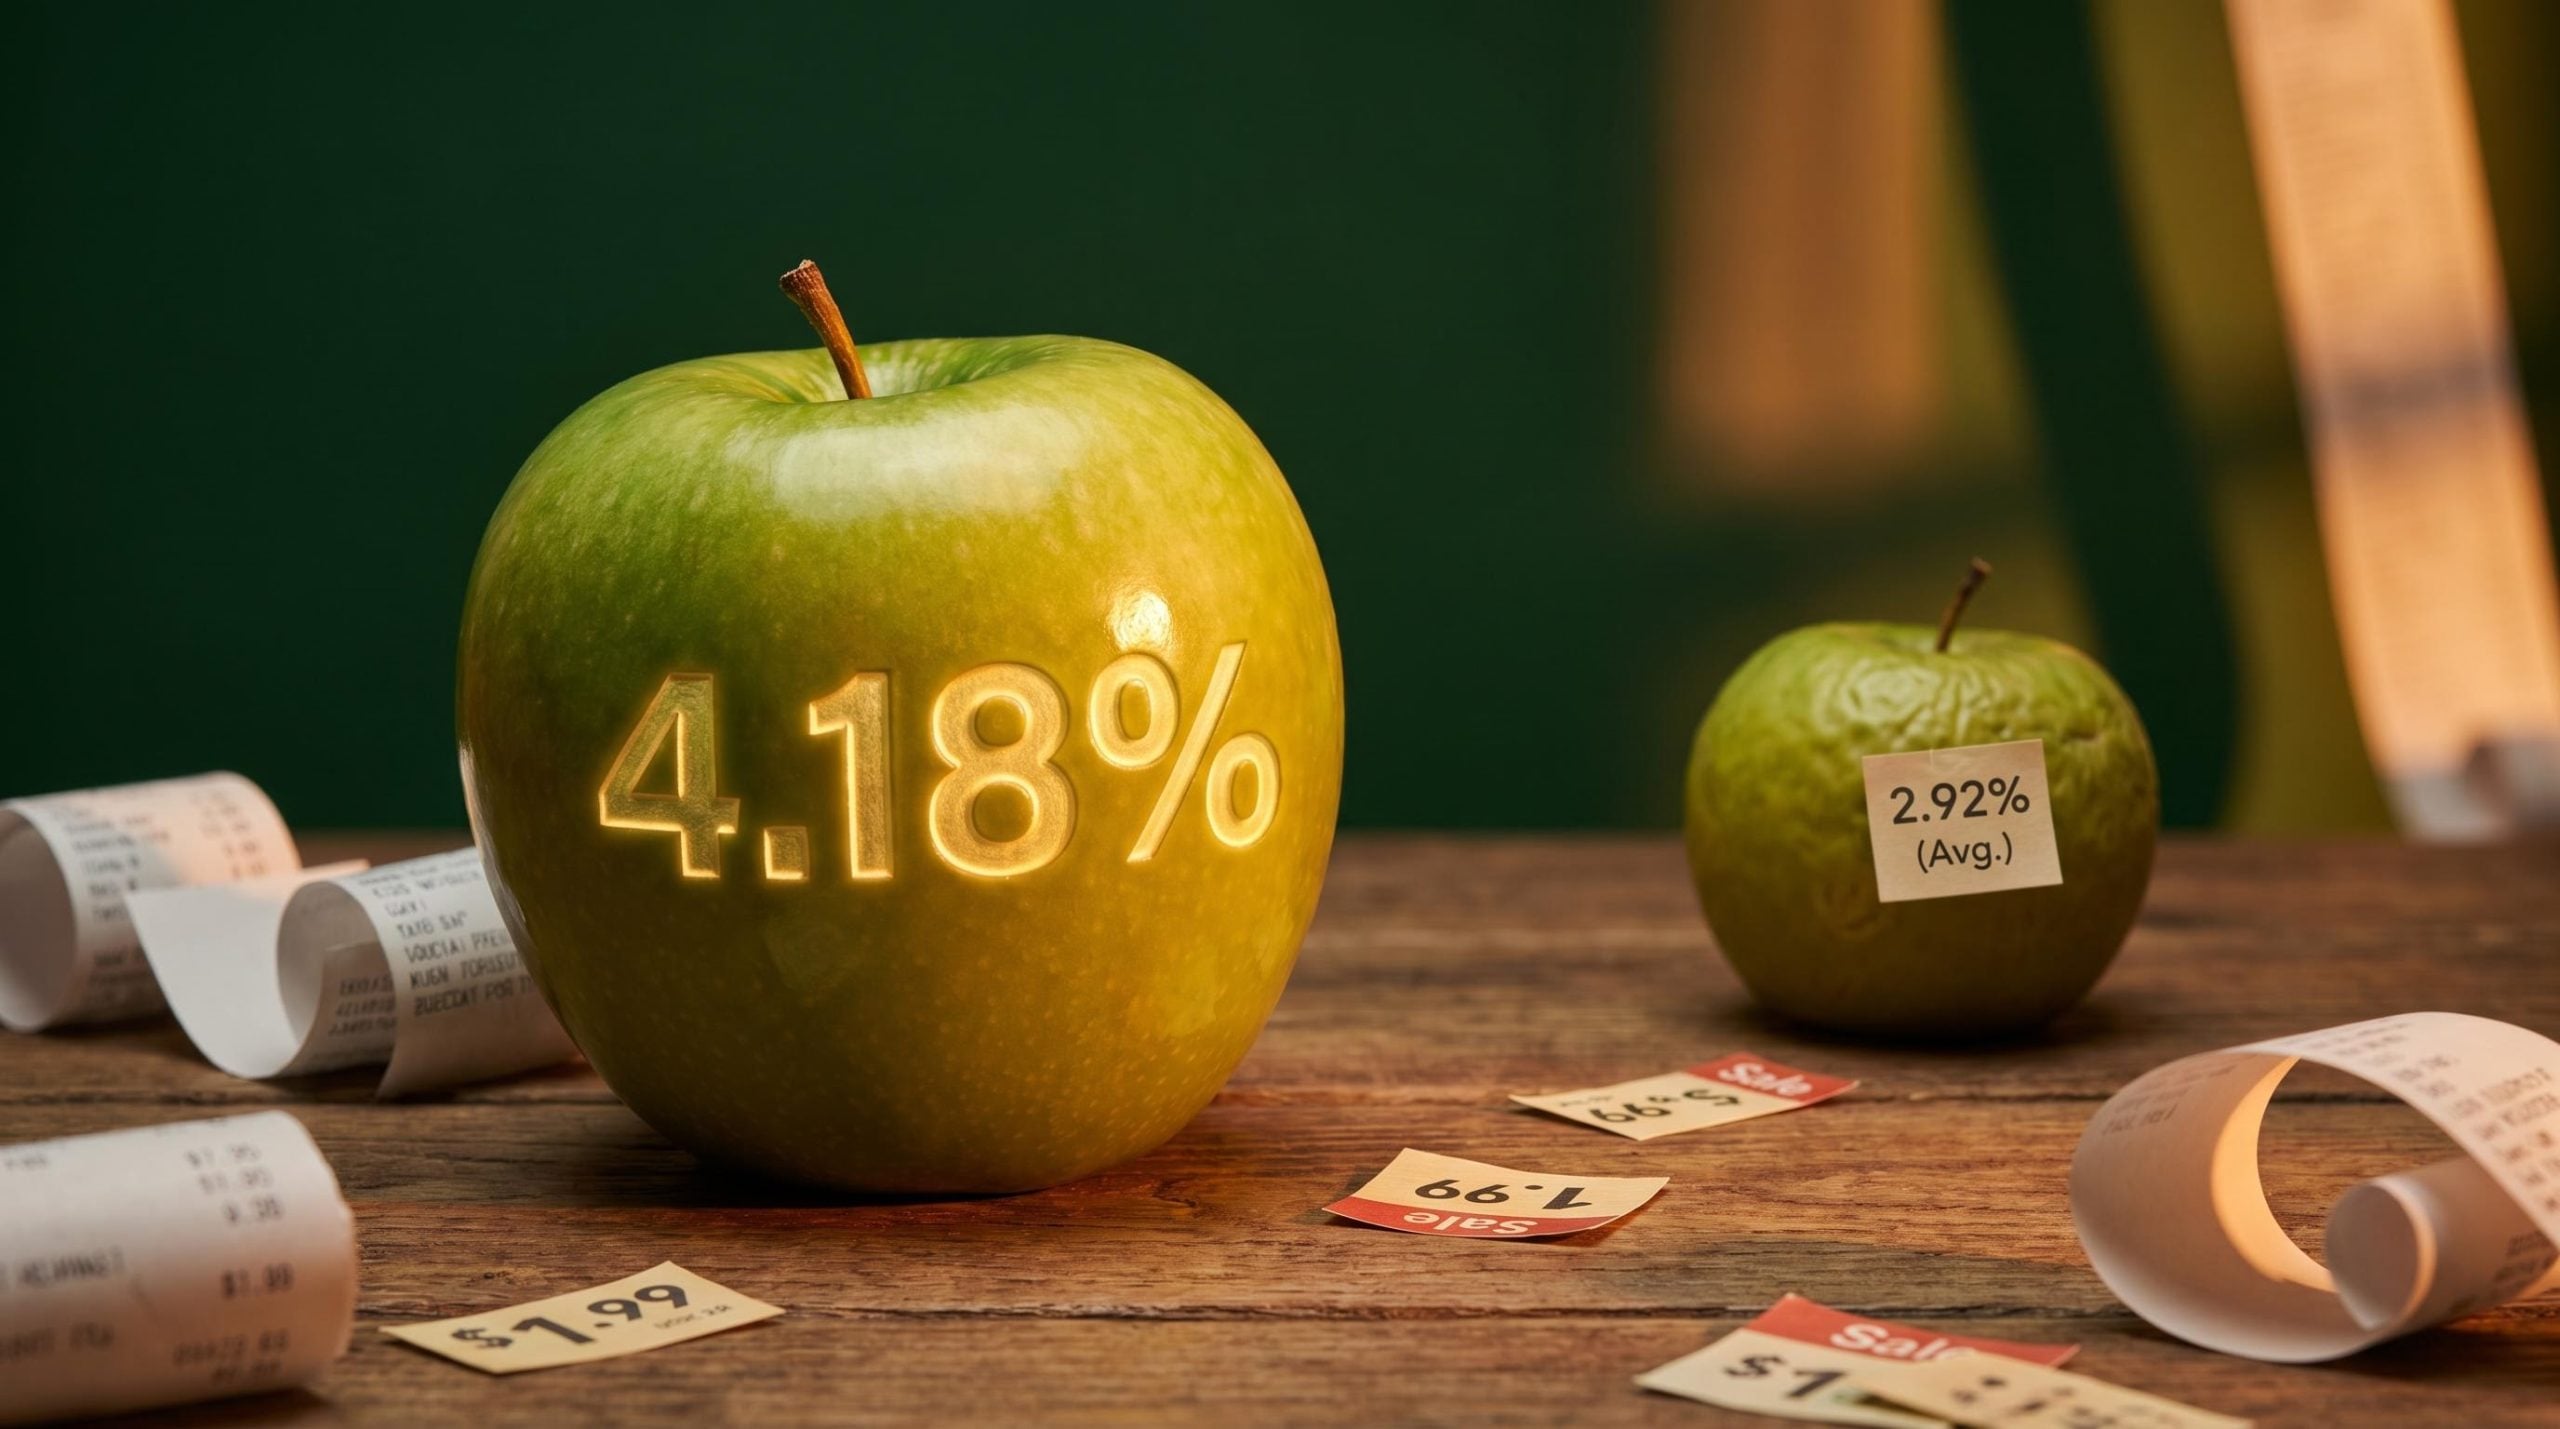
Woolworths shares have climbed 17.2% since the start of 2025, yet the stock’s dividend yield sits at 4.18%, well above its five-year average of 2.92%. For income-focused ASX investors, that combination of a rising price and an elevated yield demands an explanation, not a celebration.
Woolworths Group remains Australia’s largest supermarket operator by sales and market share, a cornerstone defensive holding for millions of Australian investors. But FY25 delivered a 17.1% decline in normalised net profit after tax (NPAT), regulatory scrutiny intensified, and competitive pressure from Aldi and Coles has not abated. The share price recovery from its 52-week low of A$25.20 to approximately A$34.70 creates a moment where disciplined valuation thinking matters more than momentum.
This analysis walks through what an above-average dividend yield actually signals in a mature consumer staples business, how to contextualise Woolworths’ recent earnings under pressure, and how multi-method valuation approaches, including discounted cash flow (DCF) and Dividend Discount Models (DDM), can help assess whether the current price reflects opportunity or complacency.
What is driving the 17% share price recovery?
The 17.2% gain since the start of 2025 looks comfortable on a chart. Look closer and the picture is more qualified.
Woolworths’ share price recovery has unfolded from deeply oversold levels. The stock touched a 52-week low of A$25.20 during a period of peak earnings concern and regulatory noise, and it has since climbed to approximately A$34.70 as of late May 2026. Three reference points frame the trajectory:
- A$25.20 (52-week low): the floor set during peak uncertainty around FY25 earnings and ACCC scrutiny
- A$34.70 (current price, late May 2026): a partial recovery, supported by capital rotation into defensive consumer staples during broader market volatility
- A$38.24 (52-week high): the level the stock has not reclaimed, sitting approximately 9% above the current price
The 17.2% year-to-date gain reflects a recovery from a trough, not a re-rating to new highs. Woolworths’ market capitalisation sits at approximately A$42.1-A$42.4 billion, still well below where it traded at the 52-week peak.
Consumer staples stocks routinely attract capital during periods of uncertainty, and Woolworths has benefited from that defensive rotation. The question for investors is whether the price now reflects fair value for the earnings trajectory ahead, or whether the recovery has already priced in the upside.
When big ASX news breaks, our subscribers know first
The dual signals of an above-average yield
A 4.18% dividend yield from a company of Woolworths’ profile looks, at first glance, like a straightforward income opportunity. It sits 43% above the five-year average yield of 2.92%, a gap that would typically signal the market is offering a discount on a proven distribution stream.
That reading is incomplete.
| Metric | Value | Implied Signal |
|---|---|---|
| Current dividend yield | 4.18% | Elevated relative to history |
| Five-year average yield | 2.92% | Baseline for normalised pricing |
| Premium to average | 43% | Requires payout sustainability check |
Two dynamics can push a yield above its historical average: rising distributions or a share price that has fallen (or lagged earnings growth). In Woolworths’ case, both forces are at work. Distributions have trended upward: the FY25 interim dividend was 39 cents per share (fully franked), the FY25 final dividend was 45 cents per share (fully franked at 30%), and the H1 FY26 interim dividend rose to 45 cents per share, fully franked.
When higher dividends meet lower earnings
The tension sits in the earnings line. FY25 normalised NPAT came in at A$1.385 billion, down 17.1%. A company that grows its dividend while its earnings contract is, by definition, increasing its payout ratio. Whether that is a confident signal of management’s outlook or a stretch that future cash flows may not support is the question income investors need to resolve.
Woolworths has not provided explicit numerical DPS guidance for FY26 or beyond. Its progressive dividend policy ties distributions to sustainable earnings and free cash flow, expressed through payout ratio ranges rather than fixed targets. For income investors, free cash flow coverage is the more reliable signal than trailing yield alone.
Understanding dividend yield as a valuation tool for mature ASX businesses
For an investor holding a mature, income-paying ASX stock like Woolworths, dividend yield is not just a return metric. It functions as a rough valuation compass.
Dividend yield measures the annual dividend per share as a percentage of the current share price. In a consumer staples company where distributions form a core part of the total return proposition, yield becomes a way to gauge whether the market is pricing the stock generously or cautiously relative to its own history. When the current yield sits above the five-year average, it suggests one of two things: the market has elevated its risk assessment of the stock, or the share price has not kept pace with distribution growth.
For Australian resident taxpayers, the calculation carries an additional layer. Woolworths’ dividends are fully franked at the 30% corporate tax rate. Full franking means the company has already paid tax on the profits from which dividends are distributed, and shareholders receive a tax credit (the franking credit) that offsets their personal tax liability. The gross yield, which accounts for this credit, is materially higher than the headline cash yield.
Three conditions distinguish an above-average yield that signals genuine value from one that signals a value trap:
- Cash flow remains durable: operating and free cash flow generation supports the dividend without requiring balance sheet deterioration
- Payout ratio is not stretched: distributions sit within a sustainable band relative to earnings, with room for reinvestment
- Balance sheet supports distributions: net debt levels and covenant headroom do not constrain dividend payments
Trailing yield alone is insufficient without cross-checking payout ratios and free cash flow coverage. The yield is a starting point for analysis, not an endpoint.
Applying DCF and Dividend Discount Models to a consumer staples stock
Woolworths generates substantial and relatively stable operating cash flows, which makes it a reasonable candidate for DCF modelling. The company reported group sales of A$69.1 billion in FY25 (up 3.6% normalised) and group EBIT of A$2.754 billion (down 12.6% normalised). eCommerce sales reached A$9.1 billion (up 17.1% normalised), a growth vector that matters for long-term cash flow assumptions.
In a DCF model, the analytical judgment lives in two inputs: the discount rate and the long-term growth rate. The discount rate is typically derived from the Capital Asset Pricing Model (CAPM), which combines the risk-free rate with an equity risk premium adjusted by the stock’s beta (a measure of its price sensitivity relative to the broader market). The long-term growth rate for a mature grocery retailer should sit below nominal GDP growth, reflecting the sector’s limited capacity for structural expansion.
The Gordon Growth Model, a simplified DDM variant, offers a complementary lens. The steps for applying it to Woolworths are:
The dividend discount model treats a stock’s intrinsic value as the present value of all expected future dividends, a framework particularly suited to mature ASX businesses like Woolworths where distributions form a core component of total return and cash flows are relatively predictable across economic cycles.
- Identify the expected dividend per share (DPS), using the most recent annualised distribution as a starting point
- Estimate the required return via CAPM, accounting for Australia’s current risk-free rate and an appropriate equity risk premium
- Estimate the long-term dividend growth rate, benchmarked against historical revenue and earnings growth
- Solve for the implied intrinsic value: DPS divided by (required return minus growth rate)
Consumer staples typically trade at premium multiples to the ASX 200 due to earnings defensiveness. Multi-method triangulation, using DCF, DDM, and relative multiples against Coles and the broader index, reduces dependence on any single model’s assumptions.
What growth rate does the current price imply?
The Gordon Growth Model can be rearranged to solve for the implied growth rate: required return minus (DPS divided by current price). At a share price of approximately A$34.70 and a cash yield of 4.18%, a required return assumption of 8-9% for an Australian defensive equity implies the market is pricing in long-term dividend growth of roughly 3.8-4.8%.
| Required Return | Growth Rate 3.0% | Growth Rate 4.0% | Growth Rate 5.0% |
|---|---|---|---|
| 8.0% | A$29.00 | A$36.25 | A$48.33 |
| 8.5% | A$26.36 | A$32.22 | A$41.43 |
| 9.0% | A$24.17 | A$29.00 | A$36.25 |
Note: illustrative ranges based on a simplified Gordon Growth Model using an estimated annual DPS of approximately A$1.45. These are not formal broker targets.
That implied growth range can be compared against Woolworths’ actual recent trajectory: revenue grew 3.6% in FY25 while earnings declined. Whether the market’s implied expectation is achievable depends on whether FY26 delivers the profit recovery management has guided toward.
Competitive position, regulatory risk, and the earnings recovery case
No valuation model is better than its assumptions about the underlying business. For Woolworths, those assumptions rest on three pillars: competitive positioning, regulatory trajectory, and the credibility of the FY26 earnings recovery.
The ACCC supermarkets inquiry final report, published in February 2025, documented findings on pricing practices and market concentration across Australia’s major grocery chains, providing the regulatory basis for the ongoing parliamentary scrutiny that creates earnings uncertainty in Woolworths’ forward models.
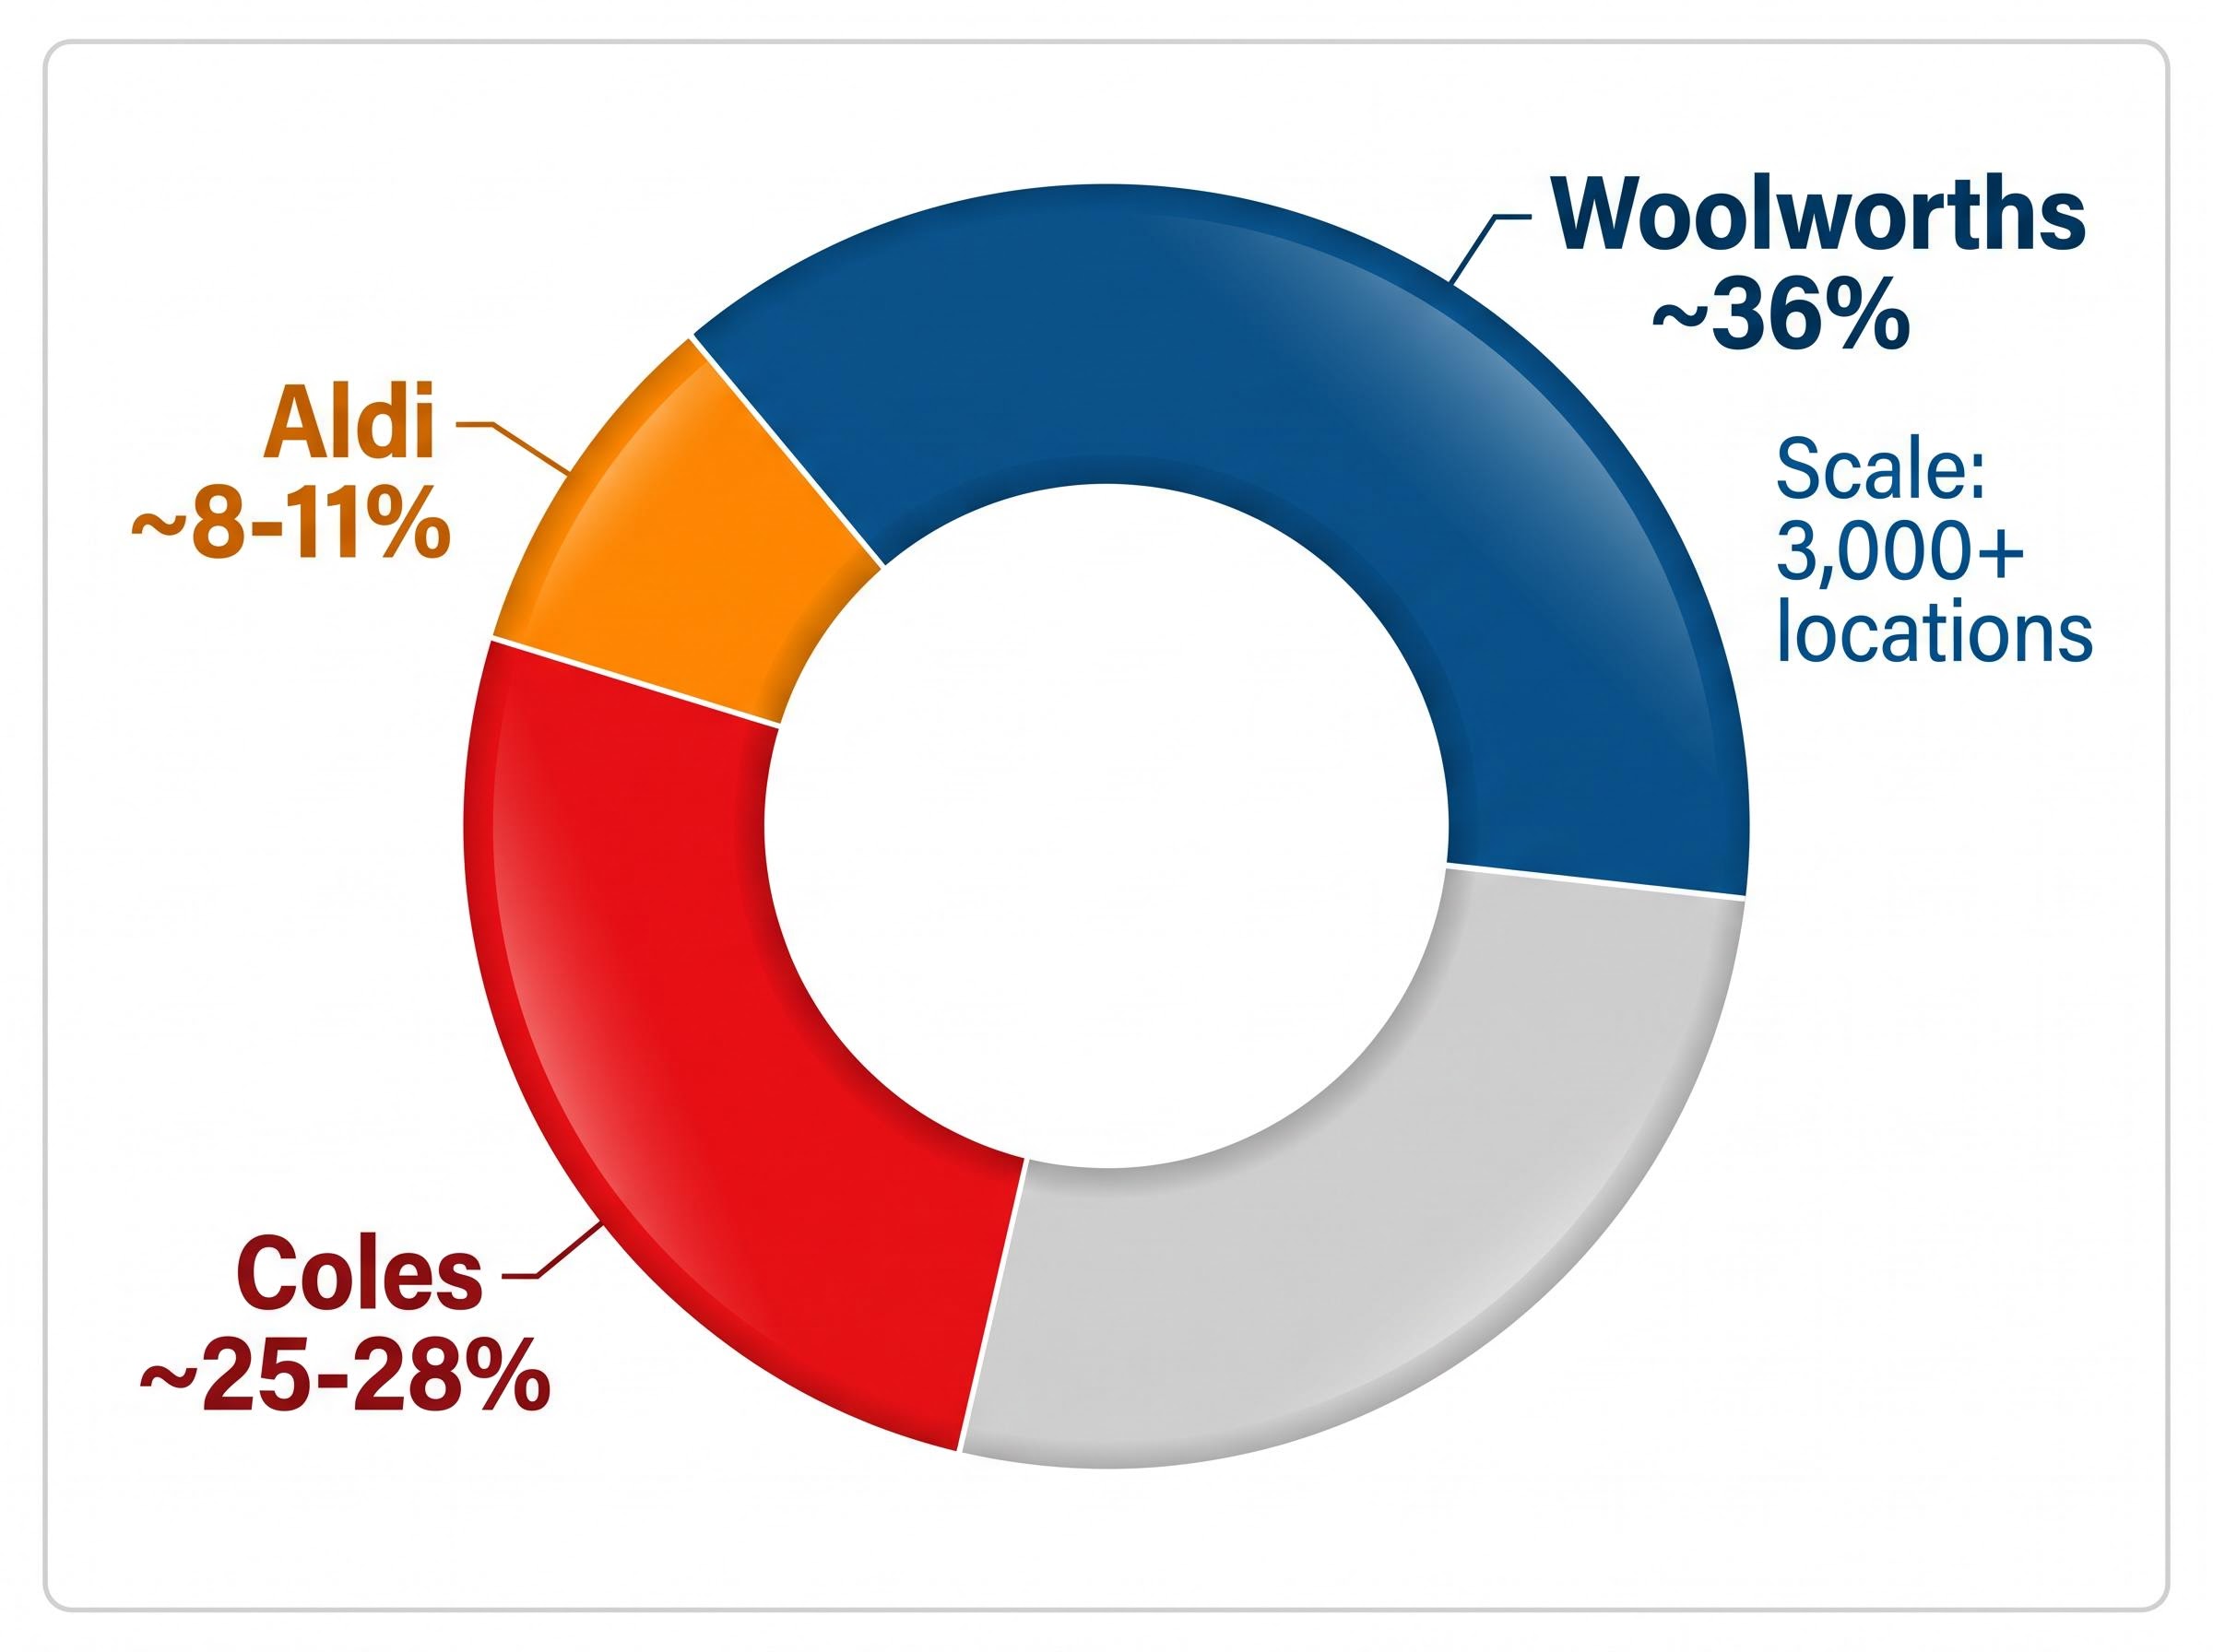
| Retailer | Estimated Market Share | Key Competitive Lever | Primary Risk to Woolworths |
|---|---|---|---|
| Woolworths | ~36% | Scale, store network (3,000+ locations), eCommerce | N/A |
| Coles | ~25-28% | Loyalty programmes, fuel discounts, promotional pricing | Direct competition on price and promotions |
| Aldi | ~8-11% | Everyday low pricing on staple items | Consumer trade-down during cost-of-living pressure |
Woolworths’ approximately 36% national grocery market share provides structural revenue durability, but it does not insulate margins from cost pressures. Rising wages, energy prices, and supply chain expenses squeezed FY25 results. H1 FY25 underlying NPAT fell 20.6% to A$739 million, confirming the trough.
The ACCC supermarkets inquiry final report, published in February 2025, addressed pricing practices across major Australian chains. Parliamentary scrutiny of whether supermarkets passed cost increases on to consumers beyond input cost rises has created reputational and regulatory risk that investors should factor into any forward earnings model.
ACCC pricing scrutiny of the supermarket sector has produced mixed legal outcomes: the Federal Court found Coles’ 245 examined price increases were commercially justifiable on the basis of supplier cost rises, yet simultaneously found the Down Down promotional timing breached consumer law, leaving civil penalty exposure unresolved and the regulatory risk profile of both major chains actively evolving.
The FY26 recovery case rests on management’s guidance for a return to profit growth, the continued scaling of eCommerce (A$9.1 billion in FY25), and the potential margin benefit from consumer trade-down toward private-label products, where Woolworths’ own-brand margins may be stronger if execution is disciplined. The group operates more than 3,000 retail locations and employs more than 100,000 staff, a cost base that limits the speed of margin recovery even if revenue holds.
Beyond the rally: the case for and against Woolworths shares at A$34.70
The bull case:
- Dominant market position with approximately 36% grocery share and more than 3,000 locations
- Fully franked dividends with a progressive policy and a yield of 4.18%, sitting 43% above the five-year average
- Management-guided FY26 profit recovery, supported by eCommerce growth and potential private-label margin benefits
- Defensive sector characteristics attract capital rotation during market uncertainty
The bear case:
- FY25 normalised NPAT fell 17.1% to A$1.385 billion, and competitive and regulatory pressures are structural, not cyclical
- The share price has already recovered 17.2% from its lows; at approximately A$34.70, the easier portion of the recovery may have passed
- ACCC and parliamentary scrutiny of pricing practices creates ongoing regulatory overhang
- Group sales of A$69.1 billion (up 3.6% normalised) show revenue resilience, but margin compression could persist if cost pressures do not ease
Franking credits and gross yield: the number Australian investors need to calculate
For Australian resident taxpayers, the headline cash yield understates the total return. The gross yield calculation adjusts for franking credits: cash yield divided by (1 minus the corporate tax rate). At a cash yield of 4.18% and a corporate tax rate of 30%, the gross yield is approximately 5.97%.
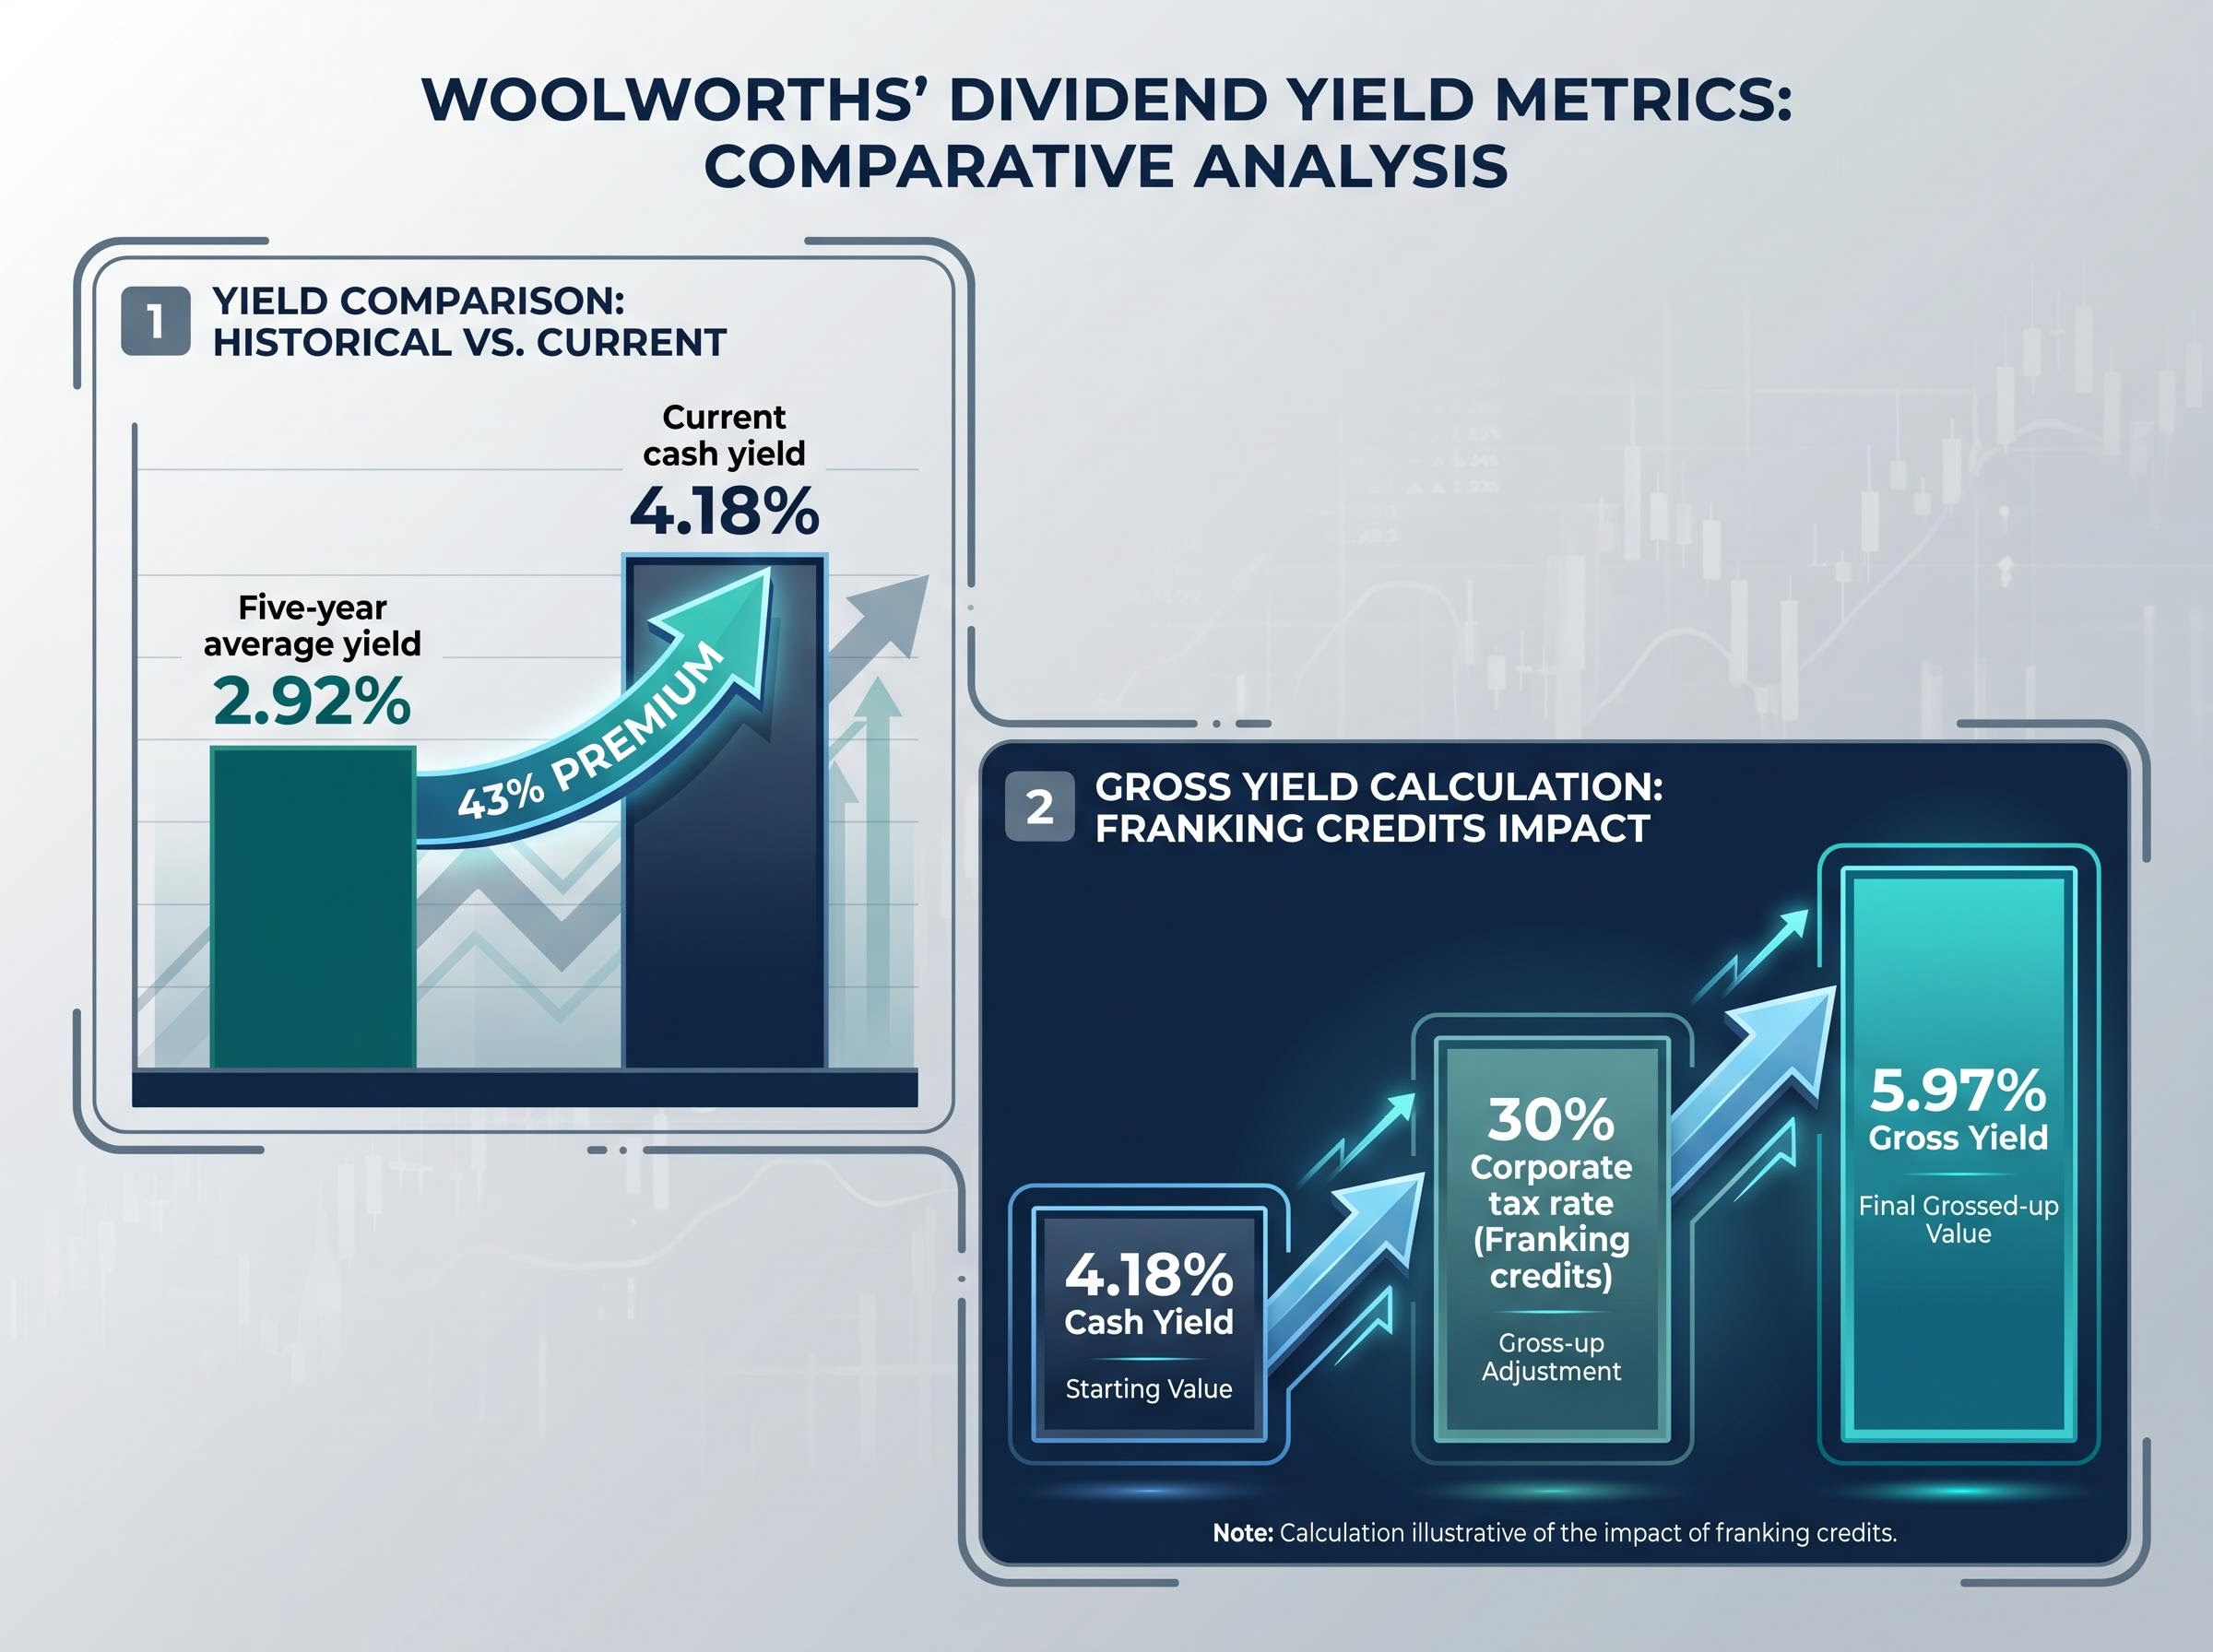
This benefit is most pronounced for investors on lower marginal tax rates, who may receive a franking credit refund. For investors above the top marginal rate, the franking credit provides a partial tax offset. Tax-exempt entities derive no benefit. Investors should calculate their individual after-tax yield before comparing Woolworths to non-franking income alternatives.
A grossed-up yield comparison across income alternatives, including term deposits, government bonds, and other ASX dividend payers, changes the rankings materially for Australian resident investors, since non-franked instruments offer no equivalent tax credit offset and must deliver a higher pre-tax nominal yield to match the after-tax income of a fully franked dividend at the same cash rate.
Three questions to answer before buying or holding at the current price:
- Is the current dividend payout sustainable given FY25’s earnings decline and the absence of explicit forward DPS guidance?
- Is management’s FY26 profit recovery narrative credible given ongoing competitive and regulatory headwinds?
- Does the implied growth rate embedded in the current share price (approximately 3.8-4.8% at reasonable required return assumptions) align with Woolworths’ realistic growth capacity?
What the data tells investors about Woolworths shares right now
A 4.18% yield sitting 43% above the five-year average is a signal worth investigating, not celebrating uncritically. The investigation requires both model-based and qualitative analysis, and neither alone is sufficient.
Woolworths’ progressive dividend policy, fully franked distributions, and dominant market position provide a durable income foundation. But FY26 earnings delivery will be the test of whether the current price of approximately A$34.70, still roughly 9% below the 52-week high of A$38.24, is justified. Management has guided for a return to profit growth; if that guidance is met, the elevated yield may prove to have been a genuine opportunity. If FY26 disappoints, the payout ratio question becomes more urgent.
Investors should revisit valuation assumptions when FY26 full-year results are released (expected August 2026) and after any further ACCC or regulatory developments that could affect cost structures or pricing flexibility.
For investors wanting to understand where Woolworths sits within a broader defensive allocation framework, our dedicated guide to ASX consumer staples portfolio construction examines the sector’s beta of approximately 0.55-0.6, its maximum drawdown record relative to the ASX 200, and the specific scenarios where a low-return, high-income sector earns its place in a portfolio despite multi-year price underperformance.
This article is for informational purposes only and should not be considered financial advice. Investors should conduct their own research and consult with financial professionals before making investment decisions. Past performance does not guarantee future results. Financial projections are subject to market conditions and various risk factors.