The 10-year Treasury yield sits near 5.24% while the odds of an October Federal Reserve rate hike have collapsed to roughly 17%, from around 70% a week earlier. Falling hike odds are supposed to pull yields down, and the fact that they have not is a signal many investors are misreading when they ask what markets are signaling.
US data is sending two opposite messages. The S&P Global services PMI (a monthly business survey where readings above 50 mean expansion) hit 58.7, yet the jobs data is weak and consumer confidence sits at its lowest since 2014. Stocks, the dollar, gold, oil and Bitcoin are each reacting differently, with the next Federal Open Market Committee (FOMC) meetings on 28 October and 9 December.
Here is a framework for reading yields, Fed pricing and cross-asset moves together, plus a view on what the gap between the market and the Fed means for your positioning.
Why are US data readings pointing in opposite directions?
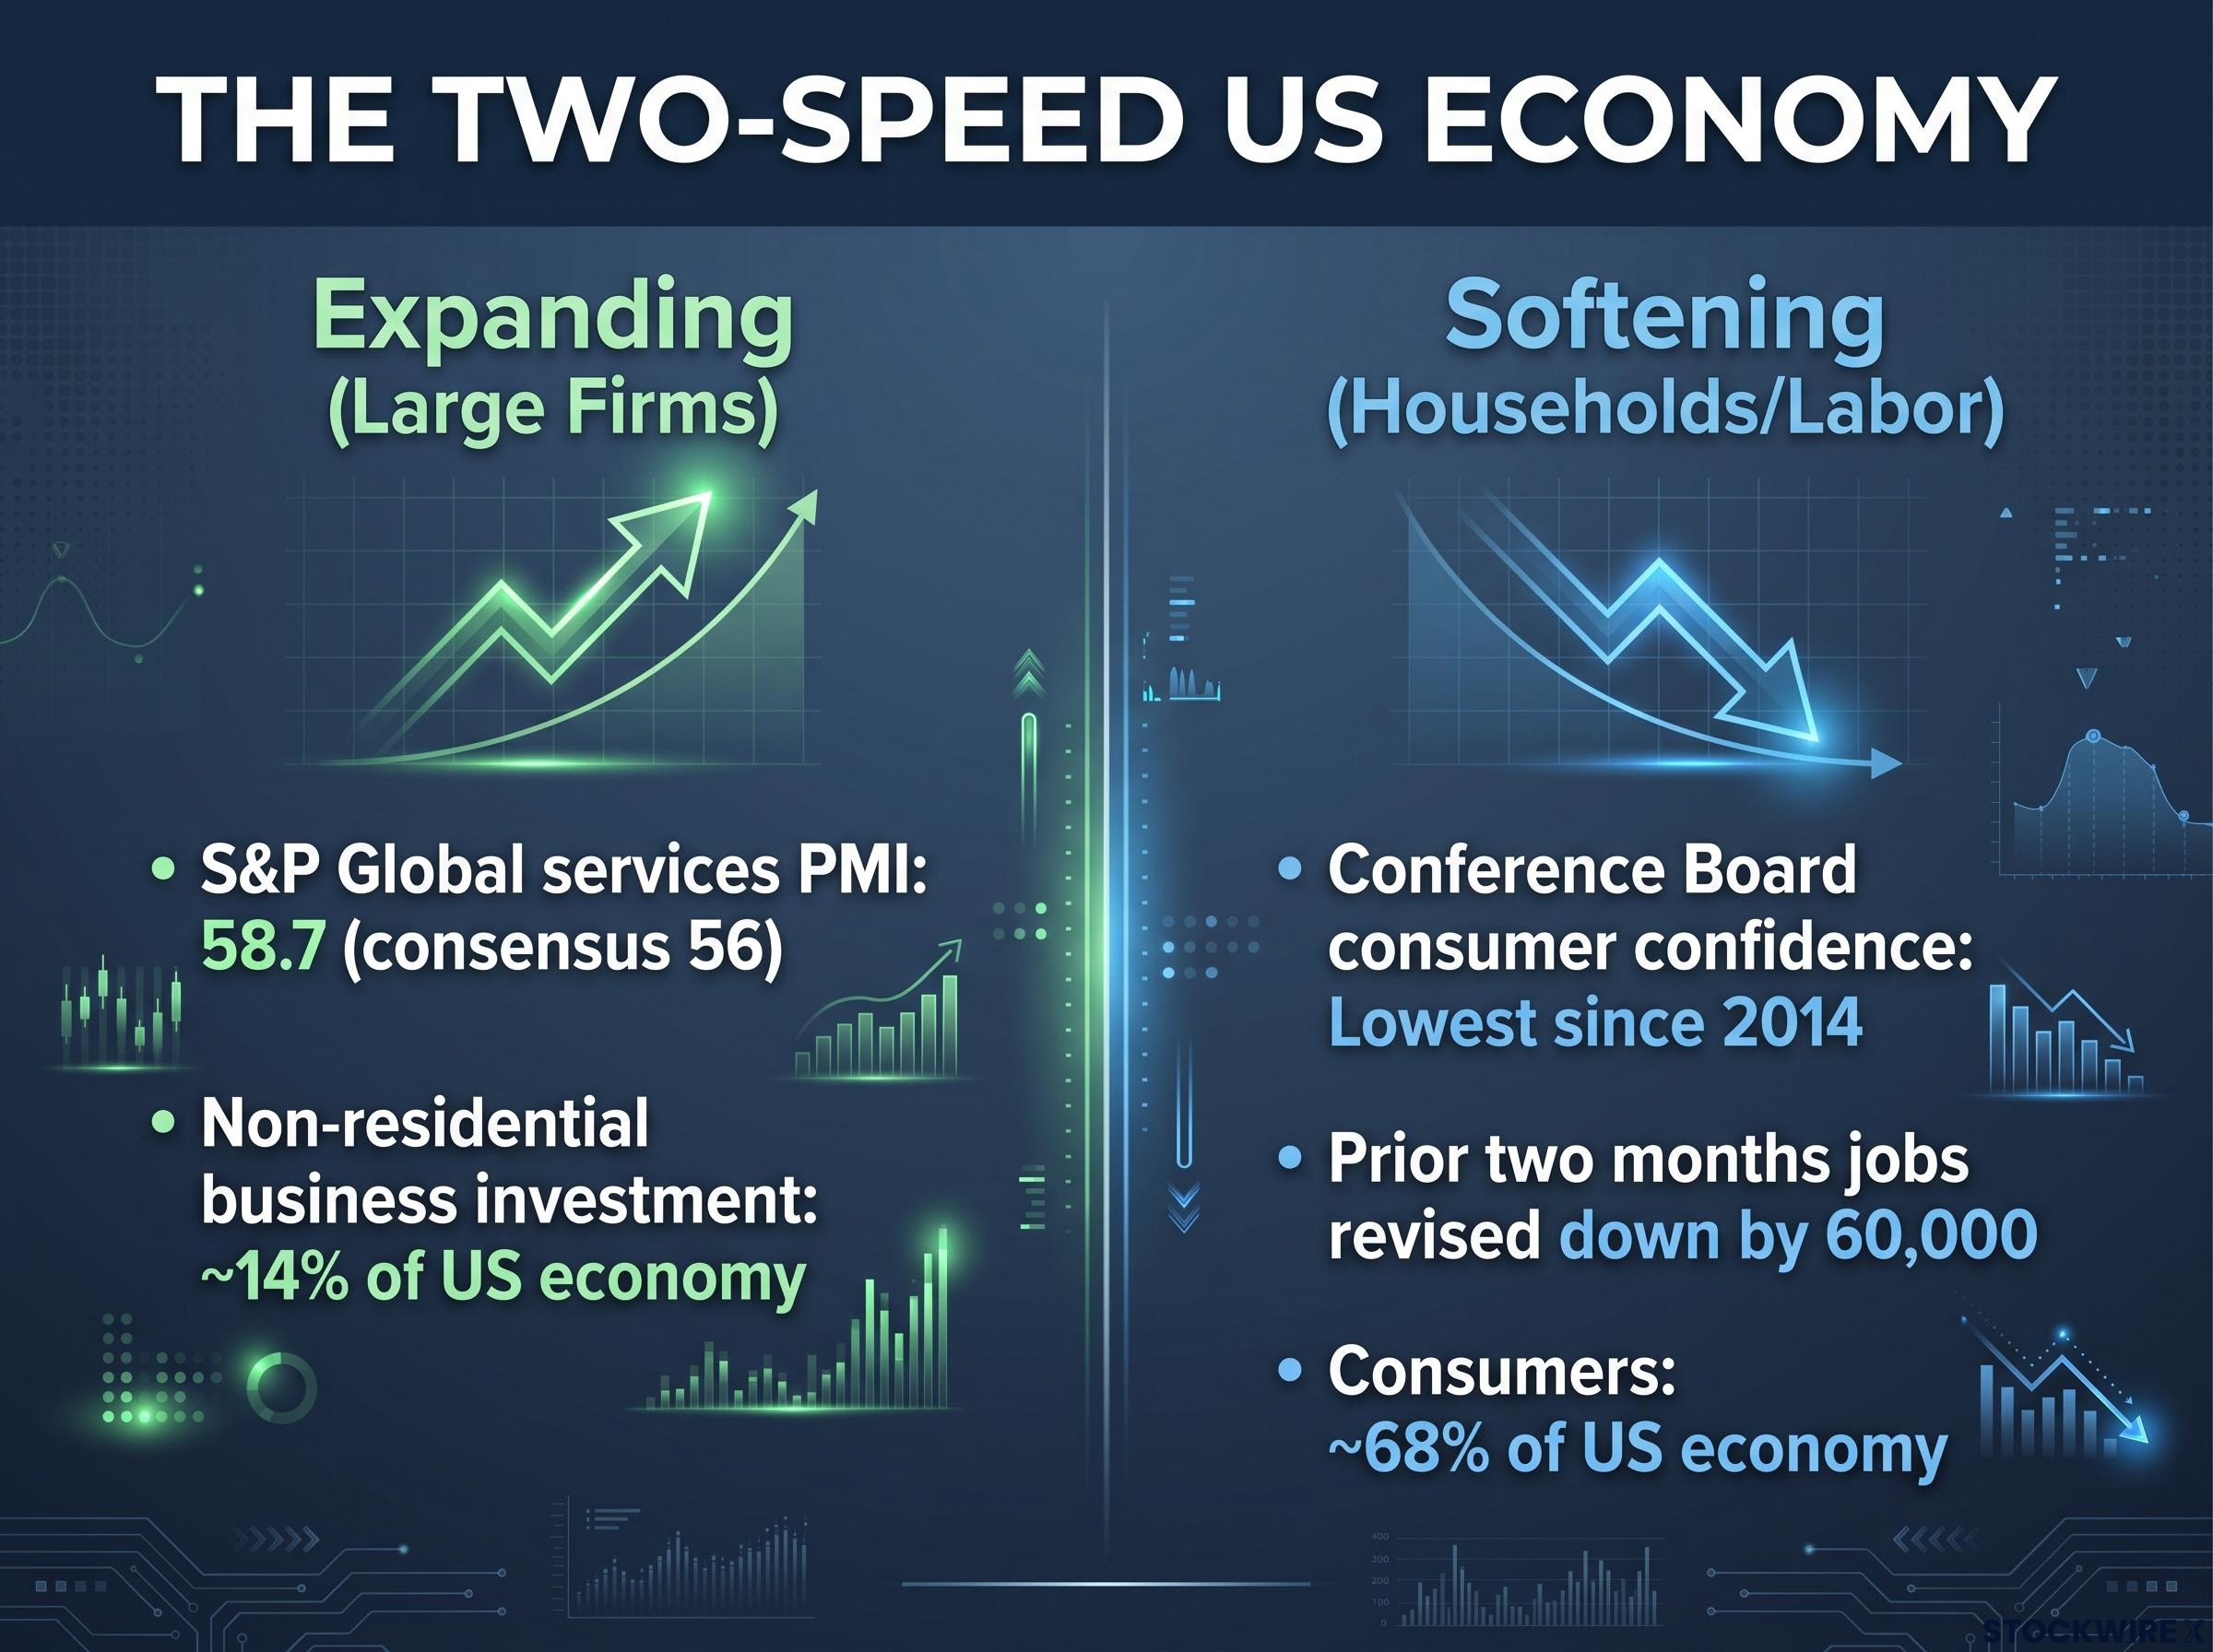
The gap is jarring. The S&P Global services PMI rose to 58.7 in September from 56.5 in August, against a consensus of 56, which is reported as the strongest services expansion in over five years. Meanwhile the Conference Board’s consumer confidence reading was the lowest since 2014.
Look at the pattern and it resolves into a two-speed picture. Large, demand-rich firms are expanding: S&P Global reported new orders at their fastest pace in more than four years and employment growth at its highest since June 2022. Households and the labour market are soft, with Friday’s jobs report weak and the prior two months revised down by 60,000.
| Indicator | Latest reading | Expectation or prior | Signal |
|---|---|---|---|
| S&P Global services PMI | **58.7** | **56** consensus | Strong |
| ISM Services | **54.9** | **55** expected | Solid, slightly soft |
| ISM Manufacturing (unverified) | **54.5** | **54.6** in August | Expanding |
| Conference Board confidence | Lowest since **2014** | Not available | Weak |
| Atlanta Fed GDPNow, Q3 | **3.7%** | Above **5%** earlier | Softening |
Even the strong surveys have cracks. ISM Services employment rose from 47.8 to 50.1 while business activity fell, and S&P Global flagged input cost inflation at its highest in nearly four years, linked to fuel and transport costs from the war in Iran. Three-month annualised PCE inflation sits near 2%, trending lower since a May peak.
The weight problem Consumers are about 68% of the US economy. Non-residential business investment, where the AI buildout sits, is about 14%.
That arithmetic is the point. A single strong survey is not proof of broad strength, and soft household data matters more to the cycle than a headline PMI.
Weak household sentiment alongside strong aggregate surveys fits a K-shaped consumer recovery, in which higher-income spending props up the headline numbers while lower-income households draw down savings.
Could survey timing explain the gap?
The size of the divergence between S&P Global and the ISM and consumer data has raised doubts about survey methodology and release timing. That remains an open question, not a conclusion. Payroll and unemployment-rate figures were not available in the research, so the labour picture rests on the revisions and the reported weak internals.
When big ASX news breaks, our subscribers know first
How can hike odds collapse while long yields keep climbing?
On a screen it looks like a contradiction. October hike odds fell to about 17% (CME FedWatch showed 82.8% for no change, via a secondary source) after a softer jobs report and cooling inflation, yet the 10-year held near 5.24%.
December is a different story. Sources range from about 69% to about 96% for a hike, and the differences may reflect dates or methodology, so treat it as still a meaningful probability.
| FOMC date | Market-implied hike odds | Source caveat |
|---|---|---|
| **28 October 2026** | About **17%** (from about **70%** a week earlier) | Secondary sources, CME FedWatch via third party |
| **9 December 2026** | About **69%** to about **96%** | Sources conflict; dates and methods may differ |
Pricing for next-year hikes fell from three to two, while the Fed itself projects none. The Fed delivered one of its two projected hikes in September, and J.P. Morgan has reportedly called the cycle “one and done” (secondary-sourced). No latest 2-year yield or 2027 probabilities were found, so none are estimated here.
Long yields respond to more than the next policy meeting. Four forces are at work:
- Term premium: investors want extra compensation for holding long bonds amid uncertainty over inflation, deficits and policy.
- Fiscal supply: large deficits mean heavy bond issuance, and buyers are less price-insensitive than in the quantitative easing era.
- Inflation risk: input-cost pressure in the services survey keeps inflation worries alive.
- Competing readings: higher yields can signal confidence in growth, or a warning that tight policy lasts longer and raises recession risk.
The 10-year is no longer a simple readout of Fed expectations. Falling hike odds are not a reason to assume bond relief is coming, and that matters if you hold long-duration (rate-sensitive) bonds.
The reason a rising yield can mean confidence in one cycle and stress in another comes down to how bond yields move: auction pricing, secondary-market repricing and the inverse link to bond prices all shape what a given reading actually says.
How to read cross-asset signals alongside macro data
Each asset answers a different question. Yields show the price of money and risk, the dollar reflects financial conditions, gold tracks inflation and policy-hedge demand, oil measures cost pressure, Bitcoin gauges risk appetite, and small versus large caps reveal how broad a rally is.
Treat one asset’s move as a hypothesis, then check two or three others plus the data and Fed pricing. When assets confirm each other, the signal is strong. When they diverge, the message is mixed.
Treasury term premium, the dollar and Japanese rate normalisation are three cross-asset signals that increasingly point to the same regime shift, so a stalling DXY should be read alongside long yields, not on its own.
| Asset | Recent level (unverified) | What it tells you |
|---|---|---|
| 10-year Treasury | About **5.24%** | Money is expensive; term premium is live |
| US dollar index (DXY) | About **101.93**, third straight weekly gain | Financial conditions are tight |
| Gold | About **$4,140**, roughly **26%** below its January record | Inflation-hedge demand is cooling |
| Oil | WTI about **$91**, Brent about **$102** | Cost pressure persists, though framing differs |
| Bitcoin | About **$85,500**, **$241M** weekly ETF inflows | Risk appetite persists |
Oil needs care. One source places crude in a range of roughly $88-$95 and says it was not driving inflation worries, while another says oil above $100 (Brent) helped prompt the Fed’s hike. The gap is largely WTI versus Brent, plus a disagreement over oil’s role.
Putting the framework to work today
A firm dollar and high yields point to tight conditions. Gold off its highs suggests softer inflation-hedge demand, and Bitcoin inflows show risk appetite has not gone away.
Those readings agree more than they conflict, and the message is tight money with a market still willing to take risk.
What do stocks, small caps and the Fed-versus-market gap imply for investors?
Equities are resilient but uneven. The Nasdaq pushed above a range ceiling in place since June, though momentum indicators show divergence, while the S&P 500 stayed below its mid-August top. The Russell 2000, the index most pressured by higher yields, has been in a downtrend since mid-August beneath former support.
Reported levels (unverified) are the S&P 500 near 7,722, the Nasdaq 100 near 30,808 and the Russell 2000 near 2,833.
The gap that matters Markets price two hikes next year. The Fed projects none.
A repricing in either direction could lift volatility. The key risks:
- Policy-error risk: hikes into softening data, with confidence at its lowest since 2014, raise overtightening concerns. Cited analogues are late 2018, the 1994 bond selloff and the 2013 taper tantrum (general macro history, not 2026 sourced).
- Growth concentration: strength sits in AI and large tech while employment and smaller firms lag.
- Inflation upside: energy and input costs remain a threat even as three-month inflation cools.
“Resilient but uneven” describes a late-cycle, inflation-tilted setup, not imminent recession. Narrow leadership and rate-sensitive names carry risks the index level hides. Considerations from the research include limiting excess long-duration exposure, favouring quality and pricing power, and caution on leveraged names.
Dates to watch, in order:
- FOMC minutes, due Wednesday.
- University of Michigan consumer confidence, due Friday and expected to tick down.
- Q3 GDP report, due by month-end.
- FOMC meeting on 28 October.
- FOMC meeting on 9 December.
Reading the next move: what to watch before the October FOMC
The two-speed economy, the yield paradox and the cross-asset method point to a market that is cautious rather than panicked. Strong surveys and weak households can coexist, and long yields have their own drivers.
Three variables matter most: consumer data, the pace at which December odds are repriced, and whether long yields keep rising when hike odds fall. If they do, the bond market is telling you something the Fed path alone cannot.
Several major research houses now argue that bond market stress, rather than equity selloffs, is the main force shaping Washington’s policy choices, which raises the stakes on whether long yields keep rising as hike odds fall.
Past performance does not guarantee future results, and these statements are speculative and subject to change based on market developments. This article is for informational purposes only and should not be considered financial advice. Investors should conduct their own research and consult with financial professionals before making investment decisions.