
The S&P 500 is on course for 29.5% third-quarter earnings growth, according to FactSet’s 2 October 2026 Earnings Insight, yet bond yields are elevated and still rising. Higher yields normally squeeze what investors will pay for stocks, so the market should look more expensive than it does.
That puzzle sits at the centre of this Q4 market sector outlook. Third-quarter earnings season starts this week, and the year’s winners are clear: US technology and Australian resources. Utilities, consumer cyclicals, banks and real estate have lagged.
Whether you read that split as temporary or structural decides how you position for the final quarter.
Here is what is powering the leaders, why the laggards are lagging, and which risks could break the pattern.
Where is the leadership coming from in 2026?
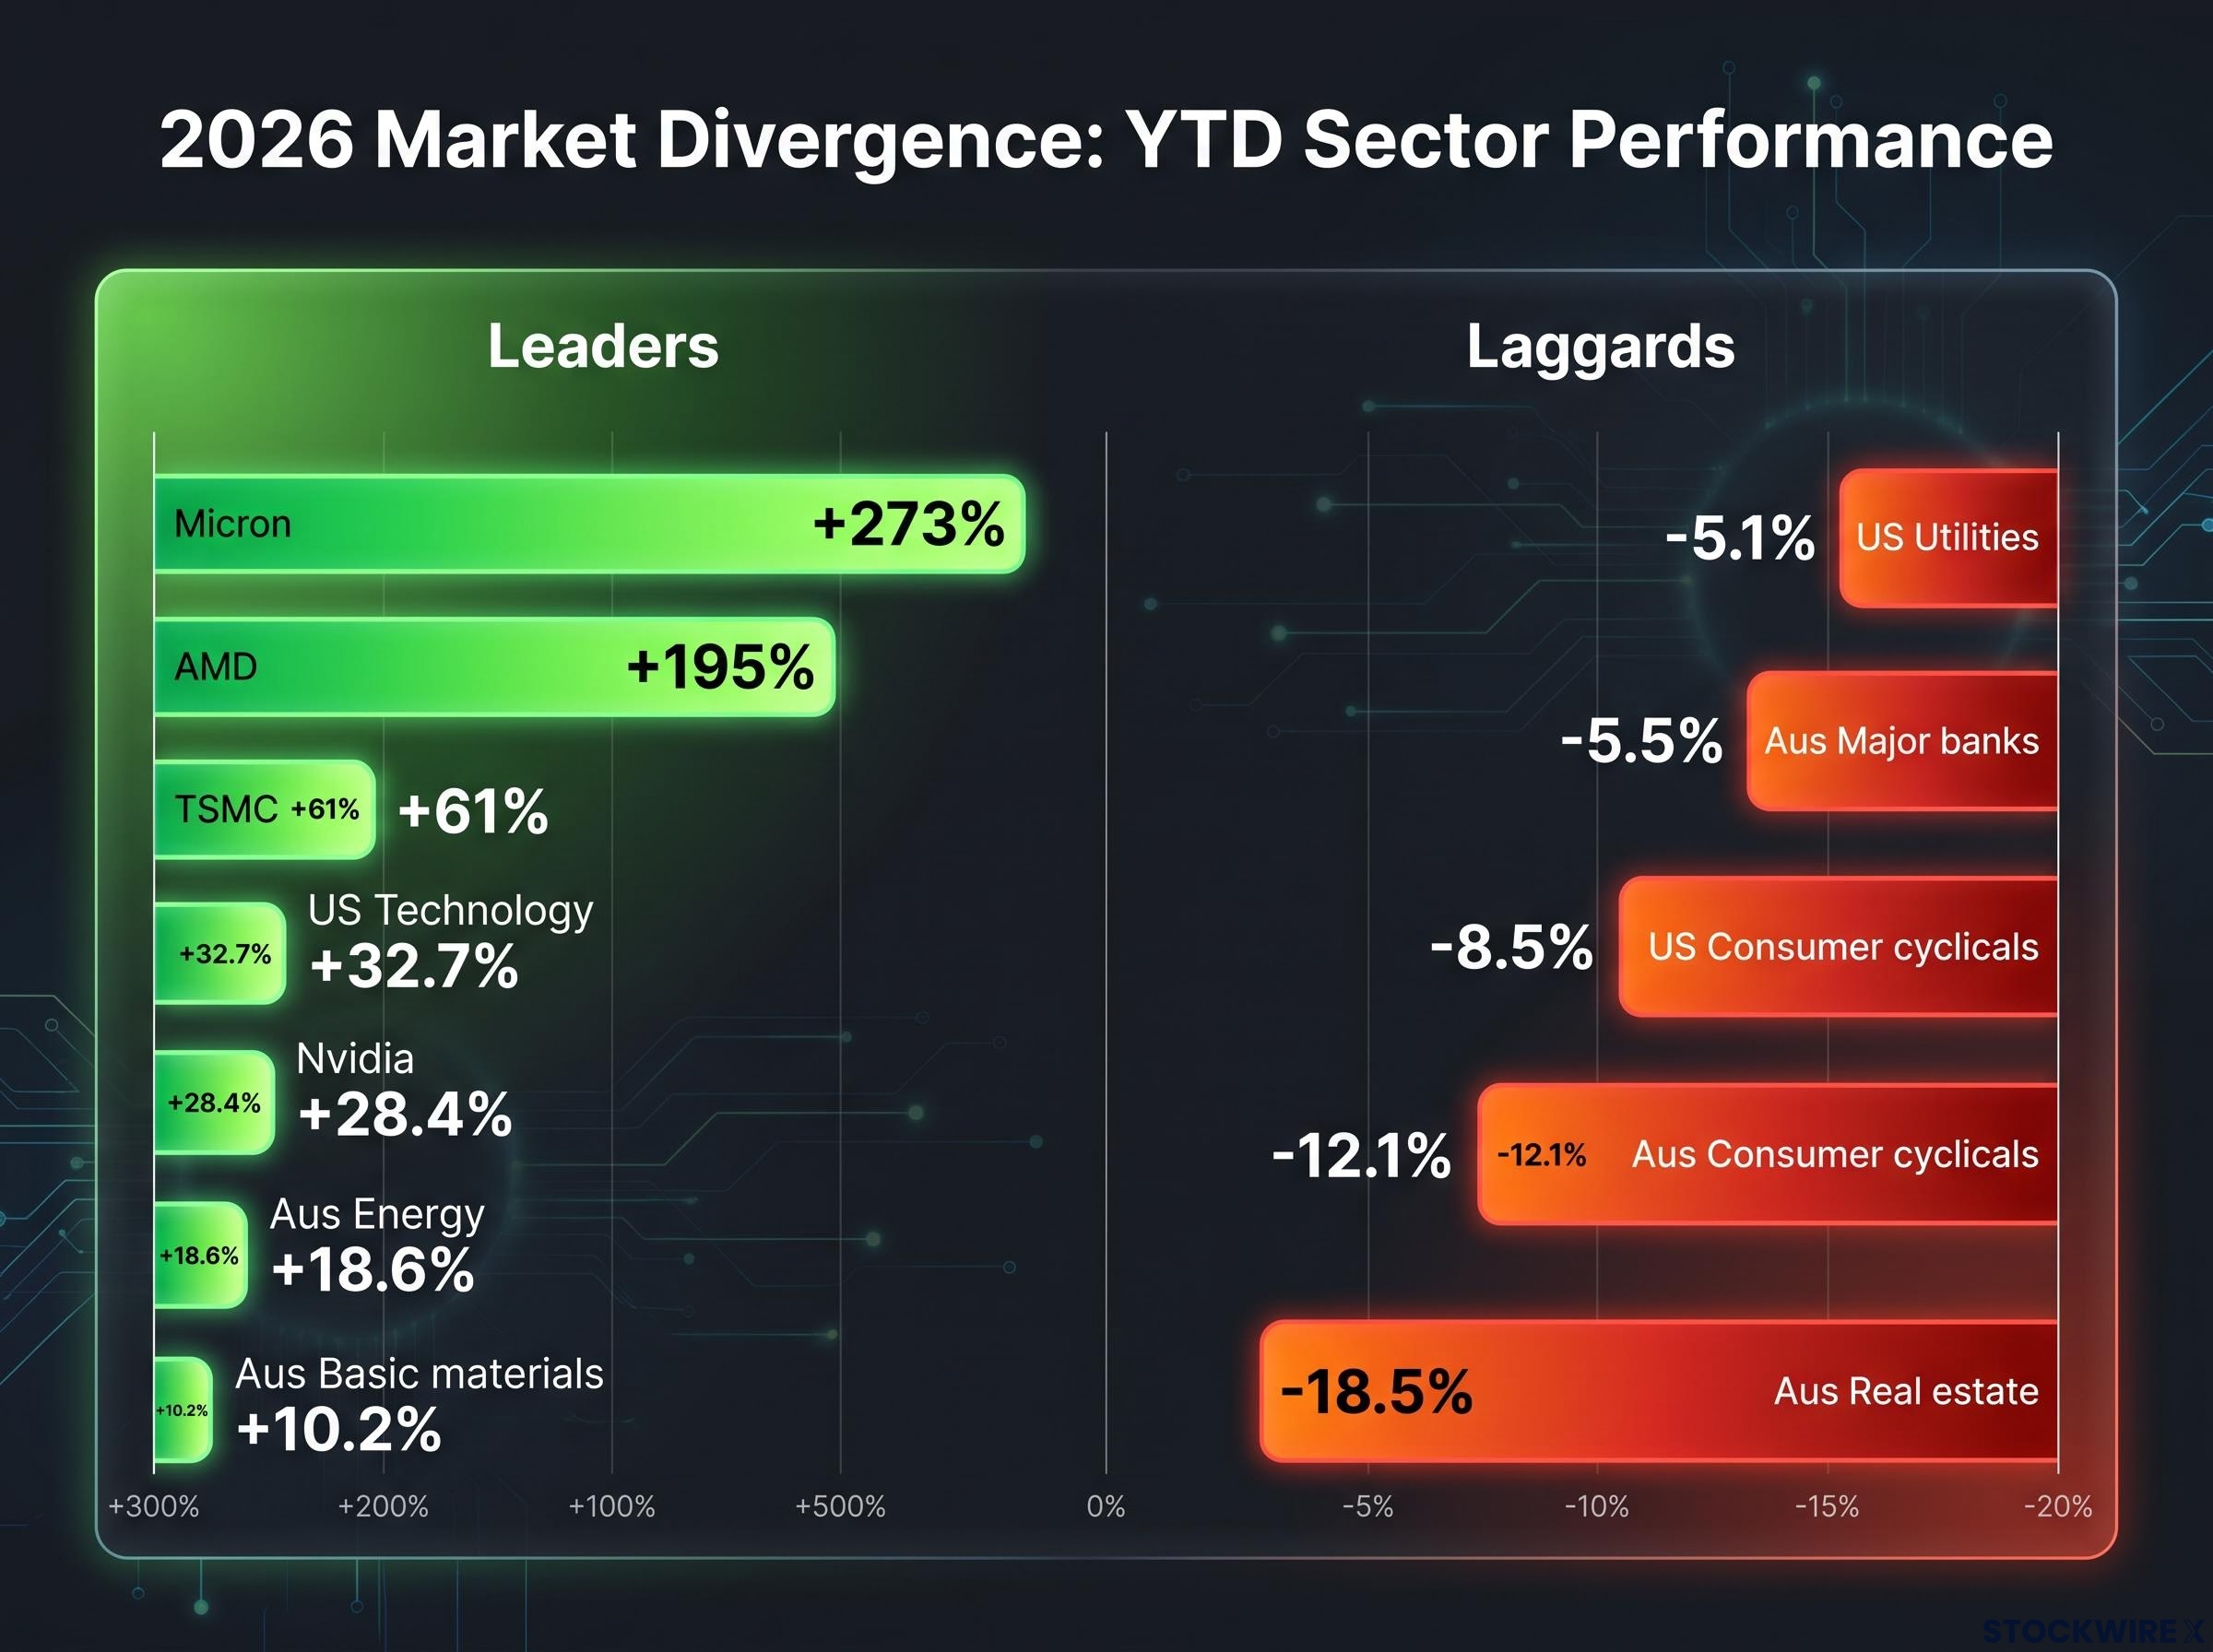
The year-to-date numbers show the scale of the divergence. Using Mumu heat map data, US technology is up 32.7%, driven by semiconductors and memory: TSMC is up 61%, Micron 273%, AMD 195% and Nvidia 28.4%. In Australia, energy has gained 18.6% and basic materials 10.2%.
| Market | Sector | YTD move | Role |
|---|---|---|---|
| US | Technology | +32.7% | Leader |
| Australia | Energy | +18.6% | Leader |
| Australia | Basic materials | +10.2% | Leader |
| US | Utilities | -5.1% | Laggard |
| US | Consumer cyclicals | -8.5% | Laggard |
| Australia | Major banks | -5.5% | Laggard |
| Australia | Consumer cyclicals | -12.1% | Laggard |
| Australia | Real estate | -18.5% | Laggard |
The two markets are parallel expressions of one theme: growth and hard-asset exposure tied to capital spending. Chip makers and miners both benefit when companies pour money into infrastructure.
Profits tell the same story as prices.
Expected Q3 earnings growth: 29.5% Revenue growth is forecast at 12.3%, and this would be the third straight quarter of earnings growth above 25% (FactSet, 2 October 2026).
The sector figures come with a caveat. FactSet’s index-level data gave no sector breakdown, so the expectations of 65% for technology and 114% for energy are as cited by the presenter in the original source. Against them sit consumer discretionary at 3.2%, financials at 3% and consumer staples at 2.9%.
What this tells you: when two sectors supply most of the earnings growth, the 29.5% headline overstates how broad the strength really is. Check where the profits sit before assuming the whole market is carrying them.
Headline figures can also mislead through accounting effects: adjusted earnings growth in Q2 was roughly 30-32% once non-recurring investment gains at Alphabet and Amazon were stripped out, a reminder to check what sits beneath the total.
When big ASX news breaks, our subscribers know first
How can earnings growth outrun higher yields?
Rising yields should compress valuations. Yet the S&P 500’s 12-month forward price-to-earnings (P/E) ratio, the index price divided by expected earnings over the next year, is 19.0x. That sits below the 5-year average of 19.8x and just under the 10-year average of 19.1x.
The arithmetic runs in steps:
- Yields rise.
- Investors apply higher discount rates, the returns they demand to wait for future profits.
- Multiples come under pressure.
- Earnings estimates rise at the same time.
- Prices can climb while the P/E ratio still falls, because the “E” grows faster than the price.
The research did not quantify current US Treasury or Australian 10-year yield levels, so the yield environment is described only as elevated and rising, per the source. The earnings side is better documented.
| Date | Earnings growth | Revenue growth |
|---|---|---|
| 30 June | 26.7% | Not cited |
| 18 September | 28.9% | 11.9% |
| 25 September | 29.1% | 12.1% |
| 2 October | 29.5% | 12.3% |
FactSet also shows the calendar 2026 bottom-up earnings-per-share estimate rising 6.1% between 30 June and 31 August, to US$361.38 from US$340.49. Analysts have lifted estimates for two straight quarters.
A below-average multiple is not a guarantee of safety. It only holds if those estimates are delivered, and after repeated upgrades the bar is higher than it was in June.
A below-average multiple looks less reassuring once the equity risk premium is considered, since the S&P 500 earnings yield and the 10-year Treasury yield have converged to roughly the same level.
What do the laggards say about the market’s rotation?
The weak sectors are not random. Each is a logical casualty of higher financing costs, the mirror image of growth and capex-linked leaders.
- Utilities (US, -5.1%): they behave like bond proxies, so dividends look less attractive as yields rise, and higher financing costs press on capital spending.
- Consumer cyclicals (US -8.5%, Australia -12.1%): higher borrowing costs for households and businesses dampen big-ticket and discretionary spending.
- Major banks (Australia, -5.5%): margin benefits can be offset by credit-quality concerns, slower loan growth and cycle risk.
- Real estate (Australia, -18.5%): property values and capitalisation rates move with financing costs, so higher yields push asset values down.
Earnings expectations fit the pattern: consumer discretionary 3.2%, financials 3% and staples 2.9%, all far from the growth leaders.
If you hold these sectors, you are effectively making a bet on rates easing. Judge the position against that view, not against earnings alone, because until yields ease the pressure on these sectors looks set to stay.
A sector rotation strategy treats leadership splits like this one as forward-looking signals, since institutional capital tends to reposition weeks or months before official data confirms a shift in the cycle.
Is the data-center build-out durable, and what could break the run?
A real-world example: Southern Cross Electrical Engineering
Southern Cross Electrical Engineering (ASX: SXE) shows the capex theme turning into orders. Macquarie initiated coverage with an Outperform rating and a $5.60 target, estimating more than $60 billion of Australian data-center projects are underway or likely.
Macquarie’s pipeline estimate: more than $60 billion A multi-year programme covering power, cooling, cabling and electrical work points to a structural cycle, not a one-year spike.
| Metric | Figure | Context |
|---|---|---|
| Data-center pipeline | About $1B | Potential opportunities SXE is tracking |
| Data-center revenue | About $120M (FY26) | Macquarie sees a path to triple in FY27 |
| FY27 EBITDA guidance | At least $100M | FY26 underlying: $77M, up 40.5% |
| Order book | $810M | Record, end of FY26 |
| Cash | $261.5M | No debt |
Data centers make up about 20% of non-residential building approvals. Reports on the share price reaction conflict: Proactiveinvestors had SXE up about 8% to $5.24 on 5 October, while the original source cited about 19.7% in the Monday session, possibly reflecting different points in the day.
The pipeline, order book and balance sheet are the tests for any thematic claim. But a stock that jumps sharply on one broker note carries more risk than a multi-year pipeline implies.
For readers weighing the Macquarie pipeline figure, our deep-dive into Australia’s data centre market explains why the A$60 billion is a scenario ceiling, not a forecast.
Four risks to the Q4 view
Mumu’s strategist expects US tech and Australian resources to keep outperforming into Q4. These risks could break that:
- Expectations risk: repeated upgrades mean any miss in tech, energy or consumer results could trigger outsized reactions.
- Concentration and AI capex digestion: leadership rests on a few mega-caps, and AI spending could pause.
- Rate risk: sticky inflation or restrictive central banks would hit valuations, rate-sensitive sectors first.
- Commodity risk: energy and resources earnings track iron ore, LNG and oil prices.
Optimists and sceptics frame these differently. Those views are synthesised from recurring themes, not specific October 2026 notes, and are speculative and subject to change.
Reading the Q4 setup: leadership with conditions attached
Upgraded earnings, a forward P/E below its 5-year average and a multi-year data-center pipeline support continued leadership in growth and capex-linked sectors. Rate-sensitive sectors stay challenged until yields ease.
Watch three things: whether upgrades continue, how tech and energy results land against elevated expectations, and which way yields move. Delta Air Lines reports this Friday and the major banks follow the week after, offering early signals.
No named strategist notes were available and yield levels were not quantified, so treat this as a framework, not a forecast.
This article is for informational purposes only and should not be considered financial advice. Investors should conduct their own research and consult with financial professionals before making investment decisions. Past performance does not guarantee future results.