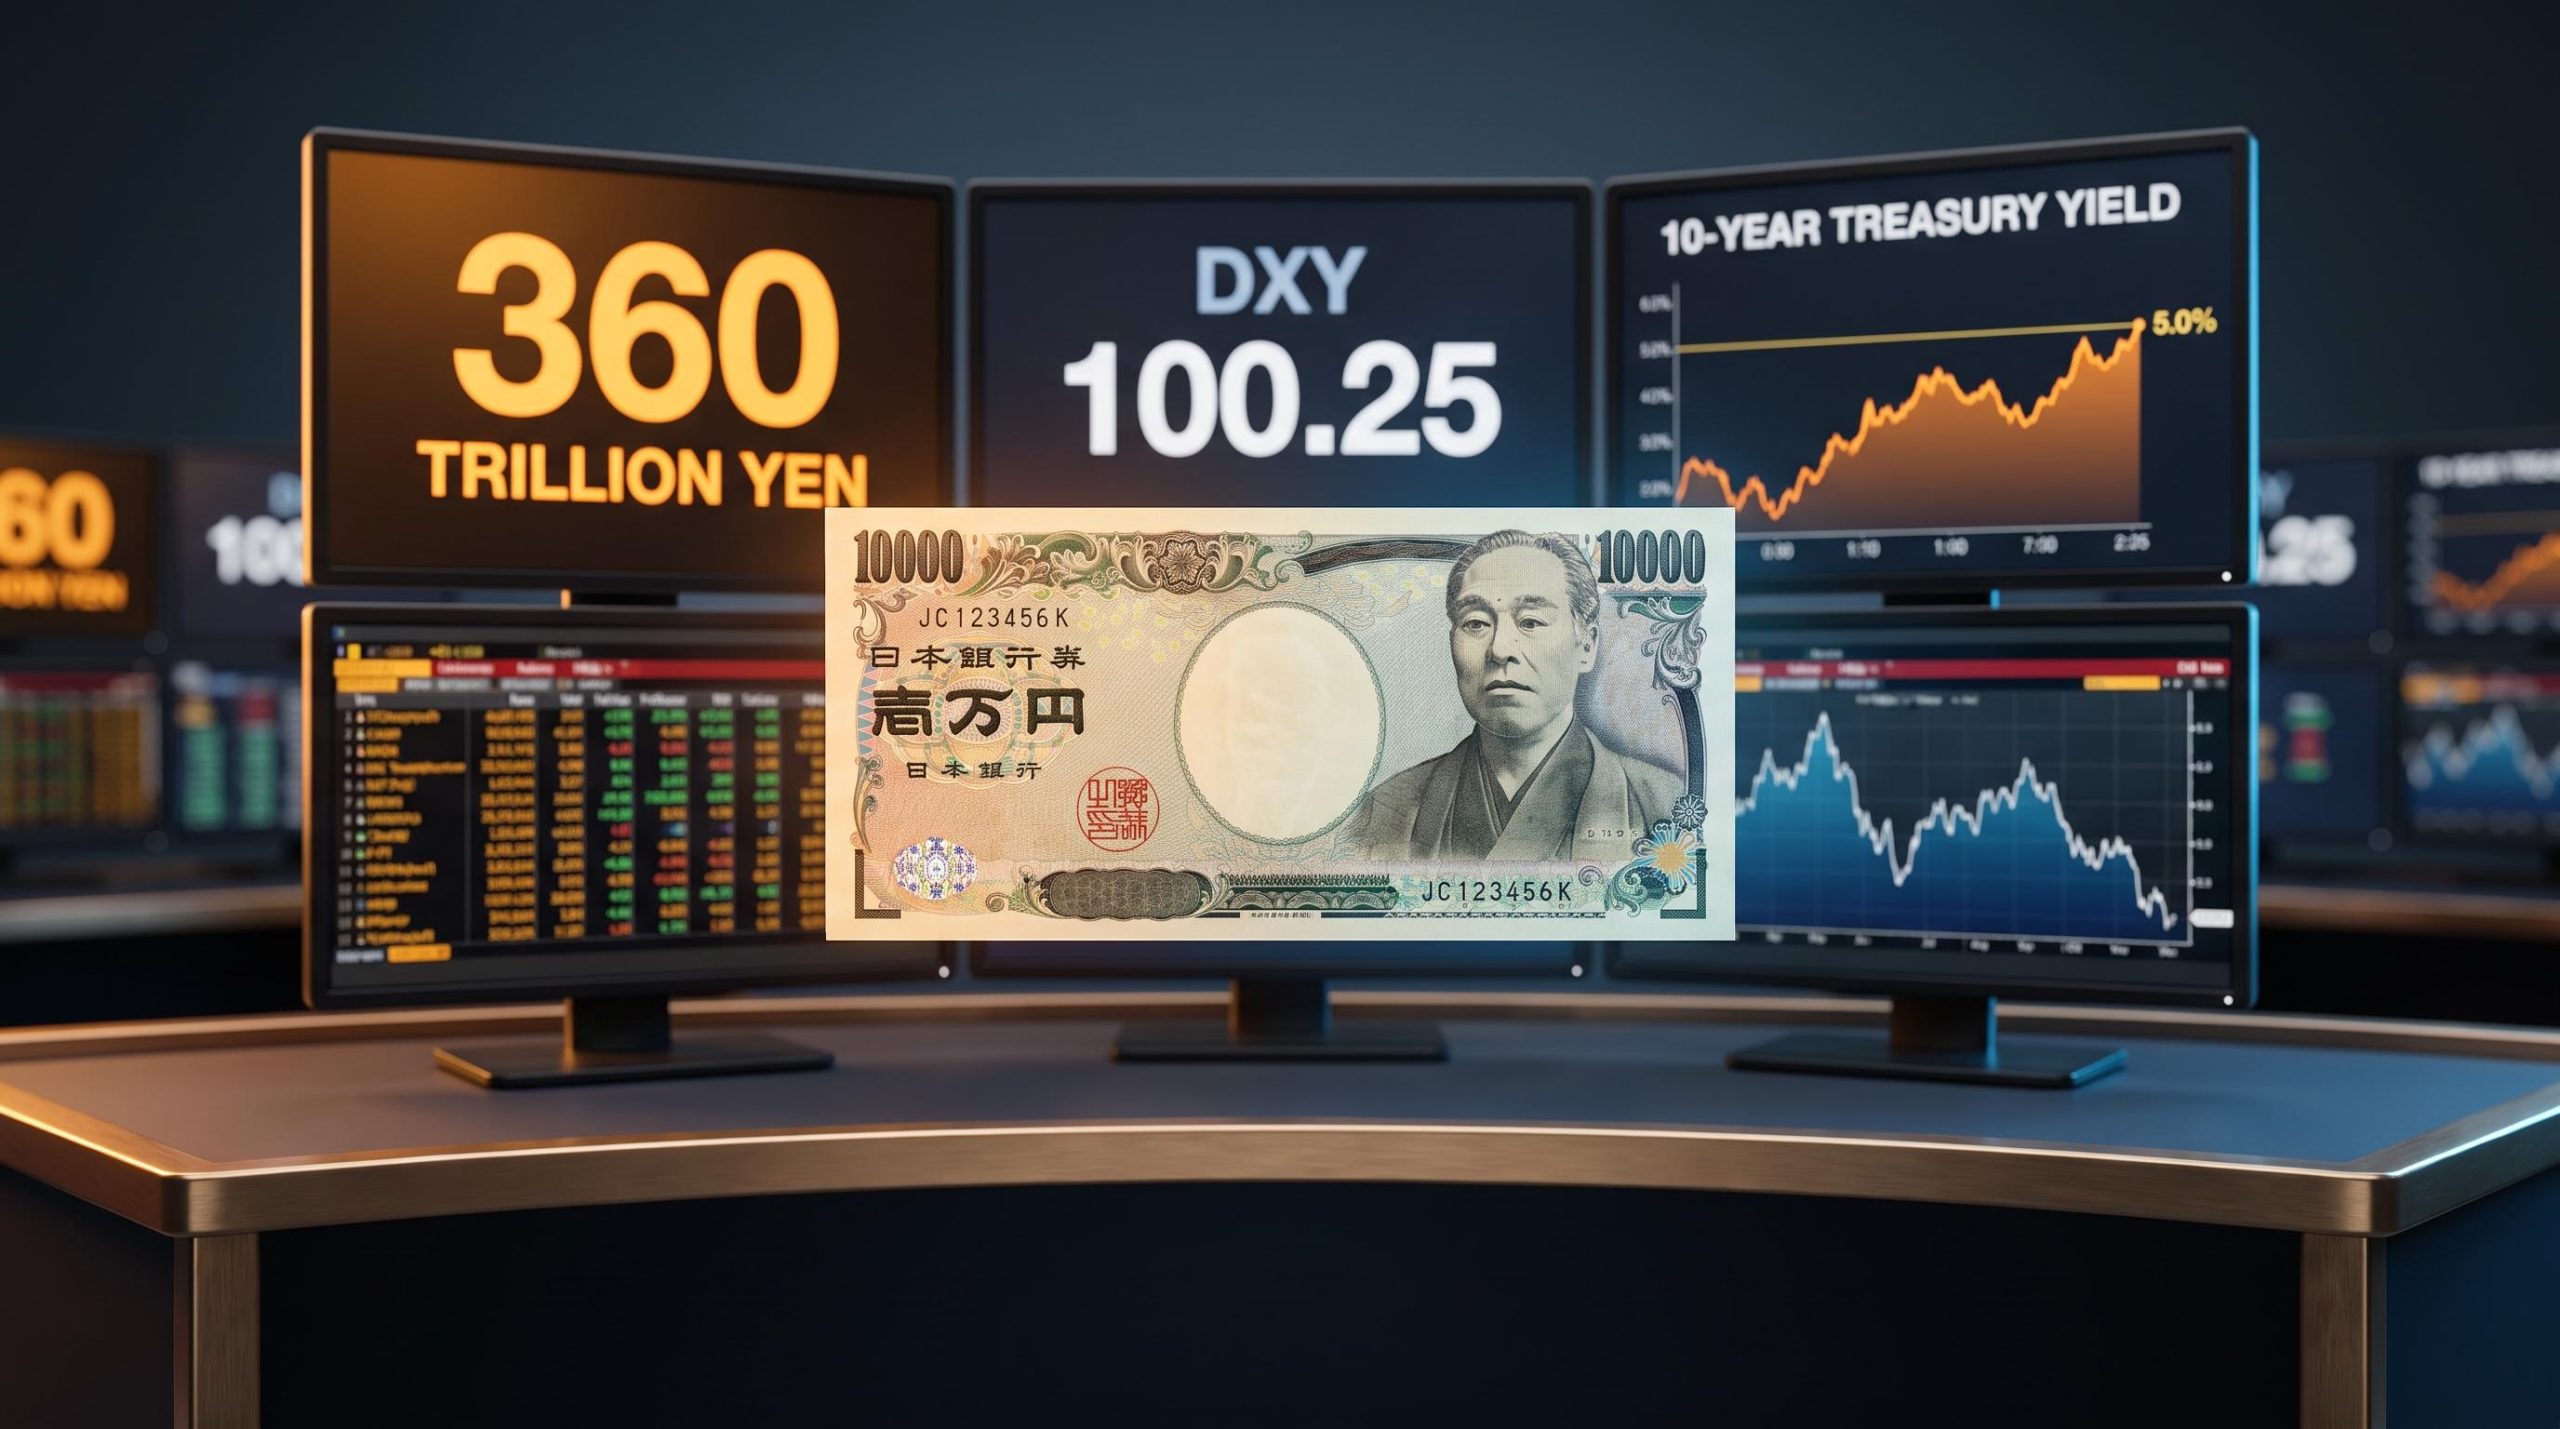
Three central bank stories are converging at once, and each one complicates the standard playbook. The Bank of Japan is widely expected to raise its policy rate to 1.25% at its meeting on 17-18 September 2026. Long-duration Treasuries are flashing momentum divergence even as the 10-year yield sits near 5.0%. And the dollar has stalled precisely at a technically important level, with the U.S. Dollar Index (DXY) reading 100.25.
Individually, each of these cross-asset signals is a familiar macro story. Together, they mark something less familiar: the moment when the Fed-BOJ rate differential has compressed enough to matter, yen carry exposure has swollen to a record 360 trillion yen in cross-border borrowing as of March 2026, and long-end term premium has rebuilt to levels last seen more than a decade ago.
Reading these signals in isolation produces incomplete conclusions. Here is how to interpret each one in relation to the others, and what their intersection means for how a diversified U.S. portfolio should be positioned right now.
Why the BOJ’s next move is already priced in, and why the aftermath is what matters
The September hike is not the question. Markets have spent weeks pricing a move to 1.25%, and short-dated rate expectations across three-month, one-month, and near-term horizons have barely twitched. When the decision prints, the number itself will surprise almost no one.
What markets cannot yet price is the behavioural response of the institutions that built the world’s largest leveraged trade. That is the analytical variable, and it sits downstream of the meeting outcome rather than in it.
Consider how far the corridor has travelled. The BOJ shifted gears deliberately across two years:
- July 2025: a hike to 0.50%, the first in nearly two decades
- December 2025: an increase to 0.75%
- June 2026: a 25-basis-point move to 1.0%, the highest since 1995
- 31 July 2026: held flat at 1.0%
- 17-18 September 2026: markets pricing 1.25%
The cumulative story is what matters. A rate corridor that has reached its highest level since 1995 changes the arithmetic for every position funded in cheap yen, and that is a far larger question than a single 25-basis-point step.
How a carry unwind transmits across asset classes
The scale of the exposure is the anchor here.
Cross-border yen borrowing: 360 trillion yen (approximately $2.34 trillion) as of March 2026. An estimated ¥35 trillion (around $226 billion) in yen forwards is held by hedge funds and principal-trading firms alone.
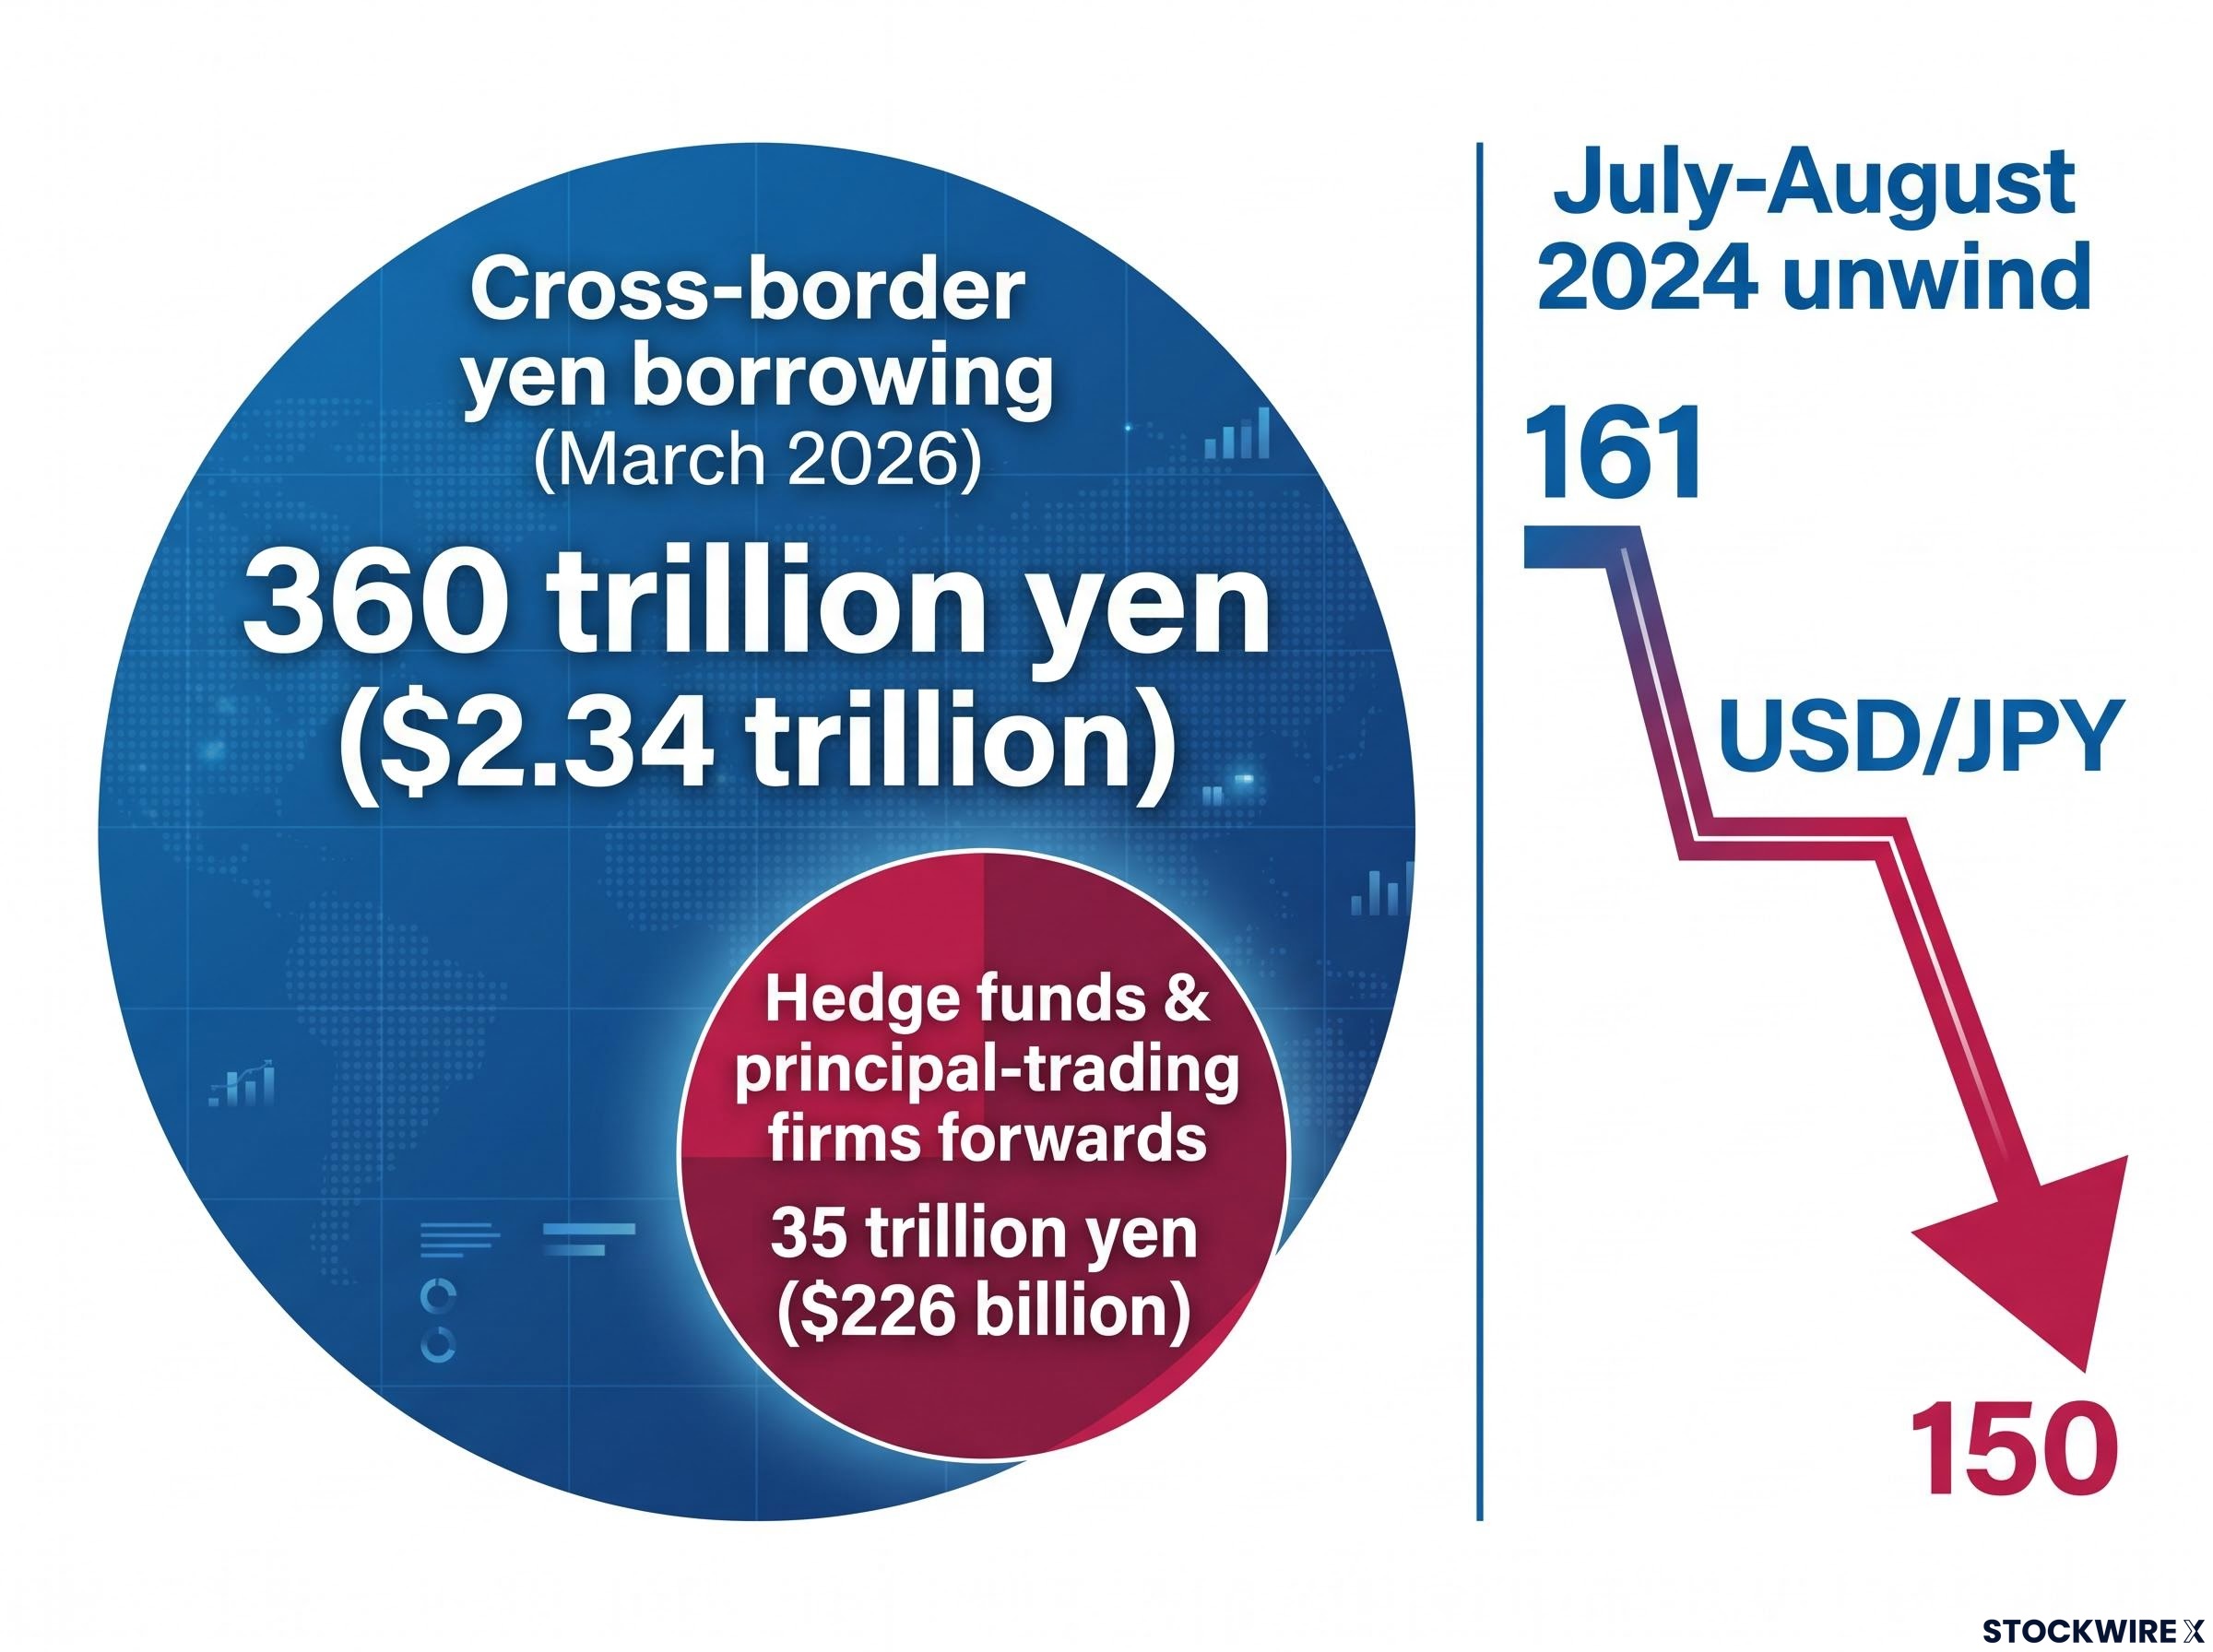
The mechanism is a chain reaction. Rapid yen appreciation triggers margin calls, margin calls force deleveraging of carry positions, and that forced selling spills into global equities, credit, and emerging market currencies. The July-August 2024 unwind showed the template: a BOJ hike helped compress USD/JPY from roughly 161 to 150 in a matter of weeks.
Separating carry unwind systemic risk from headline-driven panic is where most portfolio decisions go wrong; the 2024 episode resolved within weeks with 40-60% of speculative positioning cleared and no cascading structural breakdown, which is the historical template against which the September 2026 setup should be measured.
The International Monetary Fund has warned that carry environments have become “less supportive,” and it points to a non-bank financial institution sector that is now larger and more reliant on derivatives than in prior cycles. BOJ Governor Kazuo Ueda’s commentary on potential yen intervention remains a focus point for exactly this reason.
ING analysis of yen carry trade exposure draws on BIS cross-border claims data to trace how yen-denominated borrowing has expanded since 2021, providing independent quantification of the scale behind the 360 trillion yen figure that underpins the unwind risk discussed here.
The read for you is straightforward: the BOJ is not just setting domestic borrowing costs, it is managing the detonation sequence of a globally significant position. If you hold global equities, credit, or EM currency exposure, the transmission mechanism matters more than the headline rate.
When big ASX news breaks, our subscribers know first
What the bond market’s mixed signals actually mean for duration positioning
The bond market delivered a textbook-shaped signal recently, then made it ambiguous. Long-duration Treasuries were carving out lower lows, but the 14-day rolling average of the Relative Strength Index (RSI), a momentum gauge, refused to confirm those lows. That gap between price and momentum is a divergence, and it typically flags fading downside pressure rather than a durable trend.
The signal resolved higher. TLT, the exchange-traded fund tracking 20-plus-year Treasuries, recovered above a support level it had briefly broken, and the setup was constructive enough to support a call vertical options position with roughly 6-to-1 risk-reward.
Then the structural context complicated the picture. TLT closed at $81.79 on 18 September 2026 on heavy volume of around 56 million shares, with the 10-year yield at 5.0%. Two very different forces are keeping yields elevated, and they call for different responses:
- Fiscal supply and issuance: large deficits, heavy net issuance, and the Fed’s balance-sheet runoff mean more long-dated paper for private investors to absorb.
- Term premium rebuilding: the extra yield investors demand for holding duration, driven by uncertainty about inflation, fiscal credibility, and central bank behaviour.
The St. Louis Fed attributes more than half of the rise in the 10-year yield since late 2024 to an increase in the term premium. San Francisco Fed data as of 15 September 2026 put the term premium embedded in the 10-year yield at 1.31 percentage points.
The term premium rebuild is not a US-specific phenomenon: 10-year JGB yields crossed 3% for the first time since 1996, UK gilts hit their highest since 2007, and Australian 10-year yields reached levels last seen in 2011, all simultaneously, which confirms the structural repricing is a global sovereign debt story rather than a domestic fiscal one.
That distinction is not academic. It determines how you hedge, what instrument you choose, and how long you expect a position to take to resolve.
| Driver | Mechanism | Current reading | Portfolio implication |
|---|---|---|---|
| Fiscal supply pressure | Large deficits and balance-sheet runoff increase long-dated Treasury supply private investors must absorb | Elevated net issuance keeping upward pressure on yields | Structural, slow-moving; a rate cut alone does not clear the overhang |
| Term premium rebuilding | Investors demand more compensation for duration, inflation, and policy uncertainty | 1.31 percentage points as of 15 September 2026 | Long-end prices stay pressured even if the rate path eases; hedge duration tactically, not structurally |
A 1.31 percentage point term premium tells you investors are being paid unusually well for duration uncertainty, not just rate-path uncertainty. A rate cut alone will not mechanically repair long-end bond prices the way it might have in an earlier cycle.
Reading cross-asset momentum: what RSI divergence and term premium say together
Before the dollar and synthesis sections lean on these ideas, it is worth grounding both in plain terms.
RSI divergence describes what happens when price and momentum move in opposite directions. When a bond makes a new low but the momentum indicator does not, the signal challenges whether the downtrend can continue. It is a warning about sustainability, not a guarantee of reversal.
Reading it in practice is a two-step check:
- Identify the price trend. Is the asset making lower lows or higher highs?
- Check whether momentum confirms it. If price falls but RSI does not follow, that is the divergence.
Term premium is the second tool. It is the extra yield investors demand above what they would earn simply rolling over short-term bonds, and it captures compensation for uncertainty about future inflation, fiscal credibility, and central bank behaviour. The current 1.31 percentage point reading is a concrete measure of how much of that uncertainty is priced into the 10-year.
Here is how the two connect. A momentum divergence that resolves higher is more durable when the underlying structural driver, term premium, is also stabilising. It is far more fragile when that premium is still building. The TLT bounce looked constructive on the chart, but the elevated term premium is the reason to treat it as tactical rather than a full trend reversal.
That reframes what you should watch after a Fed or BOJ meeting. A rate decision that meets expectations can still move long-end yields sharply if it shifts how the market perceives long-term fiscal or inflation risk. Yield level alone will not tell you which is happening.
The dollar’s technical stall and what it means for non-dollar portfolios
The dollar’s most recent move was a rally that ran out of road. It climbed sharply on hawkish Fed messaging, then stalled precisely where former resistance had turned into support, with EUR/USD pausing at that exact level. Opening a fresh short-euro position directly into technical support offered poor risk-reward, so holding existing long-euro exposure made more sense.
Pull back, and the medium-term picture looks different again. DXY sat at 100.25 on 17 September 2026, up from 98.48 on 2 January 2026. The consensus among major banks, including Goldman Sachs, Morgan Stanley, and Bank of America, points toward modest dollar weakness as the Fed-BOJ policy gap narrows.
The DXY momentum structure entering September showed four consecutive losing sessions with the 14-day RSI at 37 and the short-term EMA crossed below the longer-term EMA, a configuration that puts the asymmetric risk on the bearish side of the 95-102 forecast band major banks are modelling.
Bank of America projects EUR/USD to reach 1.20 by end-2026. Forecasts have DXY potentially drifting toward 94 before rebounding, generally trading in a 95-102 band over the next six months.
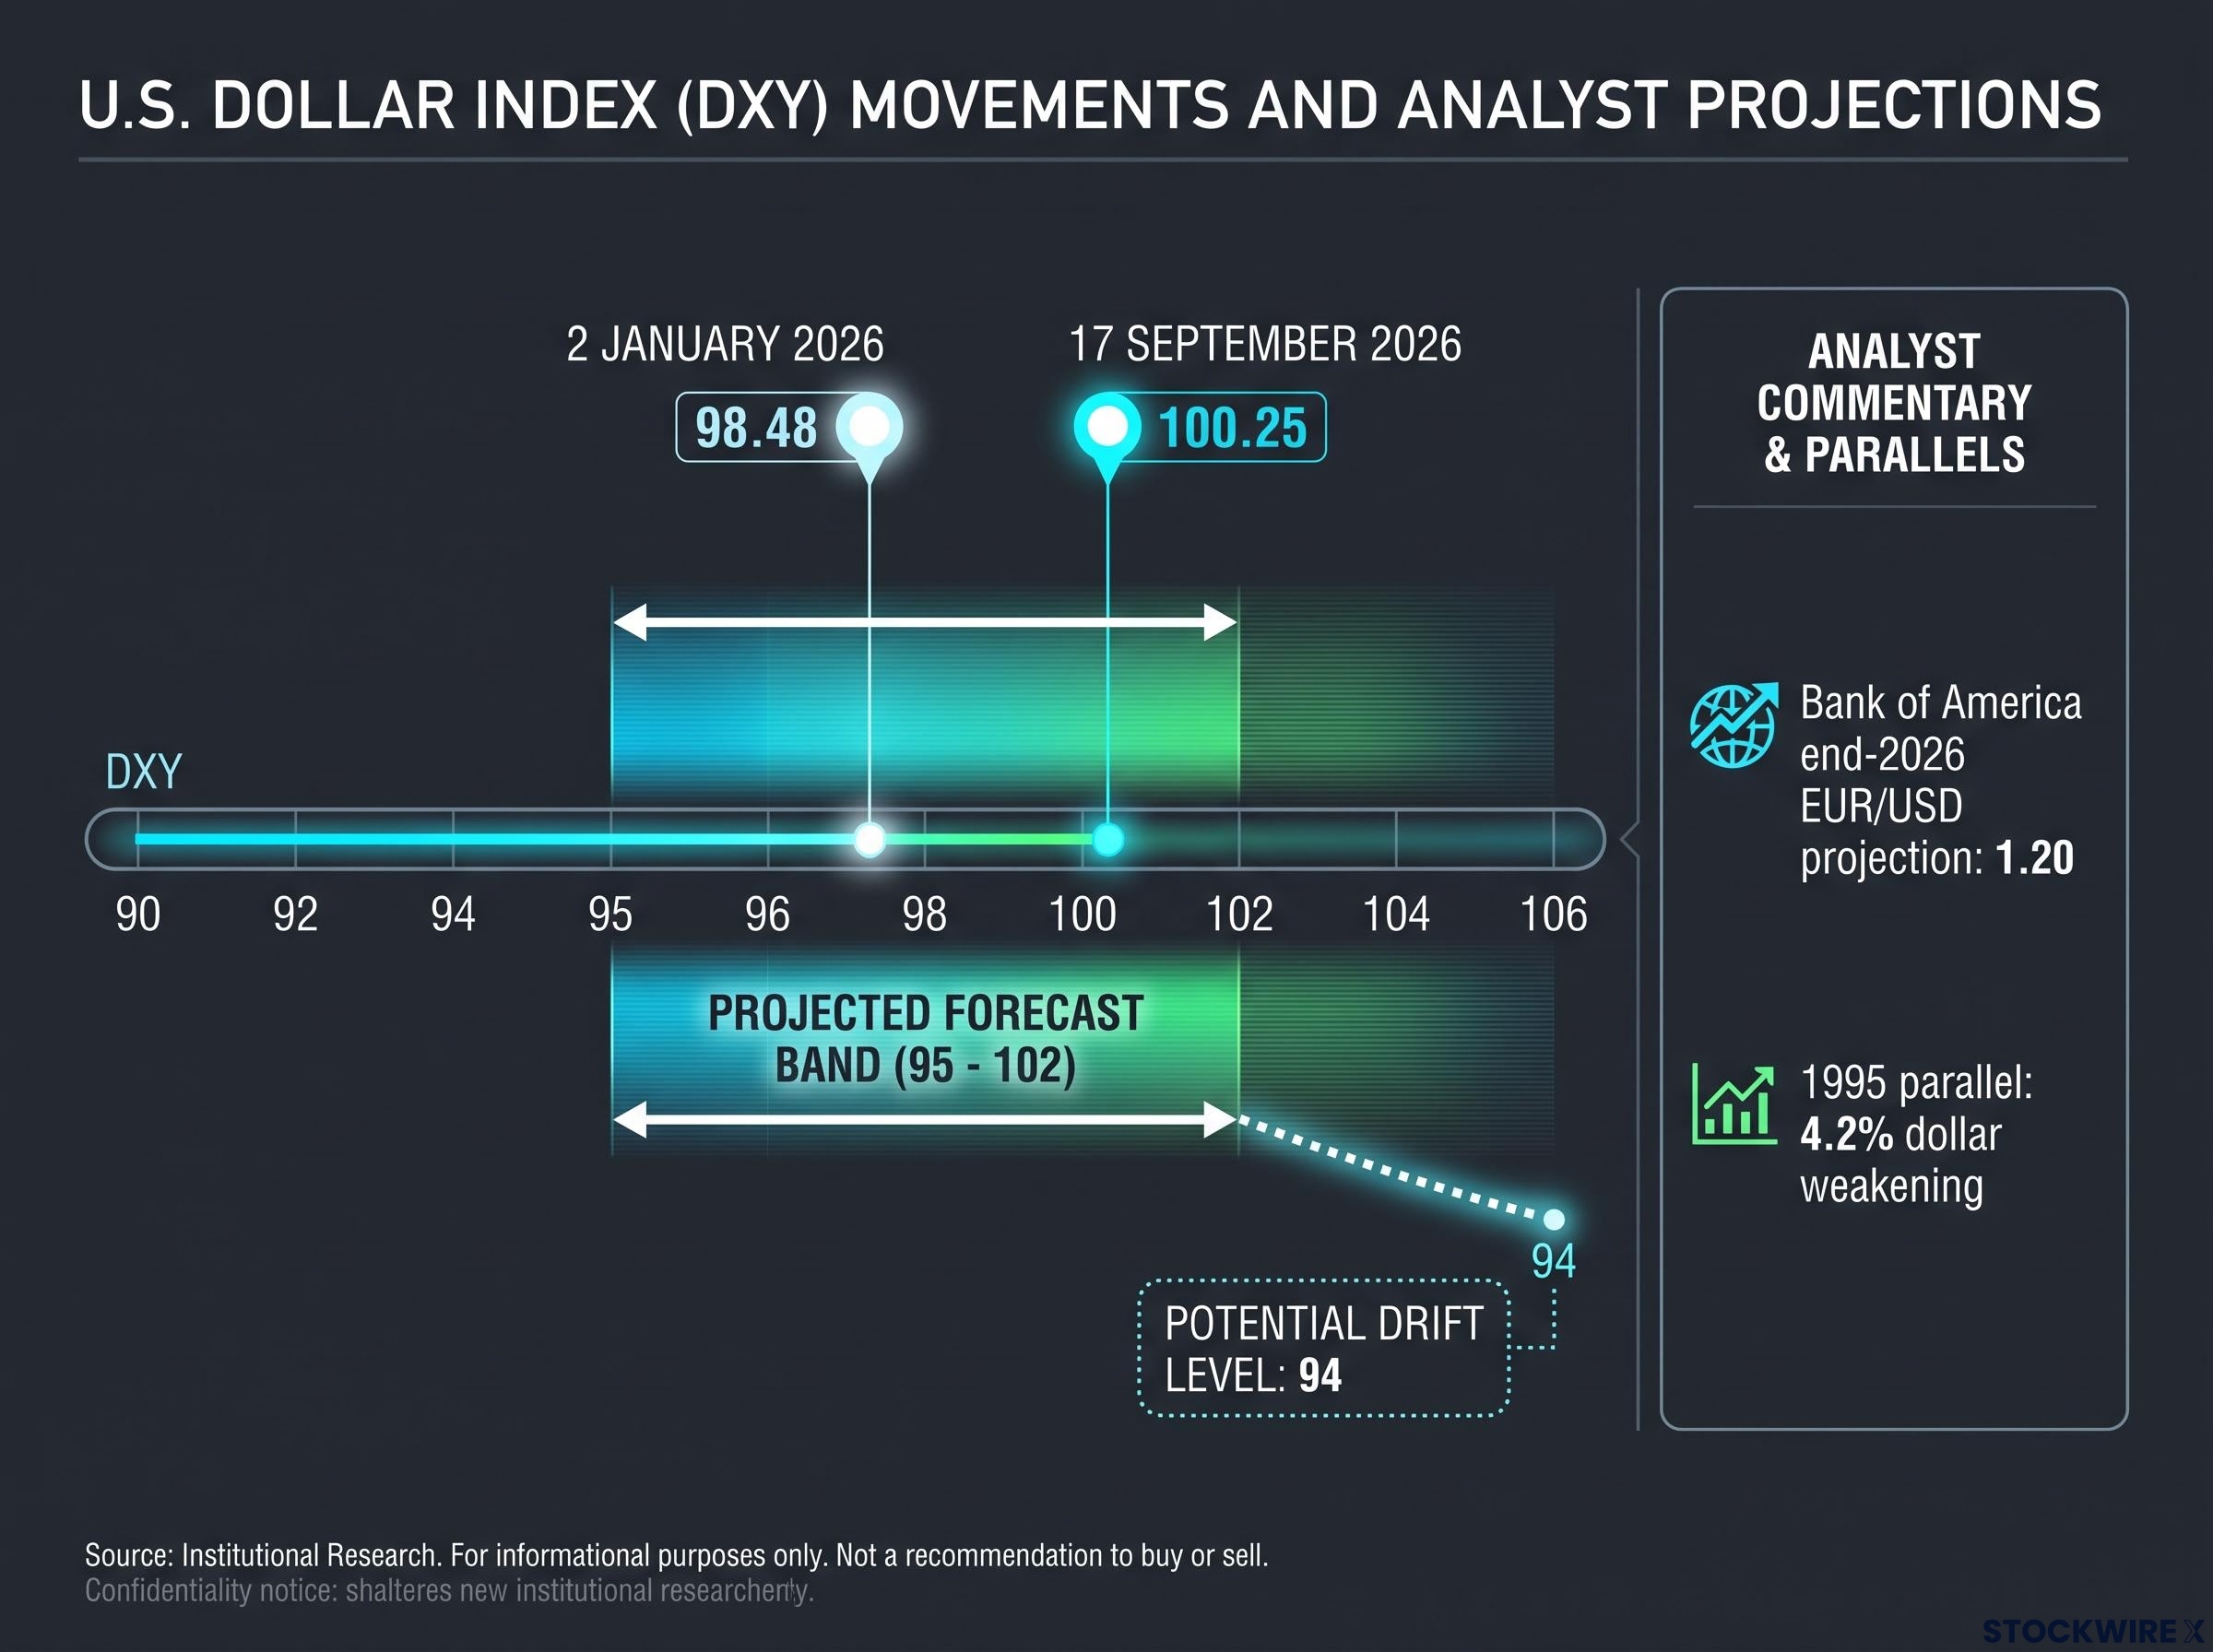
Analysts draw a parallel to 1995, a year the dollar weakened 4.2% under a comparable macro structure. But medium-term drift is not the whole story, and treating it as such is where portfolios get caught.
The safe-haven caveat is the tension you have to hold. A softer dollar over six months does nothing to prevent sharp, short-term dollar spikes during risk-off events, because the dollar remains the primary safe-haven asset. That is why strategists recommend selective hedging around key Fed and BOJ meetings rather than removing hedges outright.
| Scenario | DXY direction | Non-dollar portfolio implication |
|---|---|---|
| Baseline mild depreciation | Drifts within 95-102, possibly toward 94 | Tailwind for unhedged foreign equity returns |
| Risk-off spike | Sharp short-term jump on safe-haven demand | Unhedged foreign positions lose ground; a reason to keep some hedges |
| BOJ-driven yen surge | Dollar weakens against G10 as differential narrows | Yen and G10 exposure benefits; carry-linked assets face pressure |
For a U.S.-based investor holding international assets, a dollar drifting toward the low end of that band is a tailwind for unhedged foreign equity returns. The same safe-haven dynamic that could spike the dollar during a shock is precisely why you should not strip out currency hedges entirely ahead of the September BOJ outcome.
The BOJ-dollar link: why yen strength and dollar weakness can amplify each other
These two stories feed each other. When the BOJ hikes, the Fed-BOJ differential narrows, which reduces the incentive to hold yen-funded positions and pushes the yen higher. At the same time, a narrower differential weakens the dollar against its G10 peers.
That reinforcing loop, the BOJ tightening while the Fed pauses or cuts, is exactly what major bank forecasters are modelling as the driver of the 95-102 DXY band. The currency signal and the carry signal are not separate readings; they are two views of the same rate convergence.
How the three signals interact, and where they point for portfolio positioning
Follow the reasoning through and the three threads knot together rather than sitting apart.
BOJ normalisation compresses the Fed-BOJ differential and pressures carry unwinds. Those unwinds create liquidity events that hit long-duration bond demand and short-term dollar demand at the same time. And the dollar’s technical stall, read against a still-building term premium, signals that both the rate-path and fiscal-risk dimensions of this moment remain unresolved.
The convergence carries a clear message. A portfolio built on assumptions from the prior era, when the BOJ was at zero, term premium was compressed, and the dollar was structurally bid, needs active reassessment. Not because a crisis is imminent, but because the assumptions themselves have changed.
Translated into positioning, that argues for diversified FX exposure, selective duration exposure held tactically rather than structurally, and close attention to BOJ and Fed meeting dates as event-risk anchors. The 17-18 September 2026 BOJ meeting and upcoming Fed meetings are the practical timing points around which selective hedging makes sense.
Three variables are worth putting on a watchlist:
- The pace and scale of the yen carry unwind. Track USD/JPY and yen forward positioning data. The 2024 compression from roughly 161 to 150 is the historical reference for how fast this can move.
- The trajectory of the 10-year term premium. Watch San Francisco Fed and New York Fed estimates. A move away from 1.31 percentage points in either direction reshapes the duration call.
- DXY behaviour within the 95-102 band. A break below the lower bound would signal a more meaningful structural dollar shift than the current baseline drift implies.
Read in isolation, each signal produces a partial conclusion. Read together, they produce a coherent view of how this macro regime differs from the last one, and what a thoughtful investor should be stress-testing now.
For readers wanting the broader cross-regional context, our dedicated guide to global central bank divergence maps the Fed, ECB, and BOJ paths simultaneously, including Deutsche Bank’s 10-year Treasury yield forecast and how the six-day June 2026 decision window shaped cross-regional allocation heading into Q3.
This article is for informational purposes only and should not be considered financial advice. Investors should conduct their own research and consult with financial professionals before making investment decisions. Past performance does not guarantee future results. Financial projections are subject to market conditions and various risk factors, and forward-looking statements are speculative and subject to change based on market developments.
What shifts when the assumptions change
The three signals examined here are not isolated curiosities. BOJ normalisation, bond market momentum divergence against a rebuilding term premium, and a technically stalling dollar are three expressions of the same underlying shift: the end of the zero-rate, compressed-premium, carry-supported era.
What happens next in each domain hinges on specifics. Whether the BOJ hike is followed by hawkish commentary from Governor Ueda. Whether term premium keeps building or stabilises around its current 1.31 percentage point level. And whether the dollar holds or breaks the lower boundary of its 95-102 forecast band.
Staying current on those precise data points, rather than reacting to headline rate decisions alone, is what positions a portfolio ahead of the next cross-asset convergence rather than behind it. The regime has already changed. The question is whether the assumptions in your portfolio have caught up.