
How Hormuz Closure at $104 Oil Is Reshaping Every Asset Class
7 hrs ago

The question is deceptively simple. Buy the whole US equity market through one fund, or concentrate capital in the seven technology names that have driven the bulk of index returns for half a decade?
Vanguard Total Stock Market ETF (VTI) has compounded 287% over the past decade at a cost of 0.03% per year. The Magnificent Seven, by contrast, produced double-digit losers alongside double-digit winners in 2026 alone. The boring index fund is making its case through arithmetic.
Retail investors face a genuine strategic fork. Passive broad-market exposure versus deliberate mega-cap tech concentration is no longer a theoretical debate. It is playing out in real time, with Magnificent Seven return dispersion widening and sector rotation away from technology gaining institutional momentum. What follows is a comparative framework for evaluating whether VTI-style diversification or Magnificent Seven concentration better fits a given investor’s risk tolerance and 10-year return expectations, grounded in specific performance data, cost comparisons, and a worked example using Amazon’s operational complexity.
The two positions are structurally distinct:
VTI’s cumulative 10-year total return stands at 287% as of 23 April 2026, a figure achieved without requiring investors to identify the next winner or avoid the next loser.
The choice is a risk-architecture decision, not simply a return-chasing one. And it carries institutional weight on both sides. The Magnificent Seven collectively represent 23.23% of VTI’s portfolio as of 31 March 2026. Choosing VTI is not a bet against these stocks. It is a bet on not being fully dependent on them.
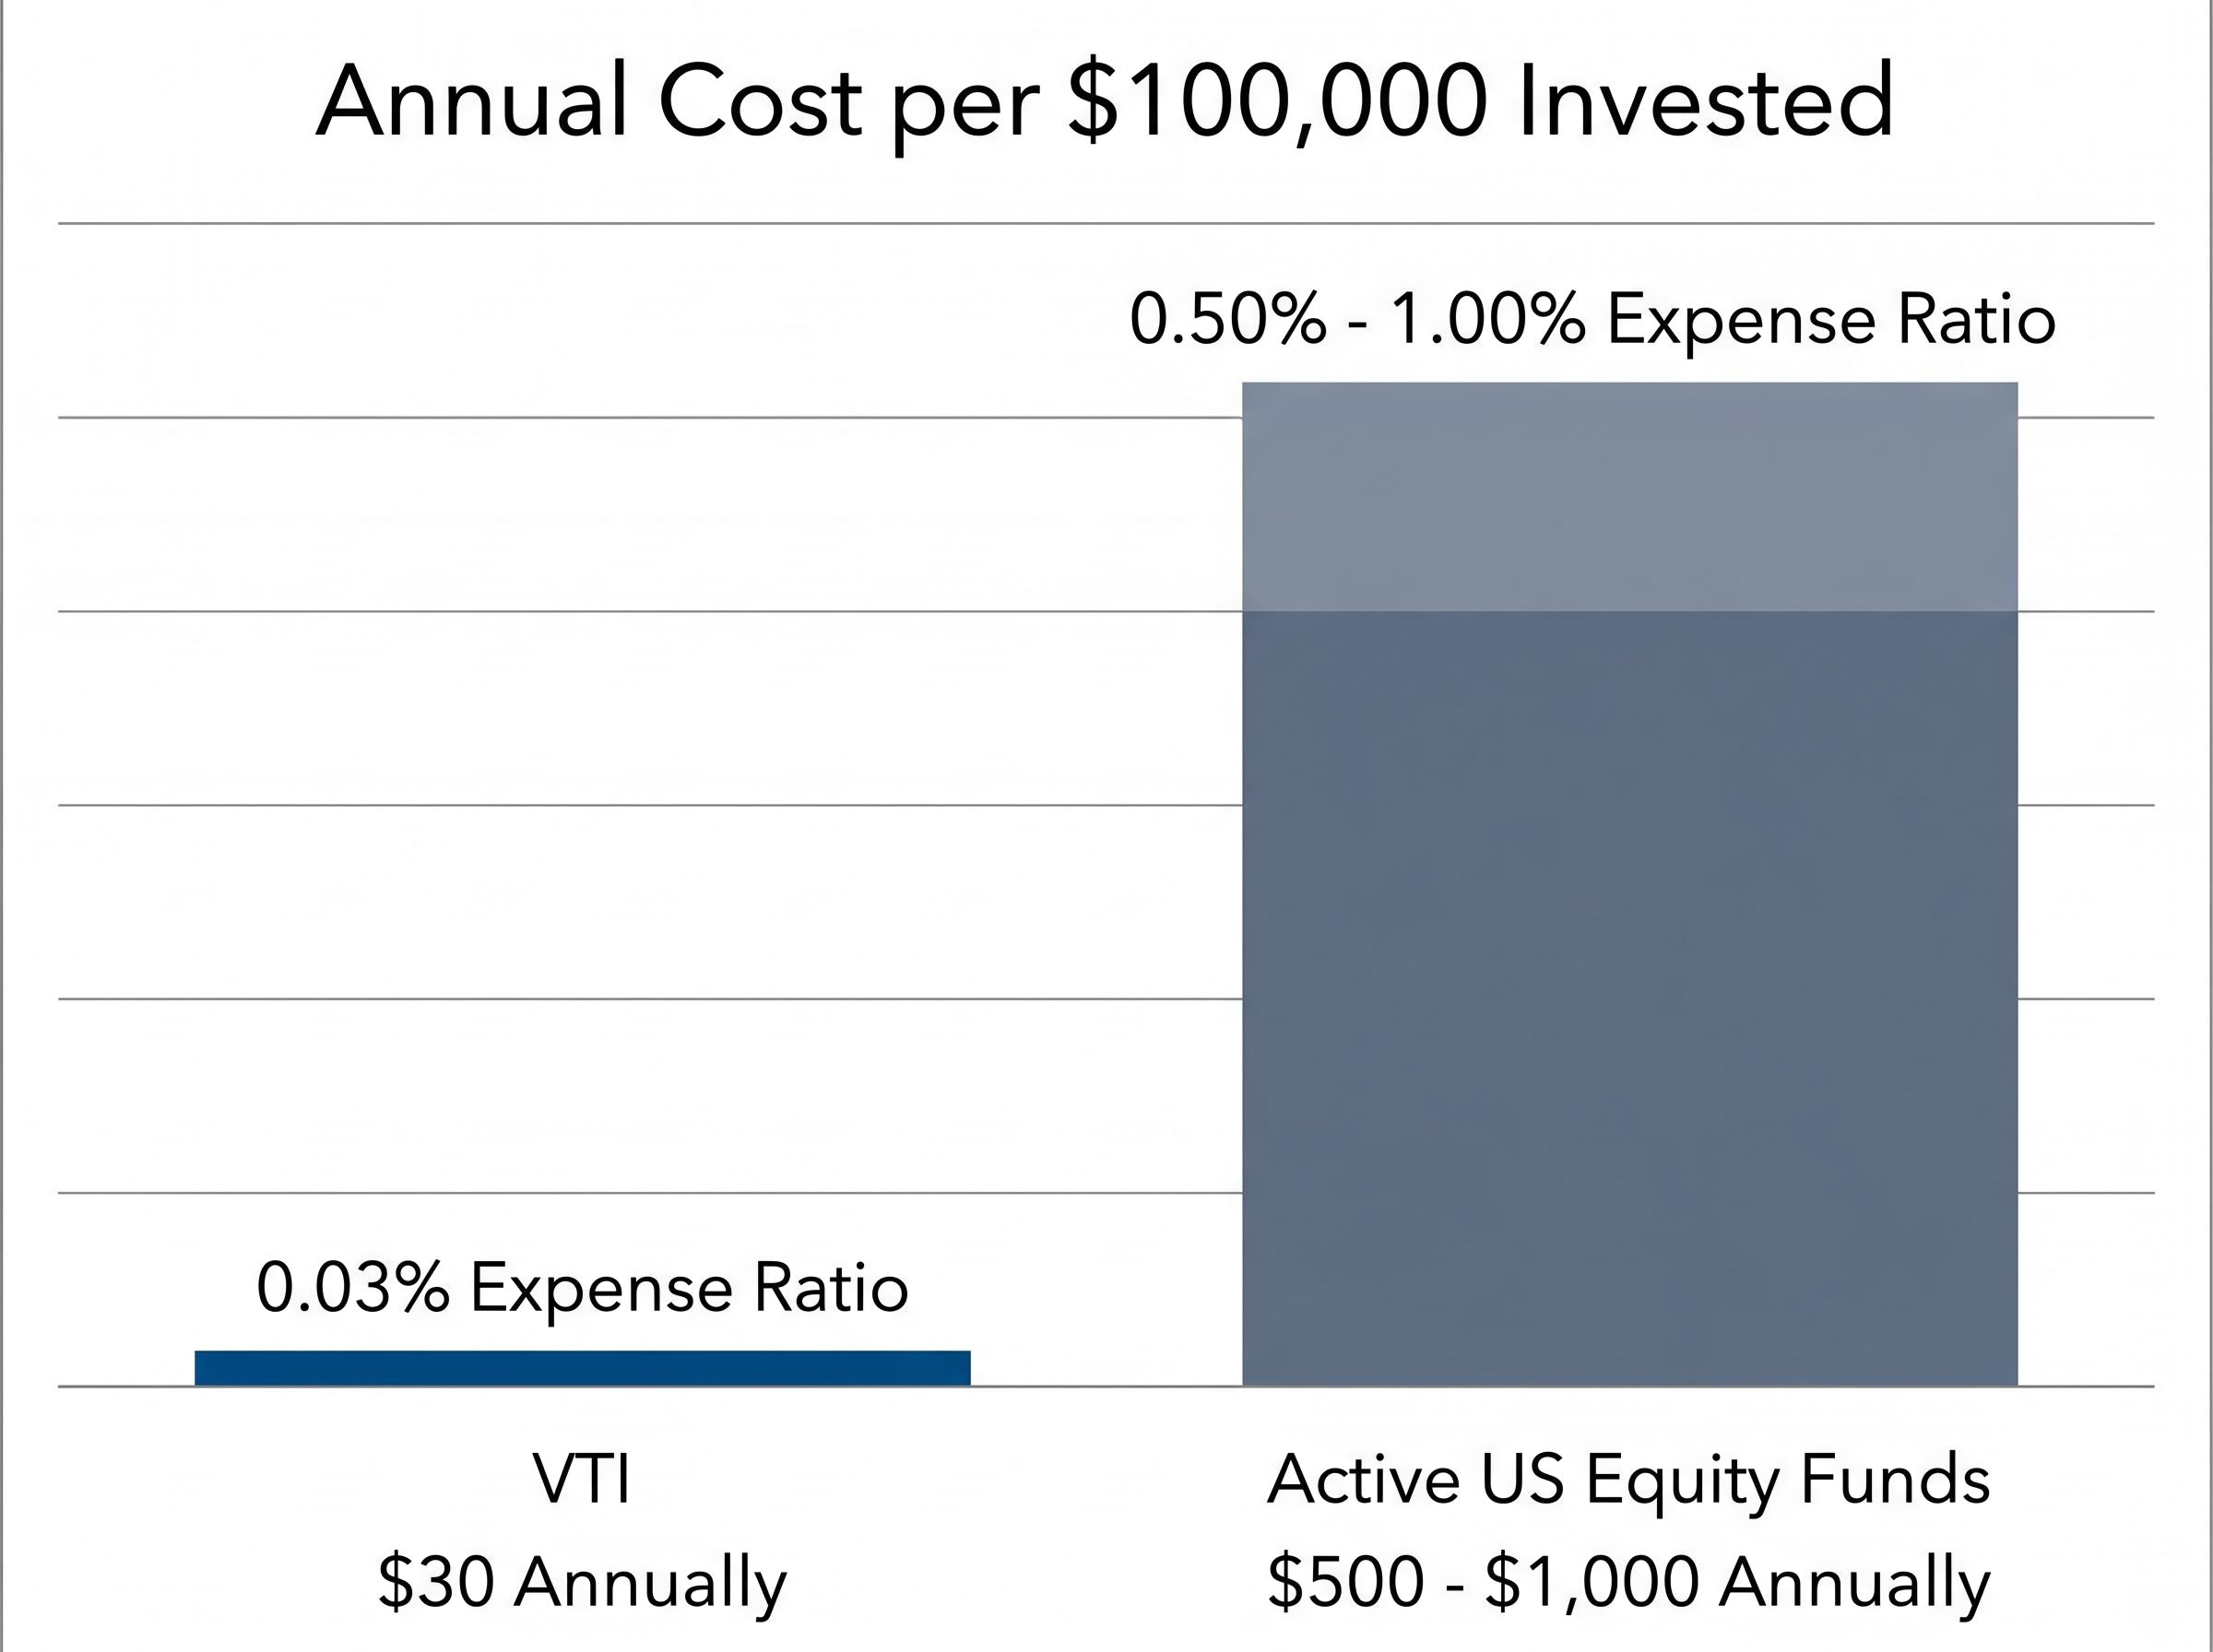
The numbers require no embellishment. A 0.03% expense ratio means that for every $100,000 invested, VTI charges $30 per year. Most actively managed US equity funds charge between 0.50% and 1.00%, which on the same position translates to $500-$1,000 annually. Compounded over a decade on a meaningful allocation, that difference becomes a material return drag.
The cost gap between passive and active management is reinforced by S&P SPIVA U.S. Scorecard data on active fund underperformance, which consistently shows that the majority of actively managed US equity funds fail to beat their benchmarks over 10-year horizons, making the expense ratio differential a structural return advantage for index investors rather than a marginal one.
| Metric | VTI |
|---|---|
| Expense Ratio | 0.03% |
| 10-Year Cumulative Return | 287% (as of 23 April 2026) |
| 1-Year Total Return | 18.11% (as of 31 March 2026) |
| YTD Return (Market Price) | 5.34% (as of 24 April 2026) |
| Portfolio Turnover | 2.6% |
The 2.6% turnover rate reinforces the cost story. Low turnover means fewer taxable events and lower transaction costs passed through to investors, a compounding advantage that is invisible in any single year but significant over a decade.
Tickeron analysis projects US GDP growth of 2.2-2.6%, with the Federal Reserve’s rate trajectory pointing toward approximately 3%. Rate cuts disproportionately benefit smaller companies because they carry more floating-rate debt and are more sensitive to borrowing cost relief. VTI’s small- and mid-cap holdings are direct beneficiaries of this dynamic.
The Magnificent Seven, by contrast, sit on cash-rich balance sheets that insulate them from rate costs. Lower rates do not help them borrow more cheaply. Instead, as discount rates normalise, the premium the market assigns to high-growth future earnings compresses, creating multiple compression risk for the very names that led the prior cycle.
Concentration risk is the degree to which a portfolio’s outcome depends on the performance of a small number of positions. An investor holding four Magnificent Seven names may believe they are diversified across four companies. In practice, those four names share overlapping revenue drivers (advertising spend, cloud infrastructure, consumer hardware cycles, AI capital expenditure), which means their returns are more correlated than their separate ticker symbols suggest.
Three factors define the practical cost of concentration:
The 2026 dispersion within the Magnificent Seven illustrates this concretely. Some components are up significantly year to date while others are down double digits. An investor who held the wrong three of seven experienced a very different year from one who held the right three.
| Sector | VTI Weighting |
|---|---|
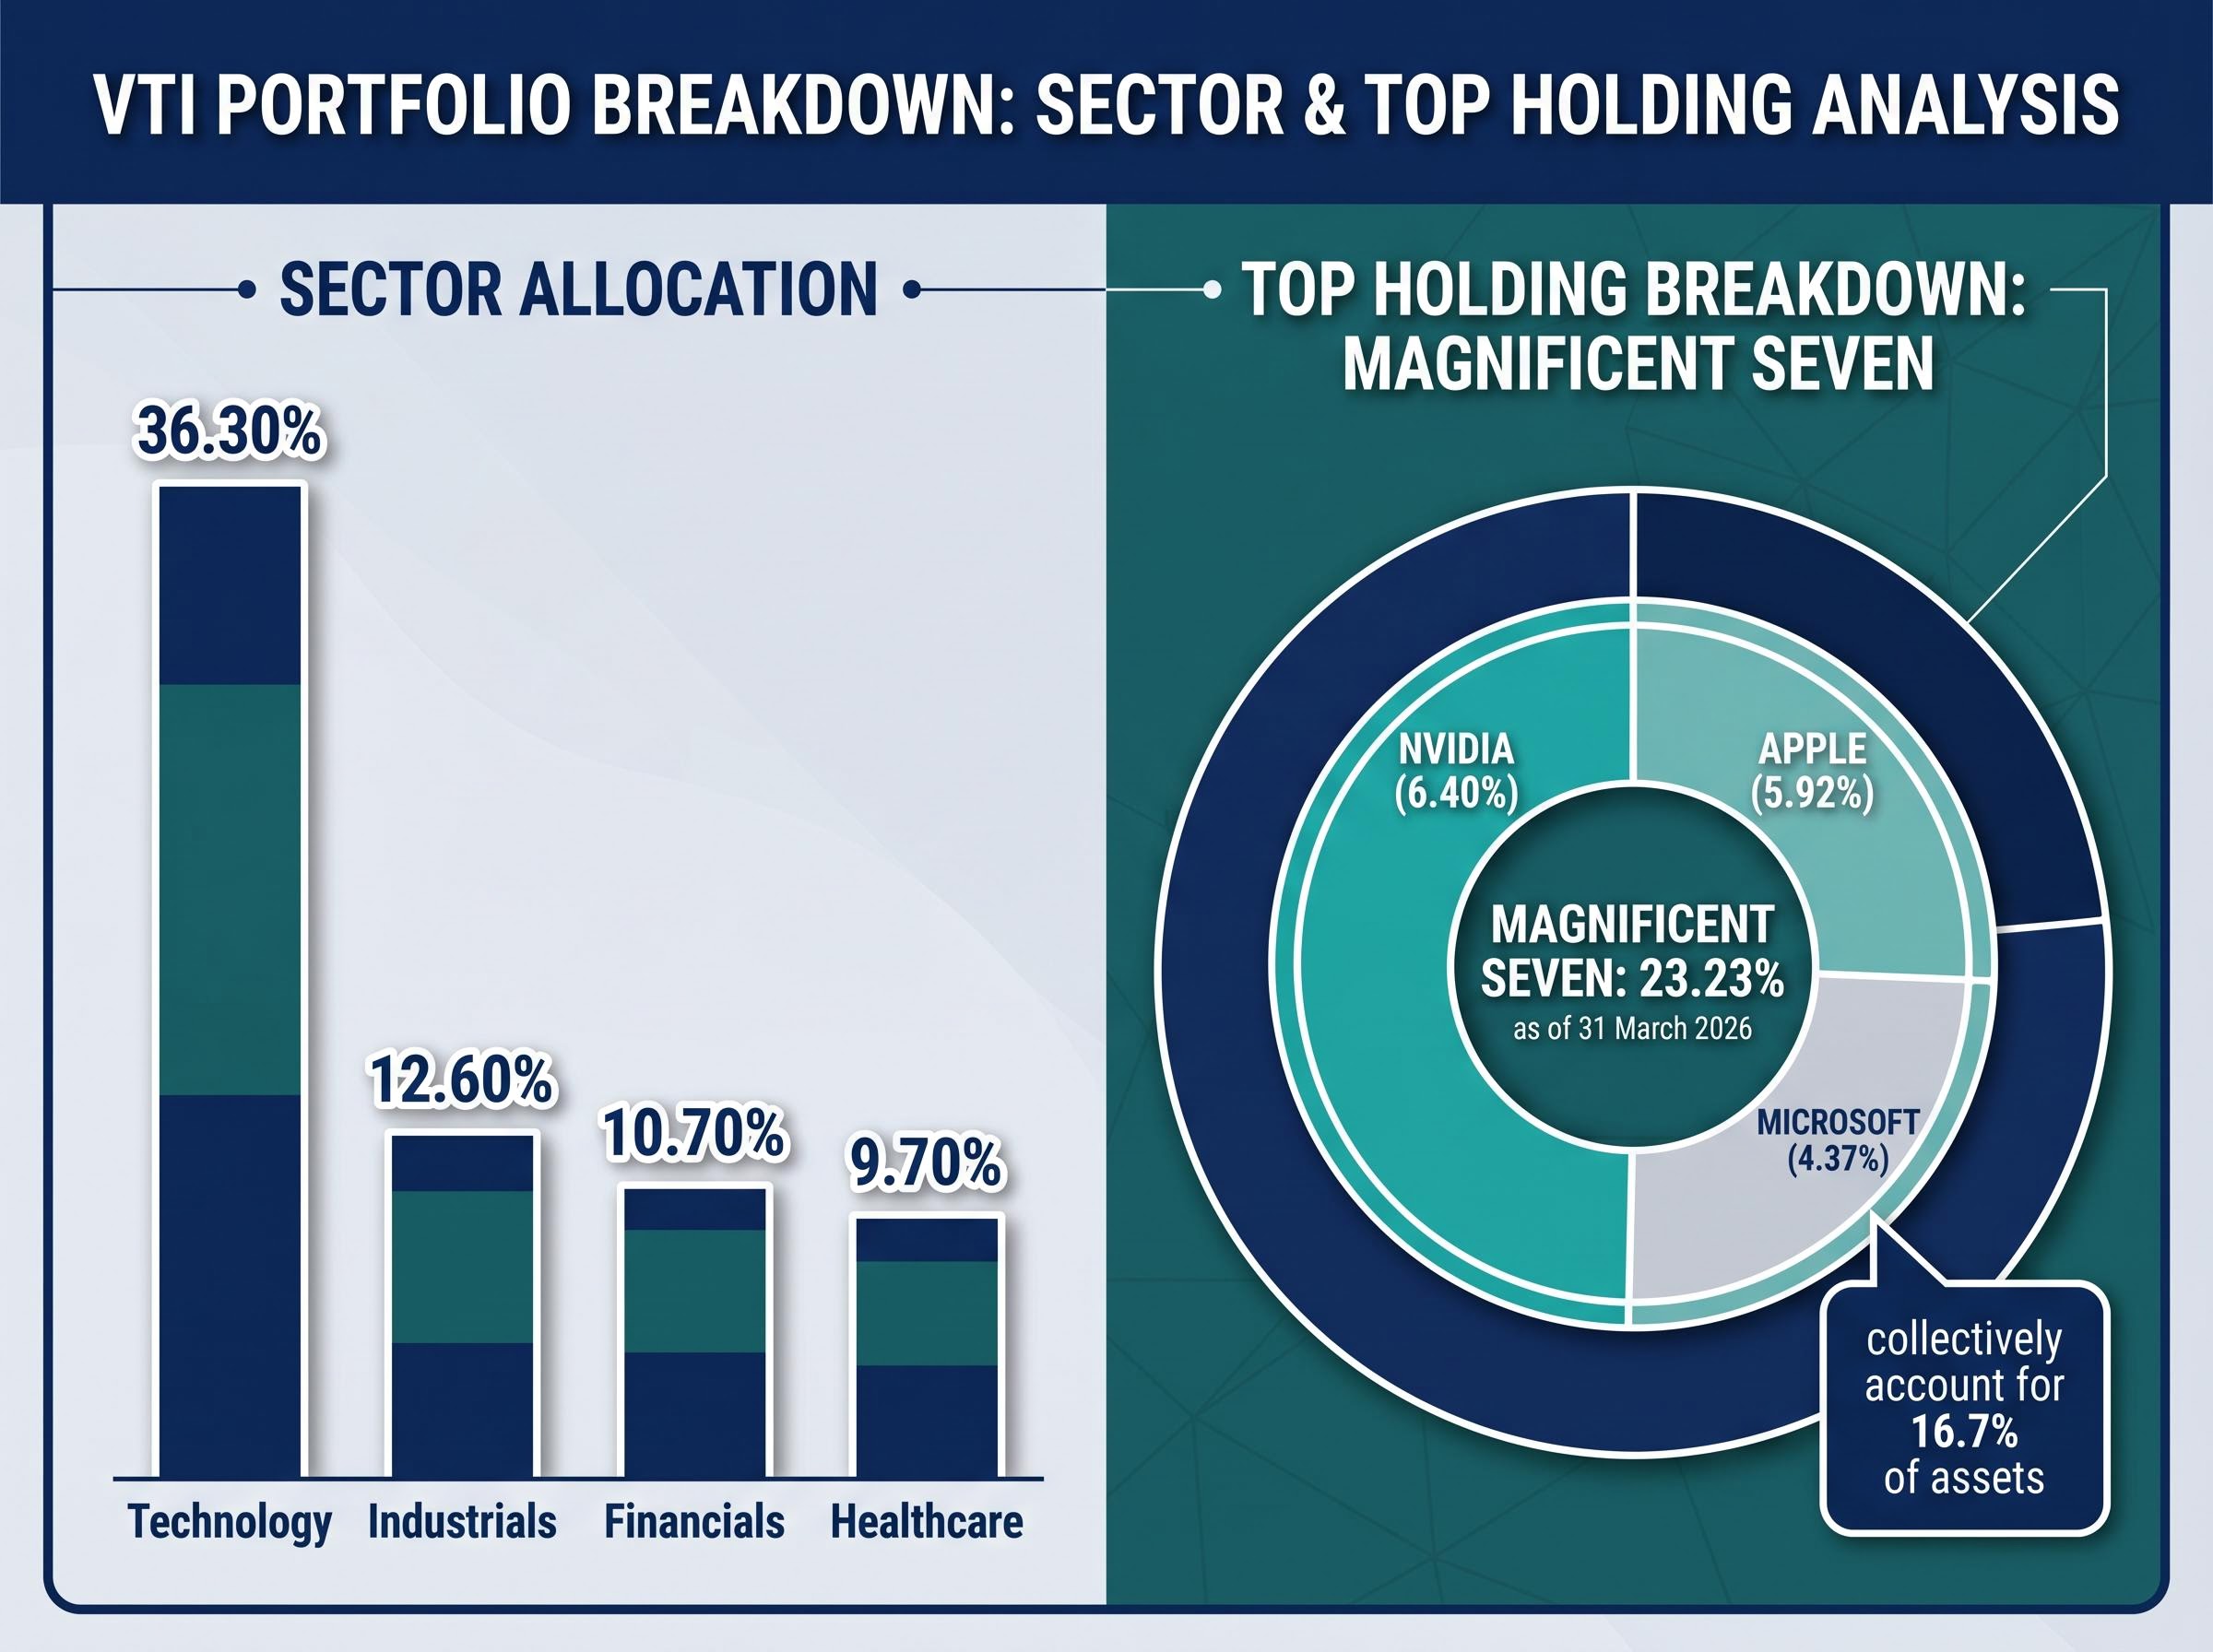
| Technology | 36.30% |
| Industrials | 12.60% |
| Financials | 10.70% |
| Healthcare | 9.70% |
Even VTI’s top three individual holdings (Nvidia at 6.40%, Apple at 5.92%, Microsoft at 4.37%) collectively account for 16.7% of assets. Market-cap weighting naturally limits any single holding’s portfolio impact, and small- and mid-cap exposure adds return drivers that are structurally independent from mega-cap technology sentiment cycles.
VTI’s market-cap weighting and top-holding concentration mean that the fund’s 3,500-stock breadth does not translate into equal-weight diversification; the top 10 holdings account for 31.60% of assets, and investors who assume broad market exposure automatically caps their mega-cap risk may be miscalibrating their actual portfolio construction.
Amazon trades at approximately $263.93 per share with a market capitalisation near $2.8 trillion. By any conventional measure, it is an exceptional business. The analytical question is narrower: within the Magnificent Seven peer group, does Amazon’s operational breadth create relative underperformance risk over the next decade?
Motley Fool analyst Adam Spatacco has argued that Amazon’s simultaneous expansion across multiple capital-intensive domains may dilute per-dollar return on effort compared to more focused peers. The specific complexity vectors are:
Spatacco’s argument centres not on Amazon declining in absolute terms, but on the relative opportunity cost within the Magnificent Seven basket. An investor who chose Amazon over a more focused peer like Nvidia (trading at $208.24, with a 4.3% single-session gain reflecting the market’s preference for concentrated AI execution) may underperform on a relative basis precisely because of Amazon’s breadth.
This is the concentration risk argument in microcosm. Scale and complexity are not the same thing, and investors who equate Amazon’s size with safety may be underpricing the cost of operational sprawl relative to focused execution.
For investors wanting to evaluate whether Amazon’s capital commitments represent calculated platform differentiation or costly diversification, our deep-dive into Amazon’s Trainium and Anthropic strategy examines the $13 billion Anthropic investment structure, the decade-long custom silicon bet against Nvidia GPU dependency, and the 100,000-plus enterprise customers already running Claude models on AWS Bedrock.
The rotation away from mega-cap technology dominance is not a forecast. It is visible in the data.
Vanguard Value ETF (VTV) returned 7.16% year to date as of 24 April 2026, outperforming the broader market and drawing approximately $2.71 billion in inflows over a period including February 2026. That capital is flowing toward financials, healthcare, and industrials, sectors where stable cash flows offer a defensive posture against stretched technology valuations.
Four macro drivers underpin the rotation:
Hyperscaler free cash flow turning negative by late 2026 before a projected Q1 2027 recovery is the structural risk that Societe Generale’s Manish Kabra has quantified behind the rotation trade; with hyperscalers collectively investing approximately $600 billion in AI infrastructure during 2026, the gap between capital expenditure and revenue monetisation creates a specific multiple compression vector that VTI’s diversified weighting absorbs more gracefully than concentrated Magnificent Seven exposure.
Kavout analysts describe a “profound transformation” away from mega-cap technology dominance, citing stable cash flows in financials, healthcare, and industrials as a superior defensive posture in the current environment.
VTI is structurally positioned to capture this broadening. Its 12.60% industrials allocation, 10.70% financials weighting, and 9.70% healthcare exposure mean the fund benefits as these sectors contribute more meaningfully to aggregate returns. Short interest on VTI sits at just 0.17% of float as of 15 April 2026, signalling minimal institutional bearish positioning against the broad market.
The market broadening thesis does not require mega-cap technology to fall. It requires only that other sectors begin pulling their weight, and the flow data suggests that process is already underway.
The right answer depends on four investor-profile variables:
Two profiles emerge:
Equal-weight S&P 500 exposure as a third option sits between full broad-market diversification and Magnificent Seven concentration, reducing technology sector tilt to below 15% while retaining participation in the same underlying names; Societe Generale’s chief US equity strategist identified equal-weight vehicles as his preferred positioning through early 2027, citing the same rotation thesis driving VTV inflows.
The 23.23% Magnificent Seven weighting within VTI means choosing the fund does not eliminate technology exposure. It caps and diversifies it. The 2026 dispersion, where some Magnificent Seven names are up significantly and others are down double digits, illustrates precisely why that cap matters for investors who lack the conviction or capacity to pick the winners in advance.
This article is for informational purposes only and should not be considered financial advice. Investors should conduct their own research and consult with financial professionals before making investment decisions. Past performance does not guarantee future results.
VTI’s 287% decade-long return and 0.03% expense ratio are the product of a structure that spreads risk across 3,500-plus companies and compounds quietly without requiring the investor to be right about Amazon’s chip strategy or Nvidia’s next earnings cycle. The Magnificent Seven remains a legitimate focus for investors with genuine conviction in specific names. But 2026 is showing that even within that basket, the difference between the right pick and the wrong one is measured in double digits.
As market broadening accelerates and rate cuts begin to lift small- and mid-cap names, VTI’s structural advantages are likely to become more visible in annual return figures. The case for diversification does not rest on the Magnificent Seven failing. It rests on the mathematical reality that not all of them can lead at the same time.
VTI is the Vanguard Total Stock Market ETF, which holds 3,500-plus US-listed stocks across every sector at a 0.03% expense ratio, while investing in the Magnificent Seven means concentrating capital in just seven mega-cap technology names including Nvidia, Apple, Microsoft, Amazon, Alphabet, Meta, and Tesla.
VTI has delivered a cumulative 10-year total return of 287% as of 23 April 2026, alongside a 1-year total return of 18.11% as of 31 March 2026, achieved without requiring investors to pick individual winners.
Concentration risk is the degree to which a portfolio's outcome depends on a small number of positions; within the Magnificent Seven, overlapping revenue drivers like advertising, cloud infrastructure, and AI capital expenditure mean the seven names are more correlated than their separate tickers suggest, amplifying losses when sentiment shifts.
No. The Magnificent Seven collectively represent 23.23% of VTI's portfolio as of 31 March 2026, so choosing VTI caps and diversifies technology exposure rather than eliminating it.
VTI suits investors who want broad US equity returns without the research burden of single-stock selection, prioritise cost and tax efficiency, and lack the conviction or monitoring capacity for concentrated mega-cap technology positions; concentrated Magnificent Seven exposure may suit investors with genuine analytical edge in specific names and the risk tolerance for double-digit intra-basket return dispersion.


