The 10-year Treasury yield is hovering near 5.3%, a level not seen in roughly two decades, yet the VIX sits at about 15.5 and equities are stuck rather than breaking. A volatility index that calm beside yields that high raises an obvious question about what the VIX and options market signals are actually pricing.
The next four weeks hold known event risk. Bank earnings begin around the 13th, and the 3 November midterm election is now entering the VIX’s 30-day window.
Brazil’s EWZ exchange-traded fund jumped about 12.5% on 5 October on a political shock, a reminder of how fast event risk can reprice.
Here is how to read the gap between implied and realised volatility, what muted call buying without put buying says about positioning, and how traders approach upside skew.
What does a mid-teens VIX really say when realised volatility is near 10?
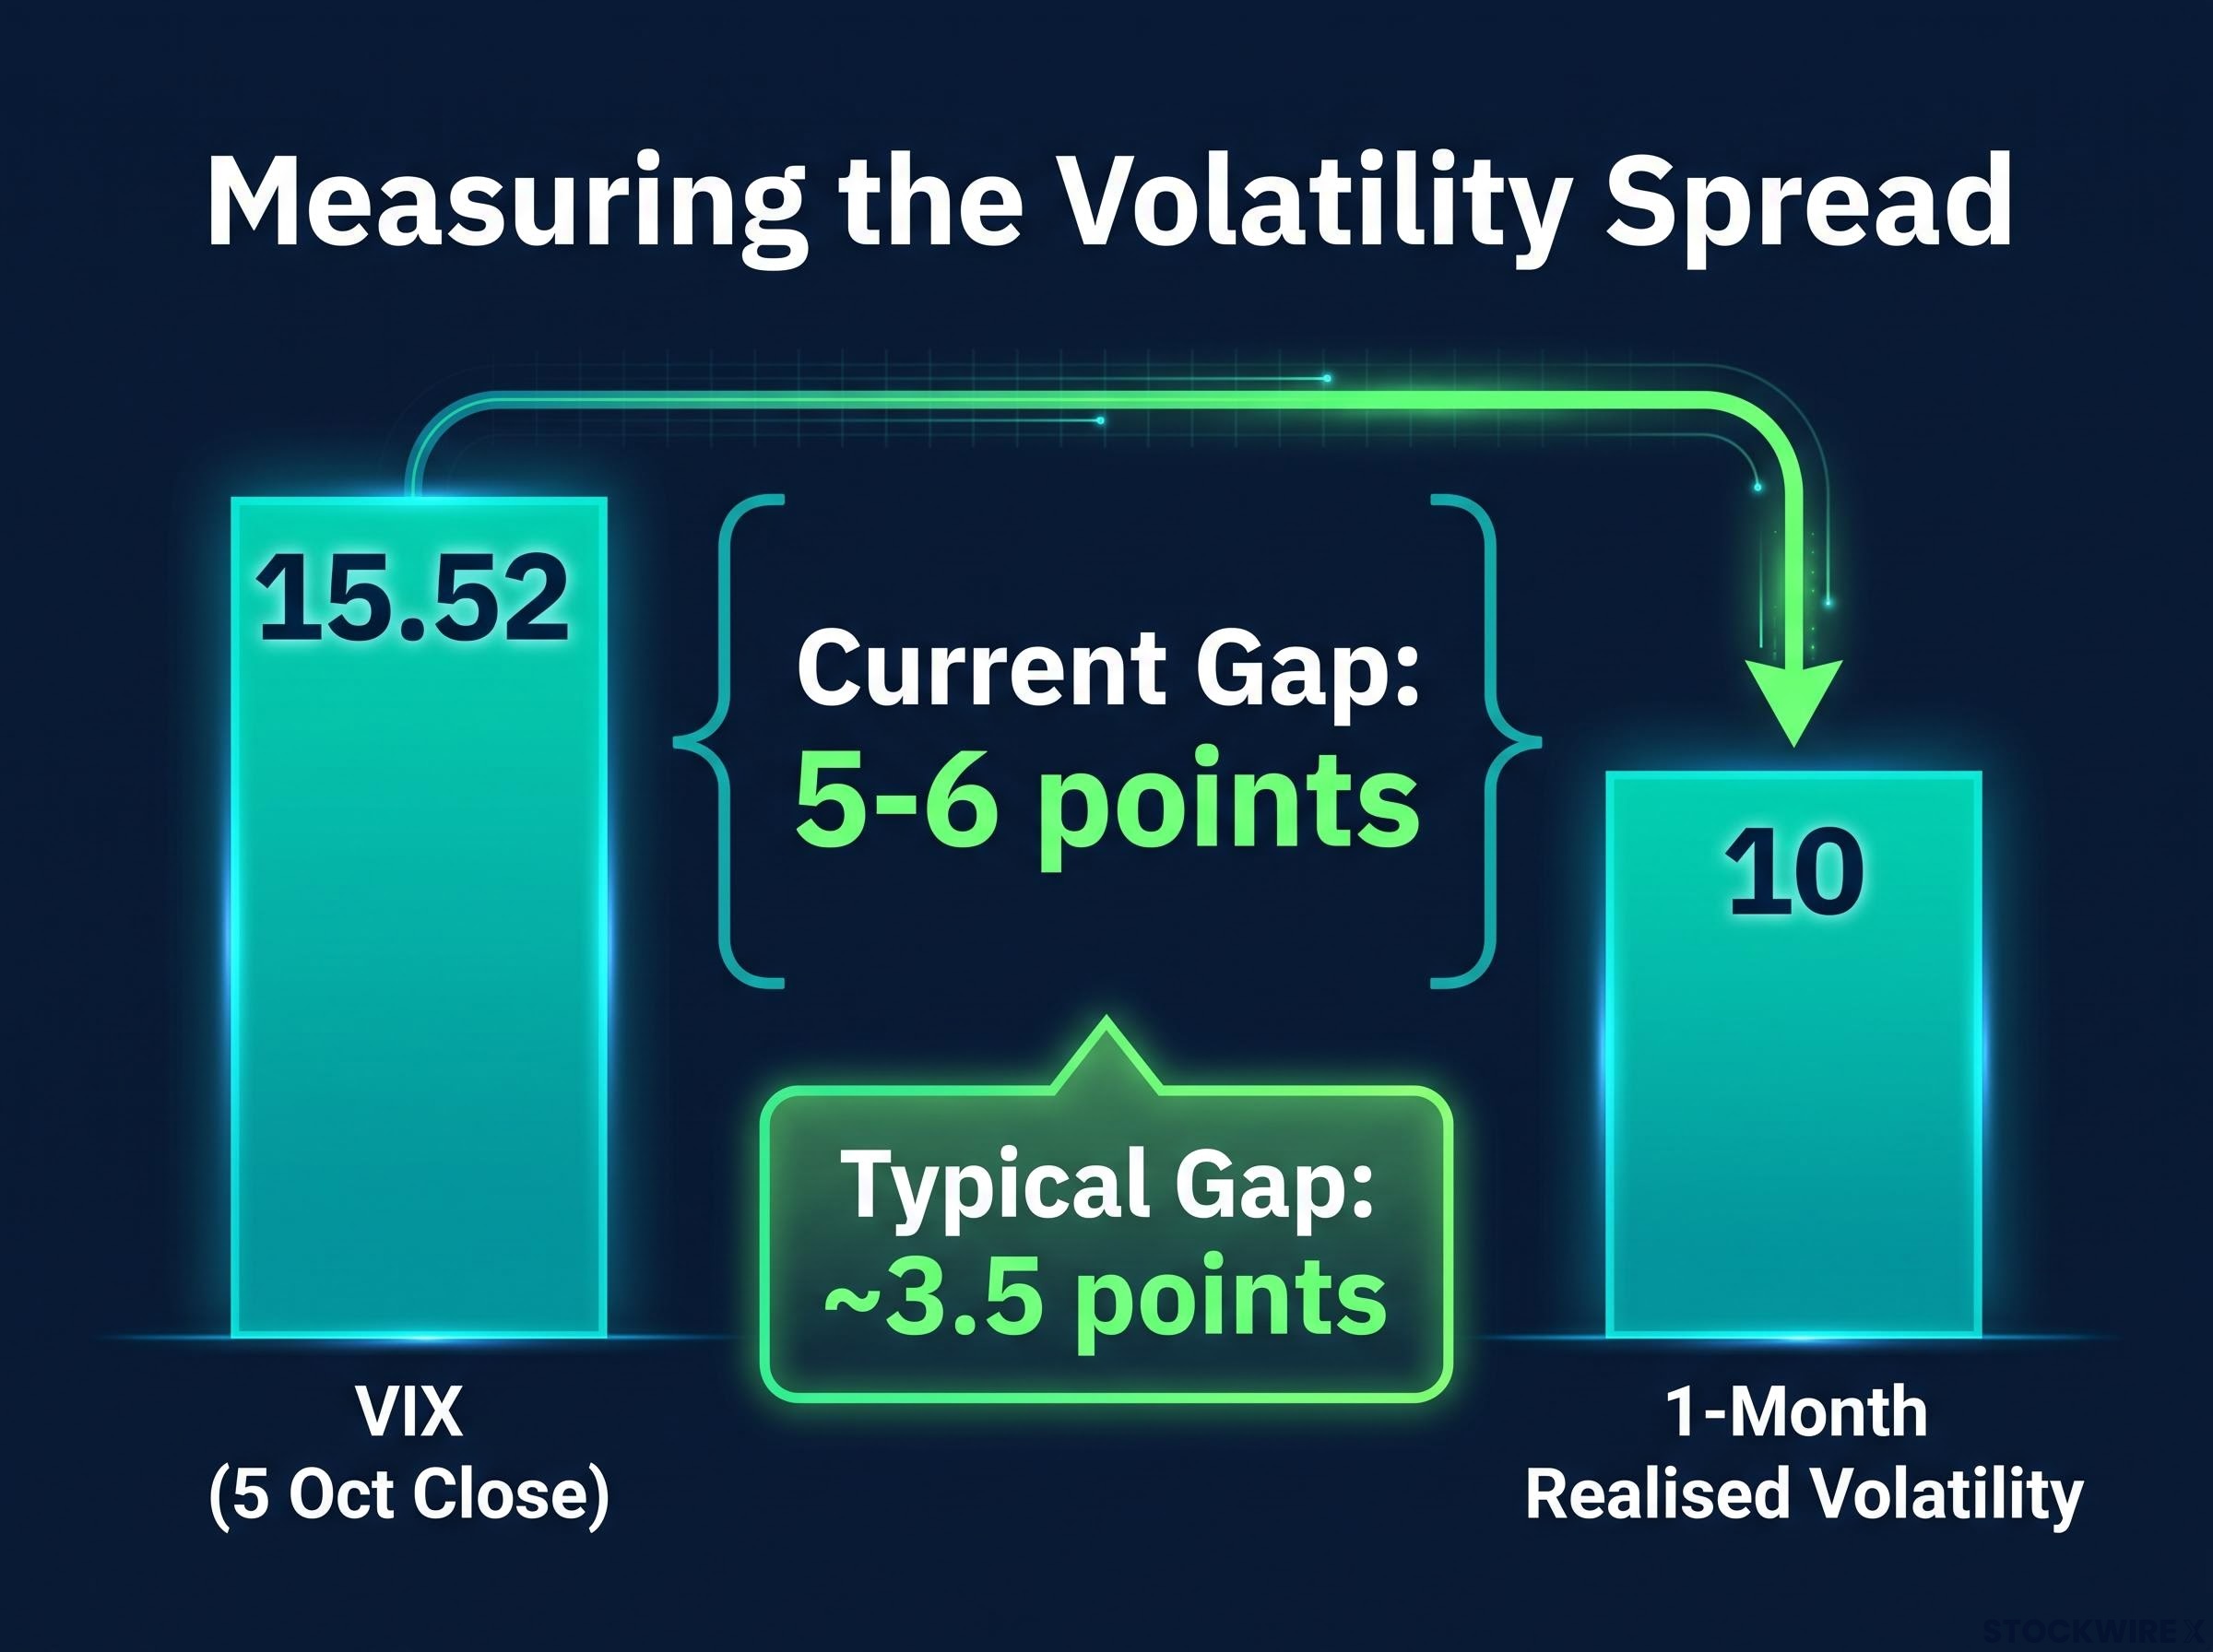
The VIX closed at 16.39 on 1 October, 15.31 on 2 October and 15.52 on 5 October. It is a measure of implied volatility, meaning the swings options traders expect in the S&P 500 over the next 30 days, based on what they pay for options. Realised volatility is different: it measures how much the index has actually moved.
According to Brent Kachuba, the source of most figures in this piece, one-month S&P 500 realised volatility is about 10. The usual gap between the VIX and realised volatility is about 3.5 points, but it is now roughly 5-6 points. These figures could not be independently verified.
That wider gap looks like an event premium, not panic. Protection costs more because the calendar is crowded, not because the index is falling.
The meaning of a mid-teens reading depends on which of the VIX regimes you are in, because the same number has signalled very different things across the past decade, and extreme readings behave unlike routine ones.
| Measure | Current reading | Typical | What it signals |
|---|---|---|---|
| VIX | 15.52 (5 Oct close) | Not specified | Price of 30-day protection |
| One-month realised volatility | About 10 | Not specified | Actual index movement has been contained |
| VIX minus realised | 5-6 points | About 3.5 points | Event premium is elevated |
A wide spread tells you options sellers are being paid more than recent index movement justifies. Treat the VIX here as the cost of insurance against the calendar, not a forecast of a fall.
One detail adds nuance. Upside realised volatility has exceeded downside realised volatility, according to the same source, which points to right-tail risk, meaning the chance of a sharp move higher.
Why implied volatility usually overstates event risk
Three forces tend to keep implied volatility rich ahead of known events:
- Traders pay up for protection and convexity (gains that accelerate as a move grows) before elections, earnings and policy meetings.
- Systematic sellers, such as covered-call and short-volatility strategies, may supply less volatility when rates are high and uncertainty is elevated.
- Dealers running large options books charge extra when their exposure is skewed toward the tails.
Around the 2016 and 2020 elections, the VIX was elevated in the weeks before voting and fell quickly once policy direction became clearer. Post-event realised volatility often lands below the pre-event implied level.
That is a tendency, not a rule. Systemic stress is the exception, and it is the case where the premium turns out to have been too cheap.
When big ASX news breaks, our subscribers know first
Why a 5.3% yield curbs call buying without sparking put demand
The yield has climbed from 5.24% on 1 October to roughly 5.26-5.28% on 2 October and 5.31-5.32% on 5 October. Intraday highs reached about 5.31-5.35%, the highest in around two decades.
Treasury yields near 5% reflect several forces at once, including hotter inflation data, fiscal deficit anxiety and curve-wide selling, which helps explain why discount-rate pressure on equities has not eased.
The jobs report on 3 October shows the puzzle. Payrolls missed expectations, equities rose about 0.7% and the VIX slipped to about 15.31, yet the 10-year still rose to roughly 5.28%.
The chain of logic runs like this:
- A higher discount rate trims the present value of future earnings, so equity upside looks smaller.
- Speculative call buyers hold back because the payoff for being right is less attractive.
- Rising yields leave the near-term earnings outlook ambiguous, so investors cut beta (sensitivity to market moves) or rotate sectors instead of buying crash protection.
- Range-bound conditions encourage dealers to hedge actively, which restrains realised moves and lowers the perceived need for puts.
The result is an options market where neither side is pressing. Kachuba said call volumes have contracted and that Friday’s upside thrust in equities stalled as yields reversed.
“Upside is pent-up pending cooler macro conditions.” This is the speaker’s opinion, not an established fact.
Quiet puts and weak calls mean the market is waiting, not worried. Read the stalemate as a coiled condition: a break in yields or earnings could resolve it in either direction.
Where analysts disagree
One camp focuses on dealer gamma, the hedging flows that dealers generate as prices move, and argues those flows cap volatility until a break point. Another camp focuses on fundamentals and expects put demand to accelerate if earnings or credit signals deteriorate.
Persistently low realised volatility with range-bound trading would favour the gamma view. Weak bank results or credit stress would favour the fundamentals view.
How the 3 November election and bank earnings feed the VIX
The VIX covers the next 30 days, so the midterms on Tuesday 3 November 2026 now sit inside its window. Kachuba said that is why election premium is starting to enter the index and may keep it elevated.
Bank earnings are the next layer. He said banks begin reporting around the 13th, adding premium to November and December options. Specific reporting dates for the major banks and the size of any election premium in VIX futures were not independently verified.
| Event | Date | Options expiries affected | Typical VIX behaviour |
|---|---|---|---|
| Bank earnings | Around the 13th (unverified) | November and December | Modest rise beforehand, then normalises unless results signal systemic stress |
| US midterm election | 3 November 2026 | Expiries spanning the date | Elevated beforehand, often falls once direction is clear |
Because the premium is tied to dated events, expect elevation to persist until those dates pass. Do not read a higher VIX in this window as fresh news about the economy.
Historical midterm election volatility has been meaningful, with S&P 500 drawdowns averaging roughly 17.6% in midterm years, though markets have typically recovered strongly in the year after the vote.
Three things to monitor:
- The VIX term structure, which compares expected volatility across different dates.
- Skew, the extra price of options on one side of the market.
- Jobs reports.
What the EWZ surge teaches about right-tail risk and broken-wing call flies
EWZ closed at 42.98 on 5 October, up about 4.8 points, or roughly 12.5%, with an intraday high near 43.90 on heavy volume. The trigger was Flávio Bolsonaro’s unexpected first-round lead against Lula and strong results for market-friendly candidates, with a runoff set for 25 October.
That is right-tail risk repricing in a single session. Kachuba cited surging call implied volatility and suggested broken-wing call flies, though specific EWZ call volatility levels were not verified.
How a broken-wing call fly is built
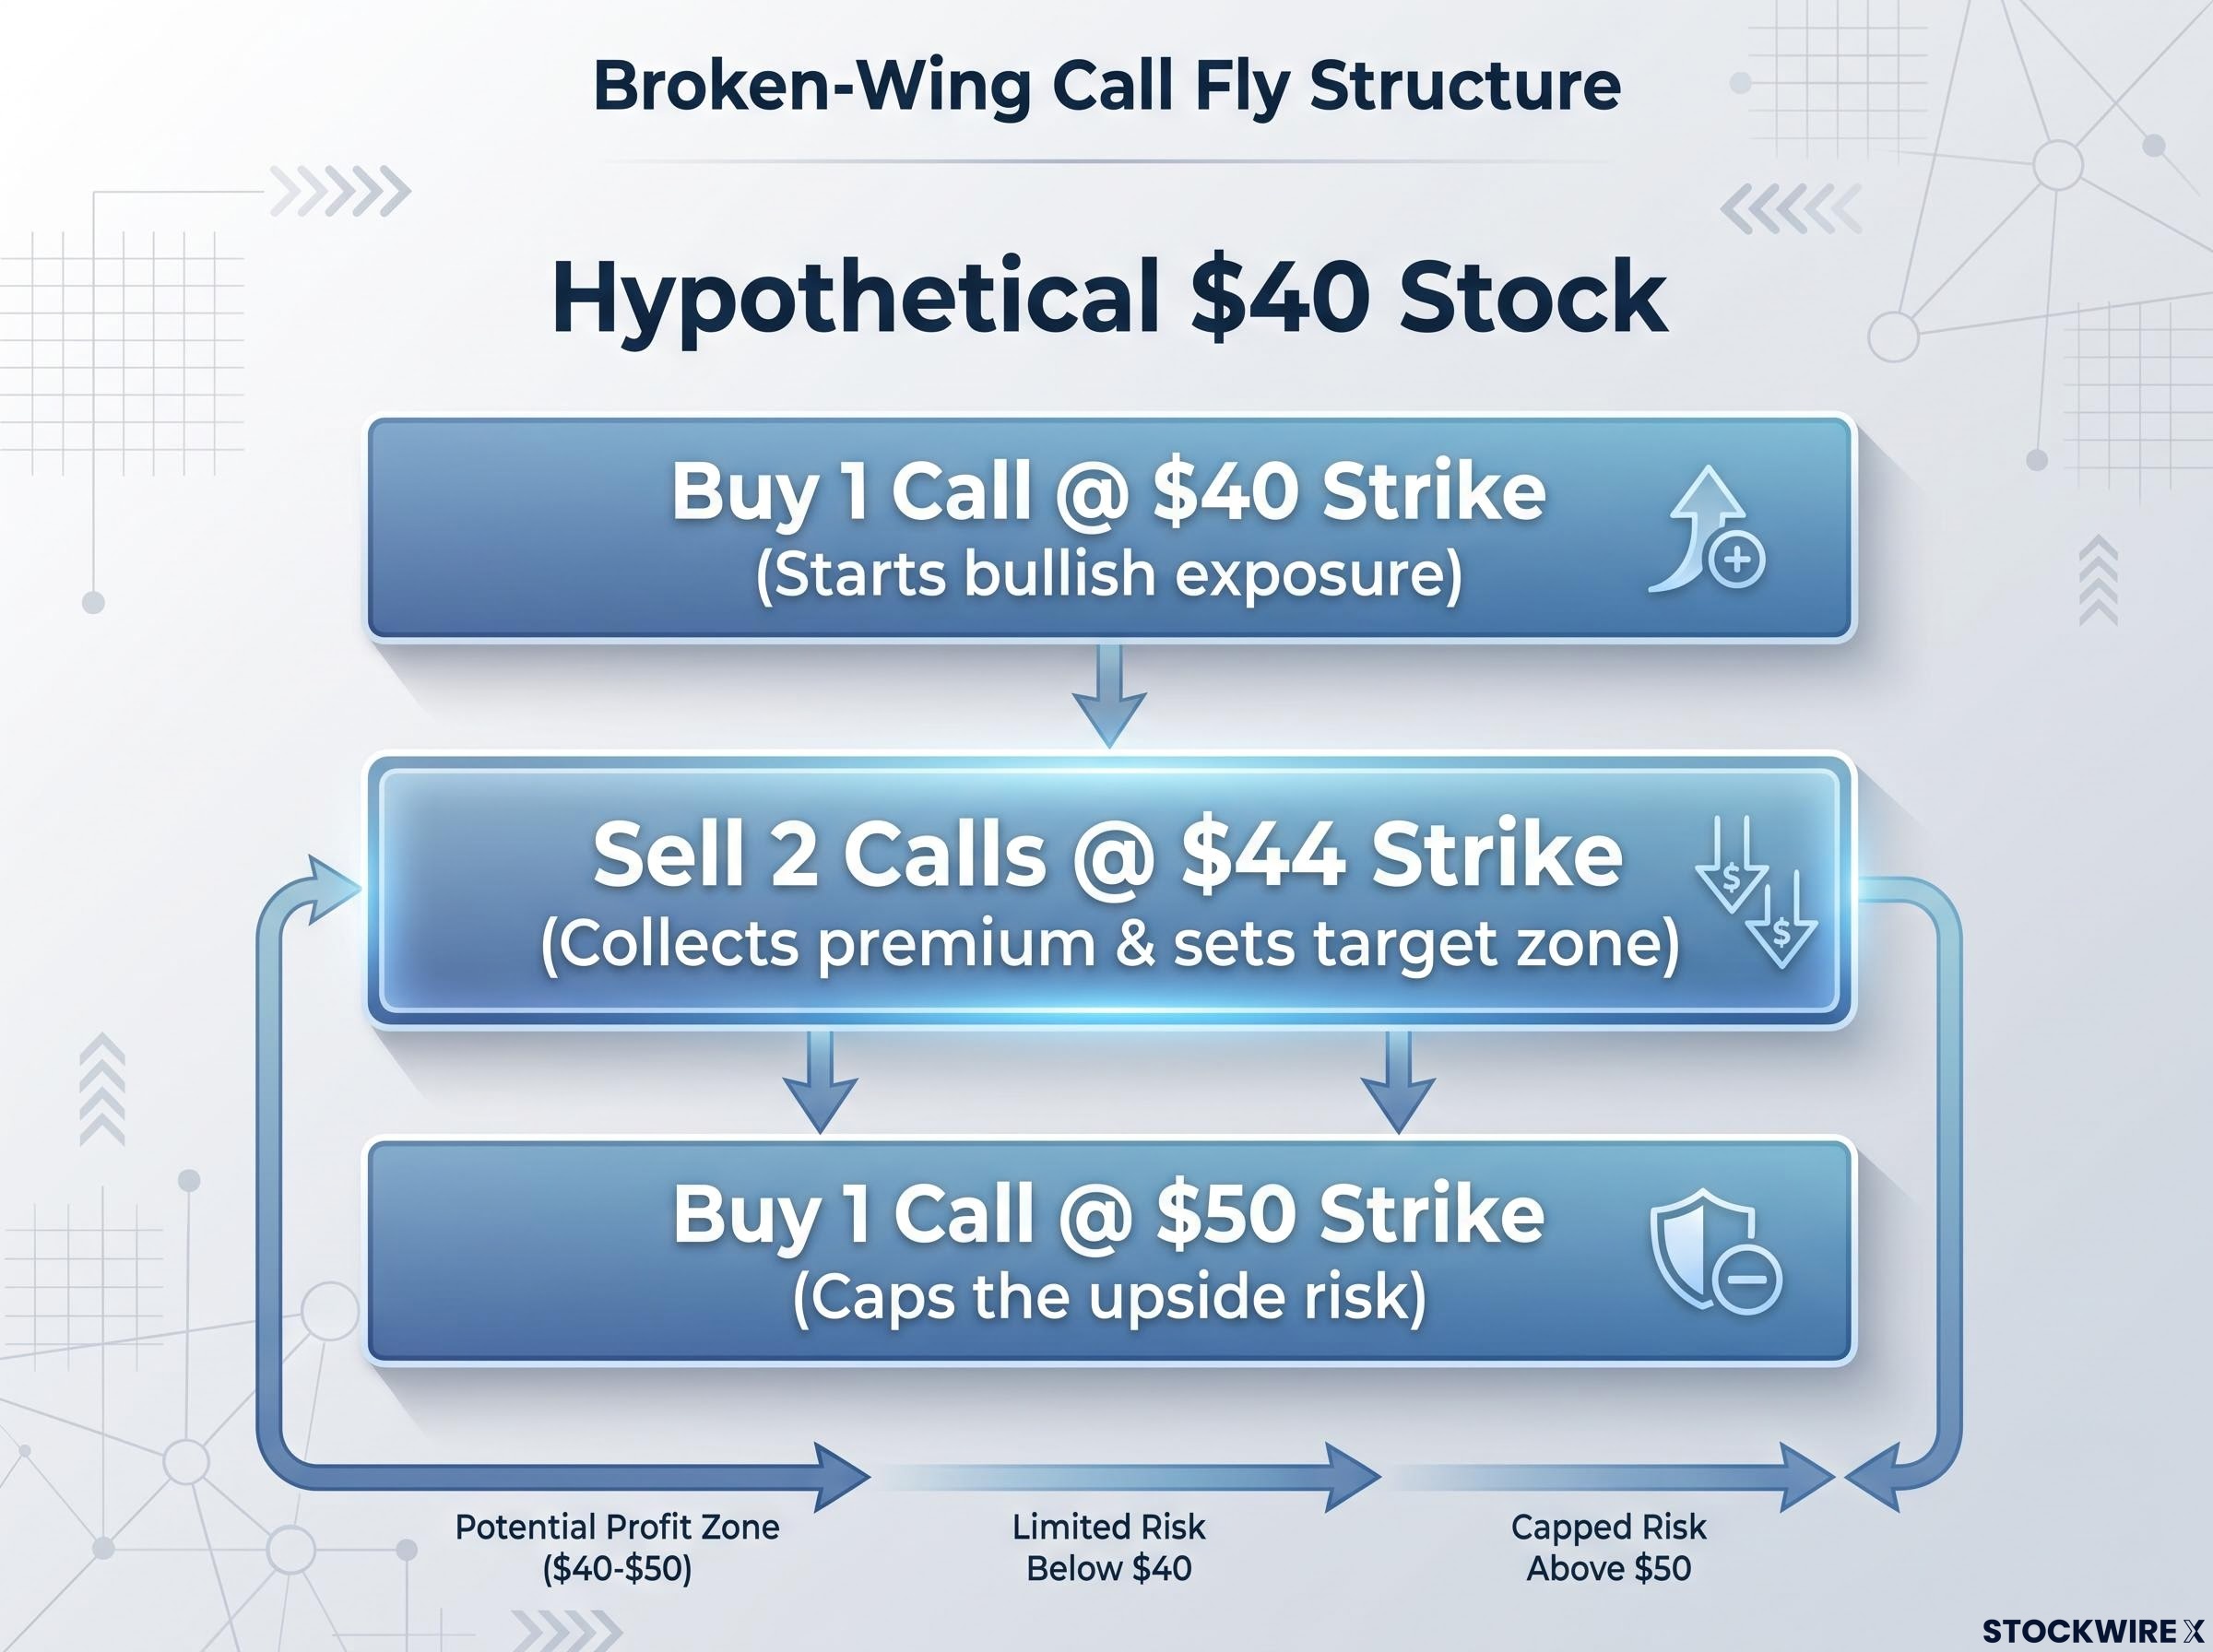
A broken-wing call fly is an options structure with four contracts across three strikes. A hypothetical example on a $40 stock shows the legs:
| Action | Strike position | Purpose |
|---|---|---|
| Buy 1 call | Lower ($40) | Starts the bullish exposure |
| Sell 2 calls | Middle ($44) | Collects rich premium; sets the target zone |
| Buy 1 call | Higher, set further away ($50) | Caps the risk on the upside |
Placing the top strike further from the middle makes the structure asymmetric, so the premium collected from expensive upside options helps finance the position. Educators usually favour it when you hold a defined, moderately bullish view, implied volatility is elevated into the event, and you accept capped profit.
Four risks deserve equal weight:
- Capped profit: if the price gaps far past the upper strike, you forfeit gains that simple long calls would have captured.
- Gap risk: elections and earnings raise the odds of overnight gaps, and a large one can produce maximum loss with no chance to adjust.
- Margin and assignment: short calls carry margin requirements and early-assignment risk if deep in the money.
- Liquidity and slippage: around major events, bid-ask spreads on out-of-the-money calls widen, making multi-leg trades costly.
Nominally high-probability profit profiles can mislead when price paths gap.
EWZ shows how quickly a known political event can reprice. The fly’s capped payoff suits a target-zone view, not a runaway move, so size it as a speculative trade, not a hedge. This is educational content, not personalised advice.
Investors exploring premium-selling around events can read our deep-dive into selling options tail risk, which shows how one gap can erase years of gains.
Reading the signals before the calendar plays out
High yields, a mid-teens VIX above realised volatility, subdued call buying with no rush into puts, and dated event premium form one chain. Together they describe a market paying for the calendar while waiting on rates.
Four variables to watch:
- The 10-year yield against the roughly 5.3% area.
- The VIX-realised spread, now about 5-6 points.
- The VIX around 3 November and bank earnings.
- The 25 October Brazil runoff.
Judge each VIX move by whether it reflects the calendar or genuinely new information. The key volatility figures here come from a single unverified source.
This article is for informational purposes only and should not be considered financial advice. Investors should conduct their own research and consult with financial professionals before making investment decisions. These statements are speculative and subject to change based on market developments.