Australian inflation sat at 3.8% on a trimmed-mean basis in the March 2026 quarter, still well above the Reserve Bank of Australia’s 2-3% target band. Brent crude hovered near US$87-88 per barrel in mid-May, iron ore held above US$110 per tonne, and the S&P/ASX 200 Resources index had climbed roughly 12% year-to-date. These are not ambiguous conditions. For investors weighing value investing in Australia, the macro environment of mid-2026 aligns with the historical pattern that has repeatedly favoured value equities over their growth counterparts. What follows is an analysis of why that pattern exists, what the current data shows, how Australian investors can access the theme through ASX-listed ETFs, and where the thesis could break down.
The investment thesis growth investors built on a foundation that no longer exists
Between 2020 and 2024, global growth stocks outperformed global value by a cumulative margin that VanEck Australia estimated at around 60-70 percentage points. That dominance was not an accident of stock selection. It was a mechanical outcome of three structural forces working in concert.
- Near-zero interest rates reduced the discount rate applied to distant future cash flows, inflating the present value of growth companies with earnings weighted years into the future.
- Sustained disinflation kept bond yields compressed, reinforcing the low-discount-rate environment.
- Multiple expansion did most of the heavy lifting: investors paid progressively higher price-to-earnings ratios for the same dollar of earnings growth, a dynamic that compounds when rates fall but reverses when they rise.
By late 2024, the valuation gap had stretched to near multi-decade extremes. MSCI World Value was trading at roughly half the price-to-book multiple of MSCI World Growth, according to VanEck data.
What the last decade required that 2026 does not provide
Russel Chesler, Head of Investments and Capital Markets at VanEck Australia, framed the vulnerability directly: growth stock cash flows are long-duration assets, meaning they are structurally more sensitive to increases in discount rates than the nearer-term cash flows typical of value companies. When rates were falling, that duration was a tailwind. In a higher-for-longer environment, it becomes a headwind.
All three pillars have shifted. Rates remain elevated. Inflation is sticky. Multiple expansion has stalled. The foundation growth investors built on no longer holds the same weight.
When big ASX news breaks, our subscribers know first
Why inflation historically changes the factor leaderboard
The link between above-trend inflation and value outperformance is not a single data point from a single cycle. It is a pattern documented across decades by multiple independent research teams.
| Source | Timeframe Studied | Inflation Threshold | Key Finding |
|---|---|---|---|
| Capital Group | 1970s to present | US CPI above 3% | Value and dividend-oriented stocks on average outperformed growth |
| Schroders | Developed markets since 1970s | Inflation rising from low levels | Value outperformed when bond yields trended upward |
| Goldman Sachs AM | MSCI World style indices, multiple cycles | Global inflation above 2.5-3% | Value factors outperformed growth in most such periods |
| GMO (Ben Inker) | Multiple rate-regime transitions | Positive but not runaway | Value delivered best relative returns during shifts from falling to rising rates |
| J.P. Morgan AM | Long-term capital market assumptions (2026) | Above-trend inflation, higher real yields | Stronger returns from value and cyclical equity styles historically |
The mechanistic explanation is straightforward. Value companies, concentrated in financials, energy, and materials, have earnings directly leveraged to nominal GDP, commodity prices, and interest margins. When inflation runs above trend, their revenues and profits expand in nominal terms. Growth companies, by contrast, derive much of their valuation from cash flows projected years into the future, and those projections are worth less in present-value terms when discount rates rise.
GMO’s Ben Inker noted that value has historically delivered its best relative performance when inflation is positive but not runaway, especially when markets shift from falling to rising interest-rate regimes.
Australia’s current position, with inflation declining gradually but remaining above target and rates held steady, fits precisely within this pattern.
Factor investing cycles complicate this thesis in a way that raw historical data can obscure: the value premium has suffered multi-year drawdowns even in environments that appeared supportive on macro grounds, and investors who rotated into value after a strong run have historically coincided with subsequent mean reversion.
What value investing actually means and why it suits this environment
Value investing is the systematic identification of companies whose market price trades below an estimate of their intrinsic worth, the amount a business is genuinely worth based on its assets, earnings, and cash flows, independent of its current share price. Returns are generated when that gap between price and intrinsic value narrows over time.
In practice, value strategies screen for companies using metrics such as:
- Price-to-earnings (P/E): share price relative to earnings per share
- Price-to-book (P/B): share price relative to net asset value
- Price-to-cash-flow (P/CF): share price relative to operating cash flow
- Dividend yield: annual dividends as a percentage of share price
Companies that score well on these measures tend to cluster in sectors such as financials, energy, materials, and industrials, rather than in technology or healthcare where valuations are more commonly driven by expected future growth.
Why Australia’s market structure is an unusually close fit for the value thesis
The ASX 200 is not structured like the S&P 500. Where the US index is dominated by mega-cap technology names, the Australian benchmark is weighted heavily toward the major banks (CBA, NAB, ANZ, Westpac) and resource companies (BHP, Rio Tinto, Woodside). These are precisely the sectors that benefit from the conditions already outlined: elevated commodity prices support resource earnings, and higher interest rates widen bank net interest margins.
This means Australian investors do not need to reach for niche exposures to access the value theme. The domestic market’s natural composition already provides concentrated alignment with the macro thesis.
ASX sector concentration cuts both ways in this environment: the heavy weighting toward banks and resources that creates a natural value tilt today also means Australian equity portfolios carry structural underexposure to technology and healthcare sectors that have driven the most significant global equity returns over the past decade.
The 2026 macro backdrop: what the data actually shows
The question is whether the historical pattern described above is theoretical or live. In mid-2026, the Australian data points reinforce each other rather than sending mixed signals.
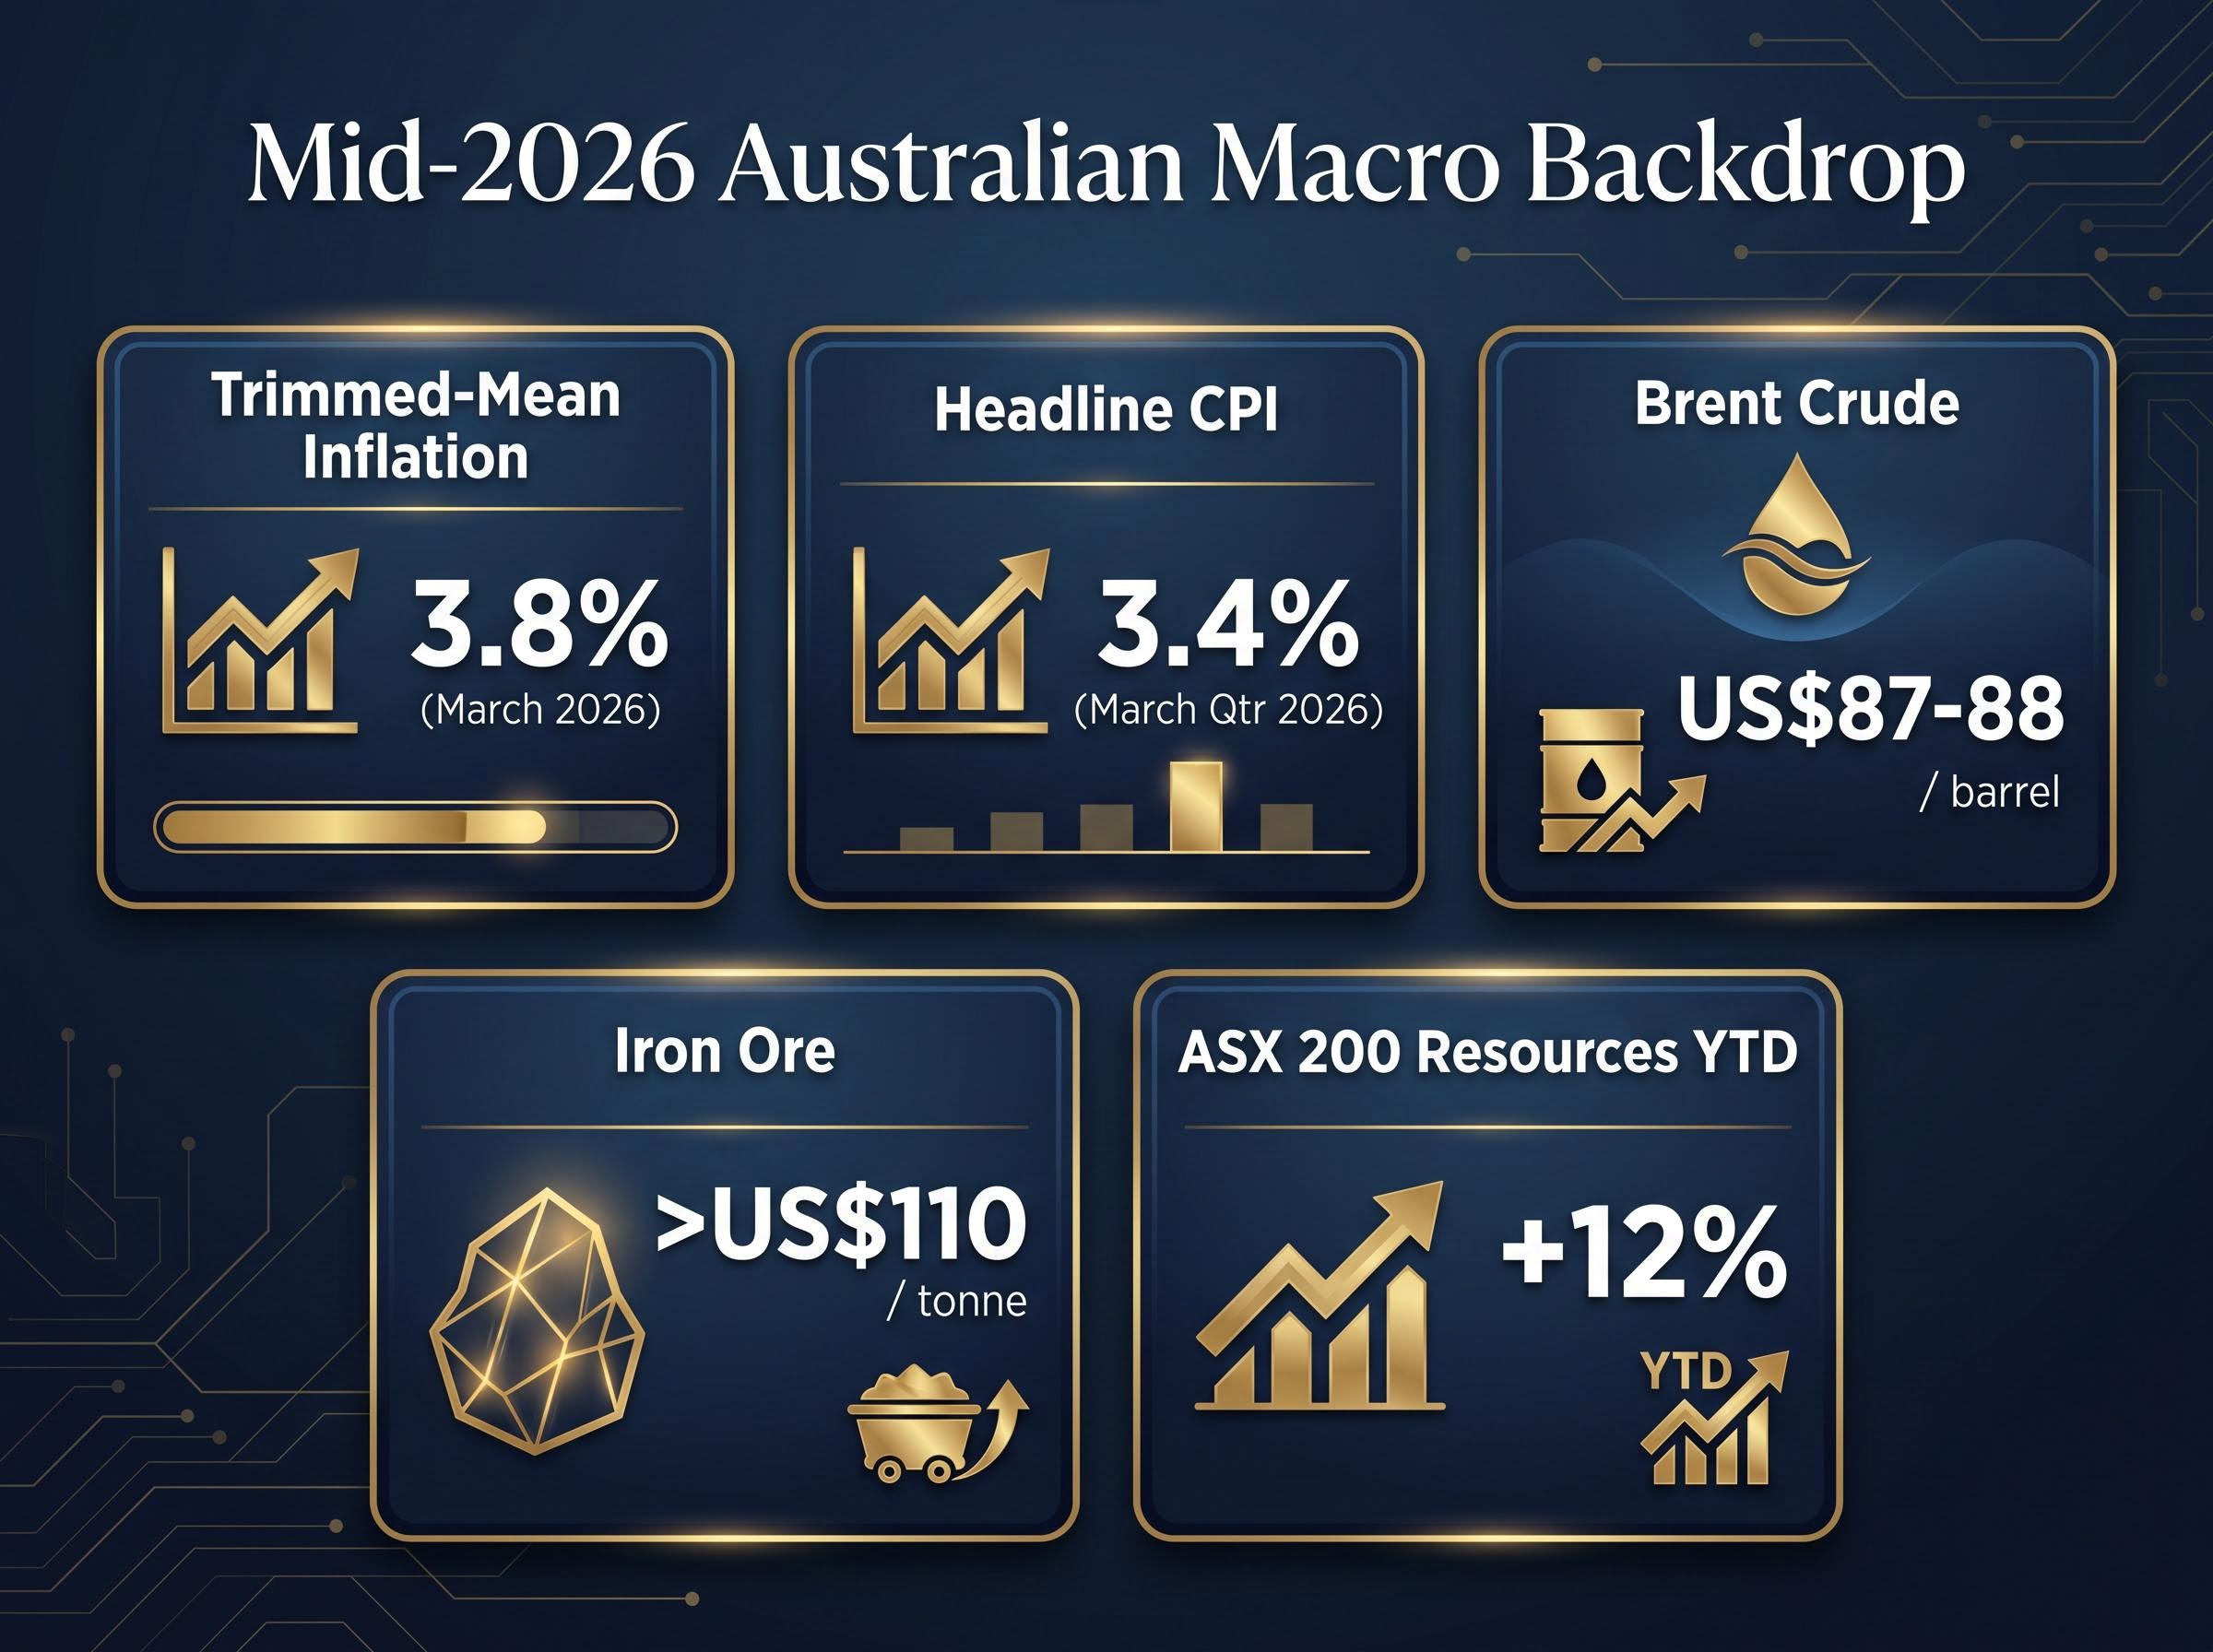
| Indicator | Latest Reading | Source | Implication for Value |
|---|---|---|---|
| Headline CPI (annual) | 3.4% (March quarter 2026) | ABS | Above RBA target band; supports nominal earnings growth in value sectors |
| Trimmed-mean inflation | 3.8% year-on-year | ABS | Core inflation still elevated; rate cuts unlikely near-term |
| RBA cash rate stance | Held steady (May 2026) | RBA | Higher-for-longer rate environment intact |
| Brent crude | ~US$87-88/barrel | AFR, ABC (mid-May 2026) | Supports energy sector earnings |
| ASX 200 Resources (YTD) | ~+12% | The Australian (16 May 2026) | Resources already pricing in commodity strength |
RBA Governor Michele Bullock stated in May 2026 that inflation is “still above target and is expected to decline only gradually over 2026.”
The RBA May 2026 monetary policy decision confirmed that trimmed-mean inflation remains materially above the 2-3% target band, with the Board assessing that price pressures are unlikely to return to target in the near term, a position that keeps the higher-for-longer rate environment firmly intact for financials and resource-exposed equities.
AMP’s Shane Oliver reinforced the point, noting that sticky services prices and geopolitical risks could slow the descent back into the target band. CBA Economics projected headline CPI at approximately 3.1% by Q4 2026, characterising the outlook as “disinflation, not deflation,” with policy remaining restrictive relative to neutral.
The convergence matters. It is not a single above-trend CPI print driving the value case. It is inflation, commodity prices, rate settings, and resource sector earnings all pointing in the same direction simultaneously.
How Australian investors can access value exposure through ASX-listed ETFs
Australian investors allocated over $1 billion in net inflows to three ASX-listed value ETFs over the 12 months to February 2026, according to the Australian Financial Review, with advisers using these vehicles to rebalance away from concentrated US technology exposure. Each of the three funds offers a distinct proposition.
Growth and value style labels on ASX-listed ETFs can be misleading in ways that matter for portfolio construction: two funds carrying the same style classification in 2026 produced returns ranging from under 1% to nearly 16% year-to-date, a divergence that reflects differences in geographic exposure, fund construction methodology, and sector concentration rather than any single macro variable.
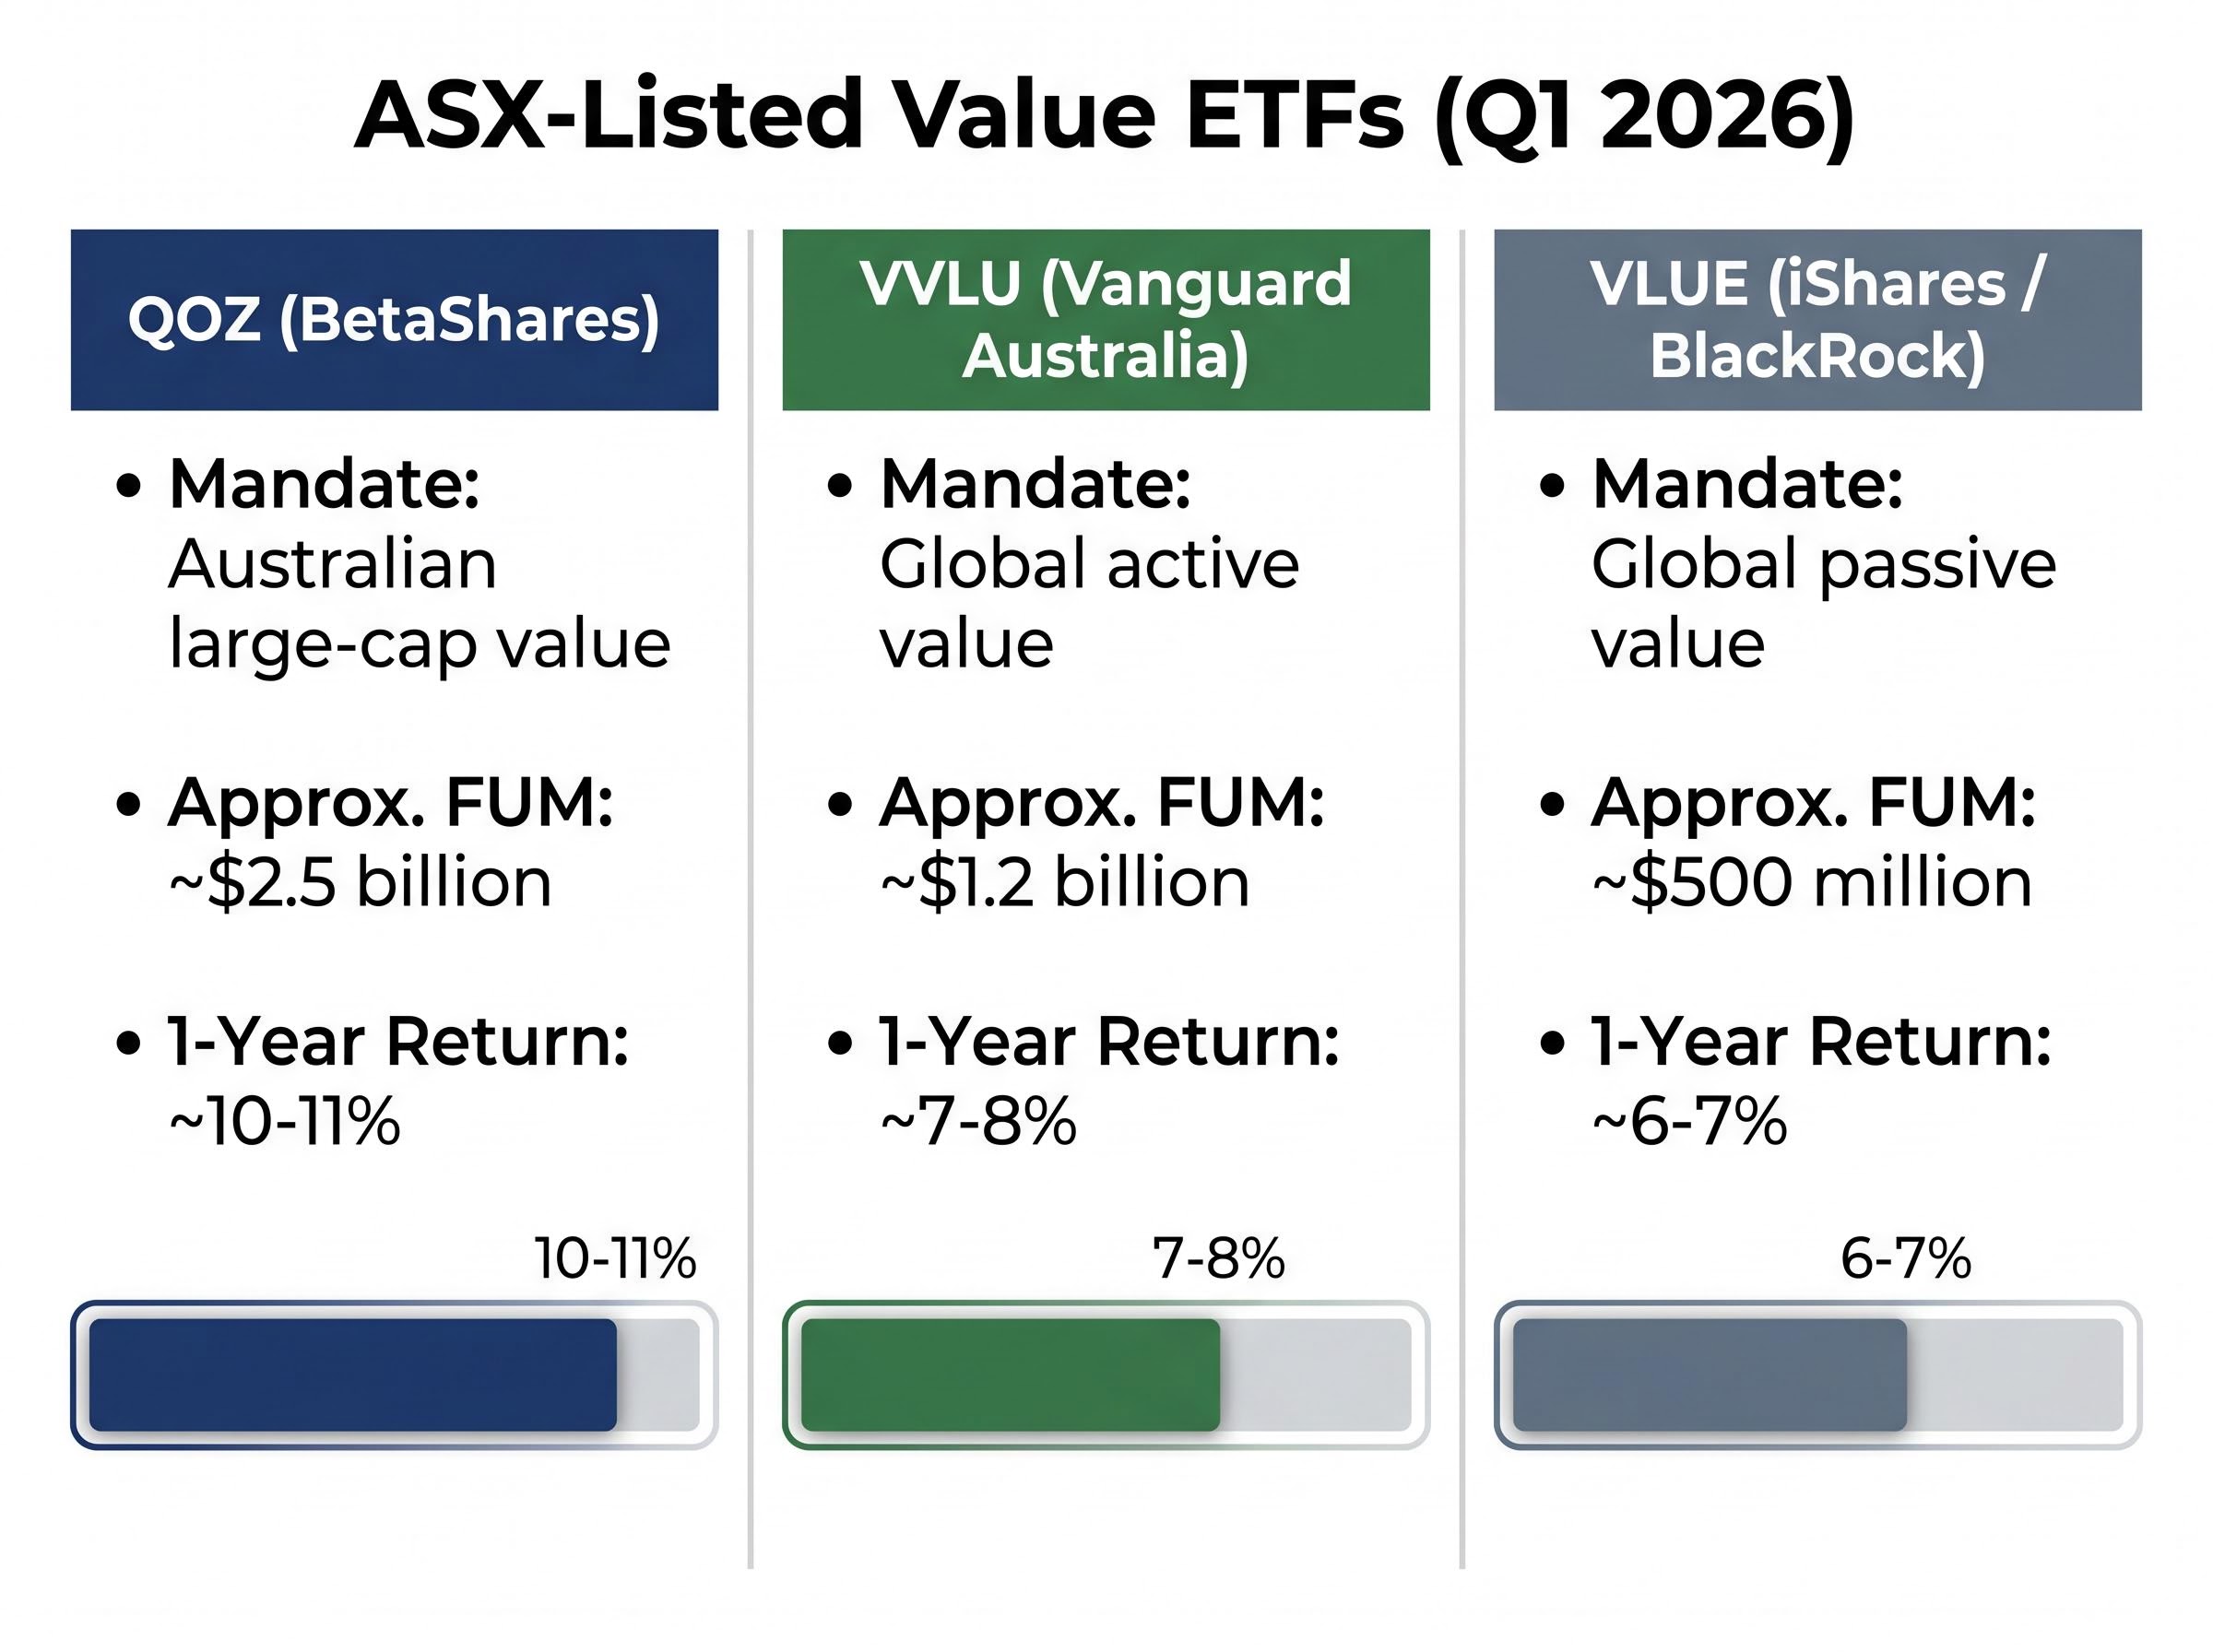
| ETF Ticker | Issuer | Mandate | Approx. FUM (Q1 2026) | Approx. 1-Year Return |
|---|---|---|---|---|
| QOZ | BetaShares | Australian large-cap value | ~$2.5 billion | ~10-11% |
| VVLU | Vanguard Australia | Global active value | ~$1.2 billion | ~7-8% |
| VLUE | iShares (BlackRock) | Global passive value | ~$500 million | ~6-7% |
Note: All performance and FUM figures are approximate and sourced from fund manager materials. Verify current figures directly with issuers before making investment decisions.
QOZ tracks the FTSE RAFI Australia 200 Index, which weights holdings by fundamental metrics including sales, cash flow, dividends, and book value rather than market capitalisation. This methodology produces a structural overweight to banks and resources relative to standard ASX 200 index funds.
- Key distinction: fundamental weighting delivers a value tilt without requiring active stock selection.
VVLU is an actively managed global value fund where Vanguard’s investment team selects securities using discretionary judgment within a value framework.
- Key distinction: active security selection offers the potential to add returns above a passive value benchmark, with global diversification beyond Australian equities.
VLUE tracks the MSCI World Enhanced Value Index, holding approximately 250 companies from international developed markets across large and mid-cap segments.
- Key distinction: passive, rules-based global value exposure at typically lower management costs than active alternatives.
The risks that could stall the value rotation before it completes
A one-sided case is not an honest case. Three specific scenarios could undermine the thesis, ranked by near-term probability.
- Inflation retreats faster than forecast. If headline CPI falls back within the 2-3% target band sooner than the RBA’s projected 2027 timeline, the macro support for financials and resources weakens. The RBA’s own forecasts project this eventual return, meaning the supportive environment has a visible expiry date. CBA Economics’ characterisation of the outlook as “disinflation, not deflation” is a reminder that the direction of travel favours growth stocks over time, even if the pace is slow.
- US mega-cap technology earnings prove resilient regardless. The simple thesis that “higher rates hurt growth” has limits. Several US mega-cap technology companies demonstrated earnings resilience through 2024 and 2025 that partially decoupled their share prices from discount-rate sensitivity. If that pattern continues, the global growth-versus-value gap may narrow less than the macro argument implies.
Growth stock valuations complicate the simple higher-rates-hurt-growth argument: several mega-cap technology names reported earnings in late April 2026 that came in broadly strong, with AI-driven revenue growth materialising in reported numbers and supporting potential upward fair value revisions that could narrow the value-growth gap independent of macro conditions.
- The rotation stalls, as it has before. VanEck’s own February 2025 commentary that the value rotation is “far from complete” implicitly acknowledges a history of false starts between 2020 and 2024. Value rallied, then stalled, then rallied again.
Platinum Asset Management CIO Andrew Clifford noted in mid-2025 that conditions were “in place for a multi-year normalisation” in the value-growth relationship, a framing that signals patience, not urgency.
Investors positioning for this theme should calibrate expectations accordingly. The historical evidence supports the direction, but the timeline is measured in years, not quarters.
The value case in 2026 is historically coherent, but it demands patience
The macro conditions present in Australia in mid-2026, above-target inflation, elevated commodity prices, a higher-for-longer rate environment, and a near-extreme valuation gap between growth and value, align with the historical pattern under which value equities have outperformed across multiple cycles and geographies. The evidence from Capital Group, Schroders, Goldman Sachs Asset Management, GMO, and J.P. Morgan Asset Management is consistent on this point.
The rotation, however, is likely to be gradual. Investors adding value exposure today are positioning for a multi-year thesis, not a short-term trade. Fund factsheets for QOZ, VVLU, and VLUE are available directly on the BetaShares, Vanguard Australia, and iShares Australia websites, where current fees, performance, and portfolio composition can be verified before any allocation decision.
This article is for informational purposes only and should not be considered financial advice. Investors should conduct their own research and consult with financial professionals before making investment decisions. Past performance does not guarantee future results. Financial projections are subject to market conditions and various risk factors.