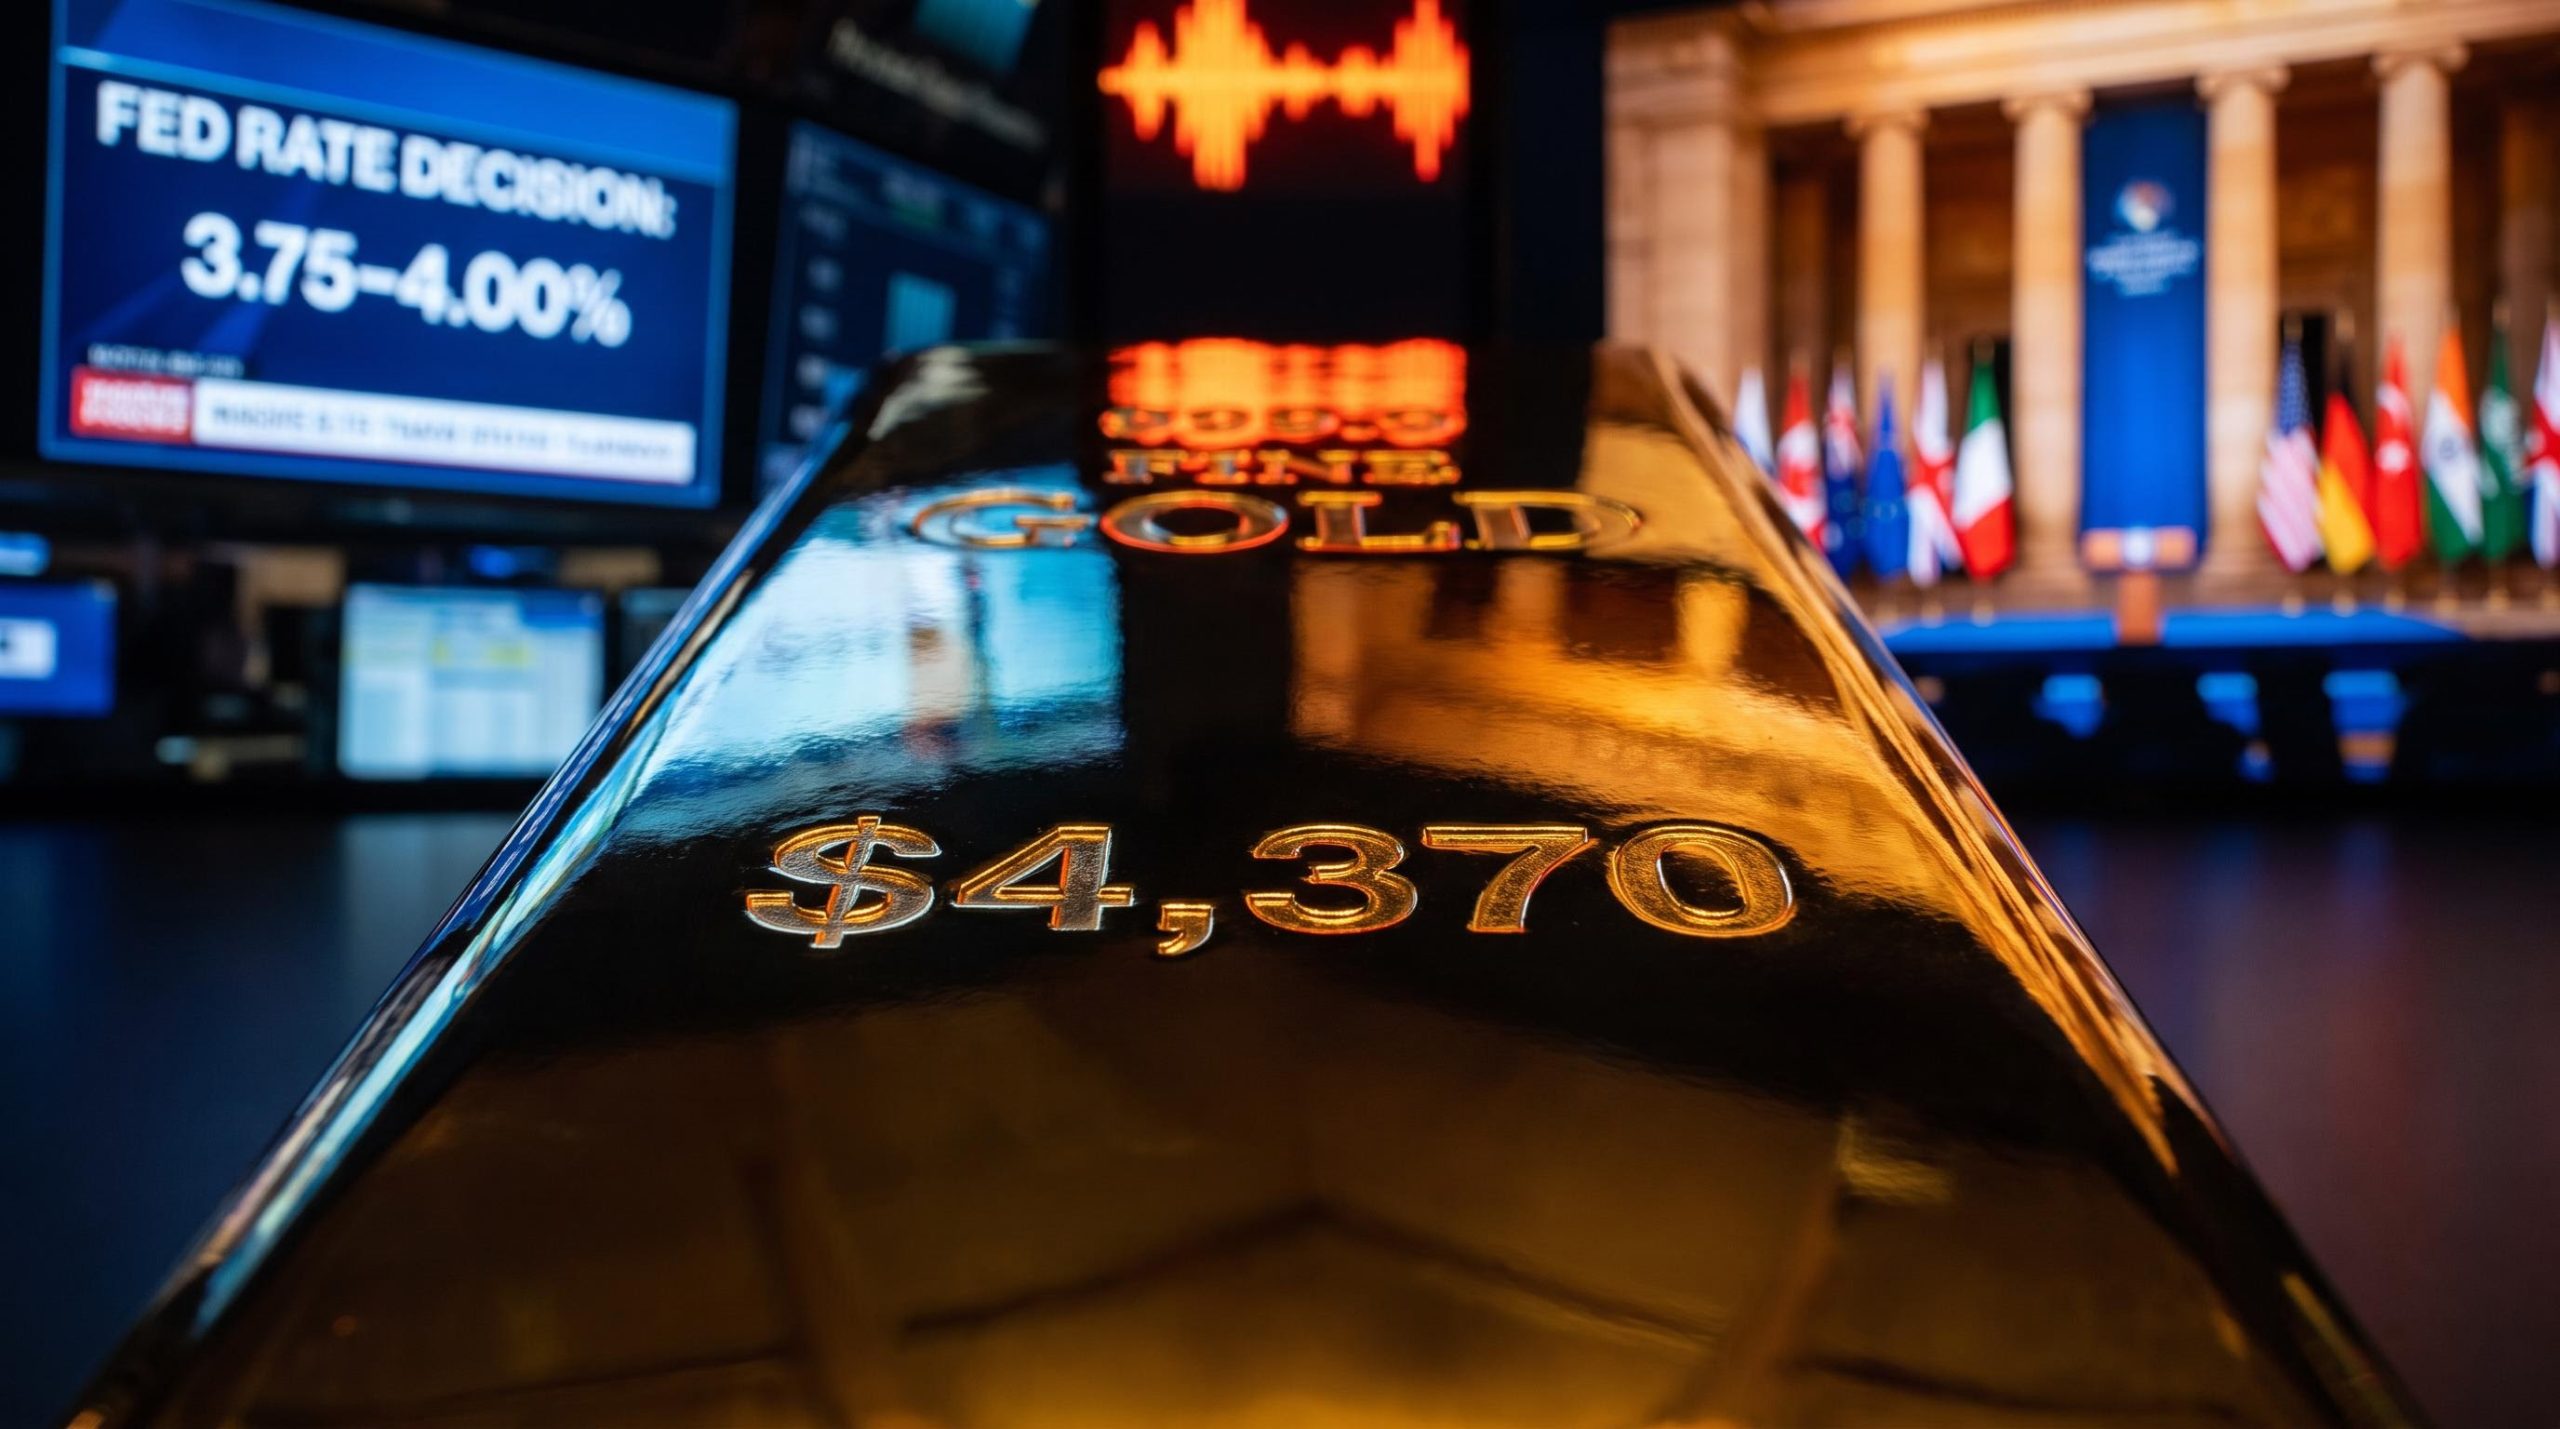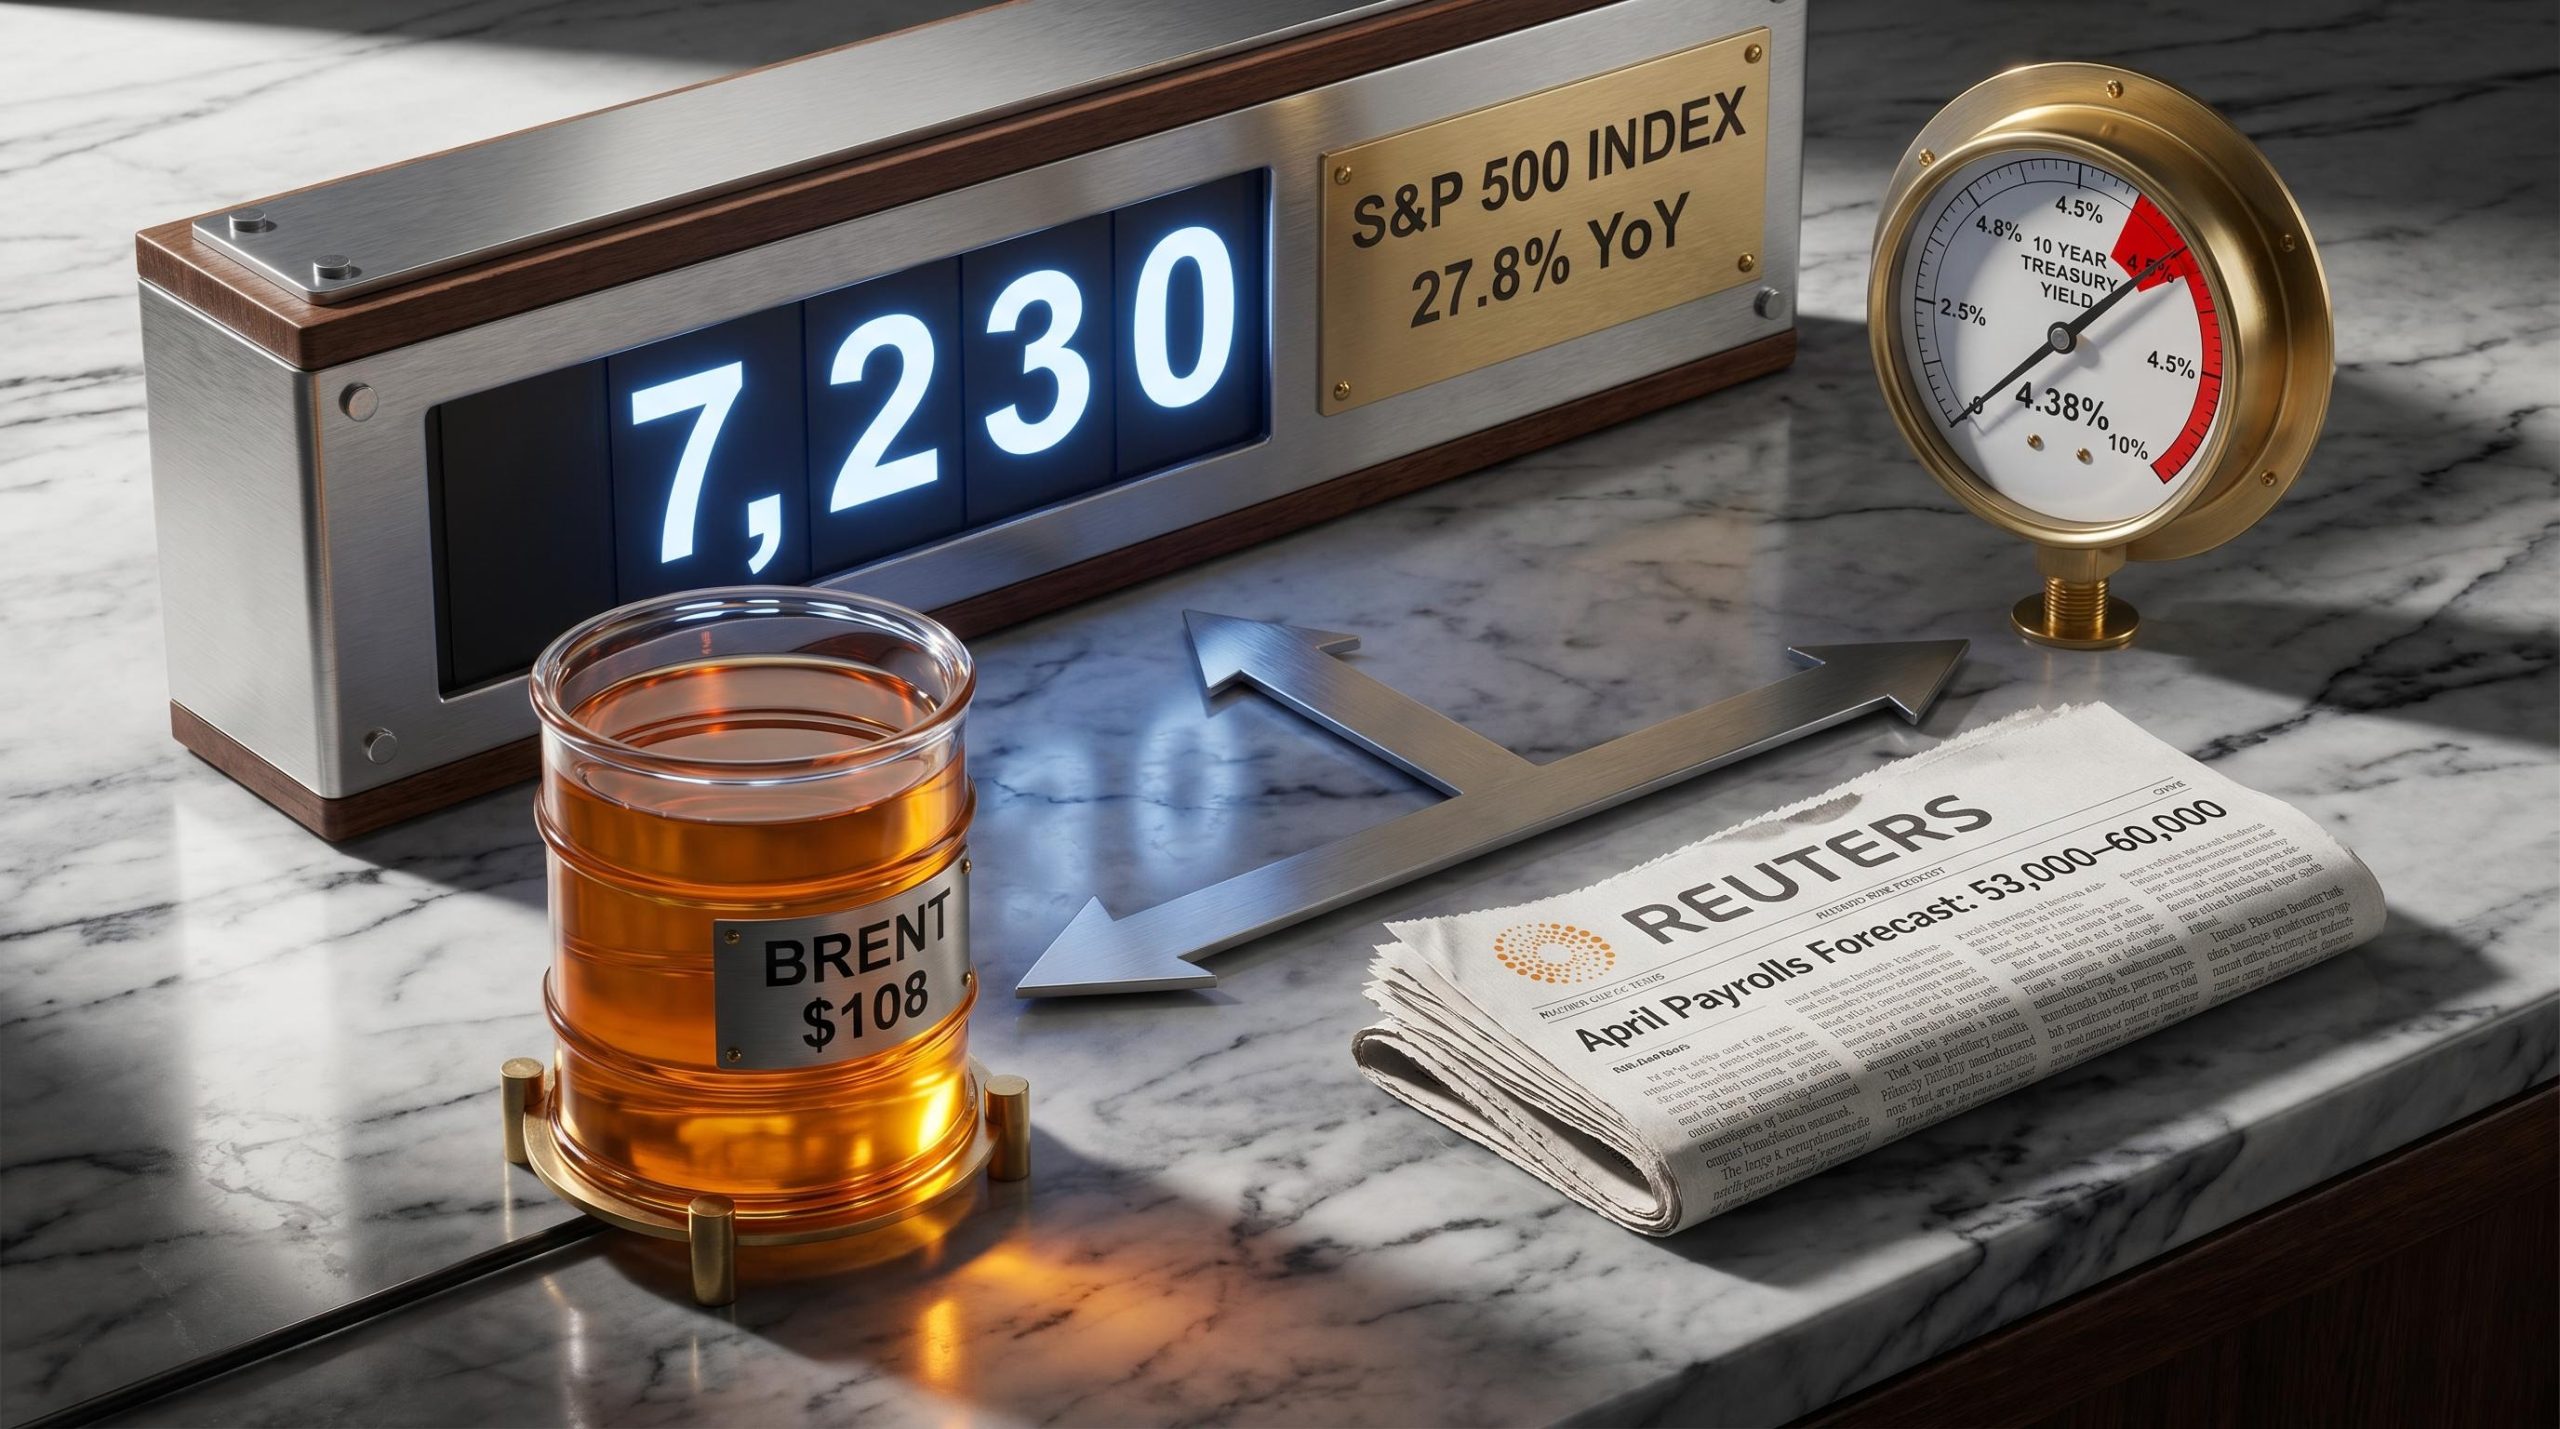
The S&P 500 posted its strongest monthly gain since 2020 in April, climbing more than 10% to close at approximately 7,230 on 1 May 2026. The rally’s foundation is genuine: Q1 earnings growth tracked at 27.8% year-over-year, the highest quarterly rate since Q4 2021. Yet three macro forces are now converging in a direction that complicates the US stock market outlook considerably. Crude oil sits near a four-year high following a two-month US-Israeli conflict with Iran. Hawkish dissent inside the Federal Reserve has stalled any prospect of near-term rate cuts. And the April jobs report, due 8 May, is forecast to deliver payroll growth of just 60,000, the weakest figure in years. What follows is a breakdown of each headwind in concrete terms: what the data shows, which thresholds matter, and how the three risks interact to narrow the margin for error in the bull case.
A rally built on earnings, now running into macro resistance
The numbers deserve respect before the caveats arrive. The S&P 500’s April gain of more than 10% was accompanied by a Nasdaq surge exceeding 15%, also its best monthly performance since 2020. Driving both moves was a Q1 earnings season that, according to LSEG Data & Analytics senior research analyst Tajinder Dhillon, tracked at 27.8% year-over-year growth, the highest quarterly rate since Q4 2021.
JPMorgan raised its year-end S&P 500 target to 7,600 (from a prior 7,200), implying roughly 5-6% upside from early May levels. The bull case is not built on hope; it is built on delivered profit growth.
Angelo Kourkafas, Edward Jones, has noted that rapid profit expansion is being countered by upward pressure from oil prices and bond yields, suggesting a potential consolidation period ahead.
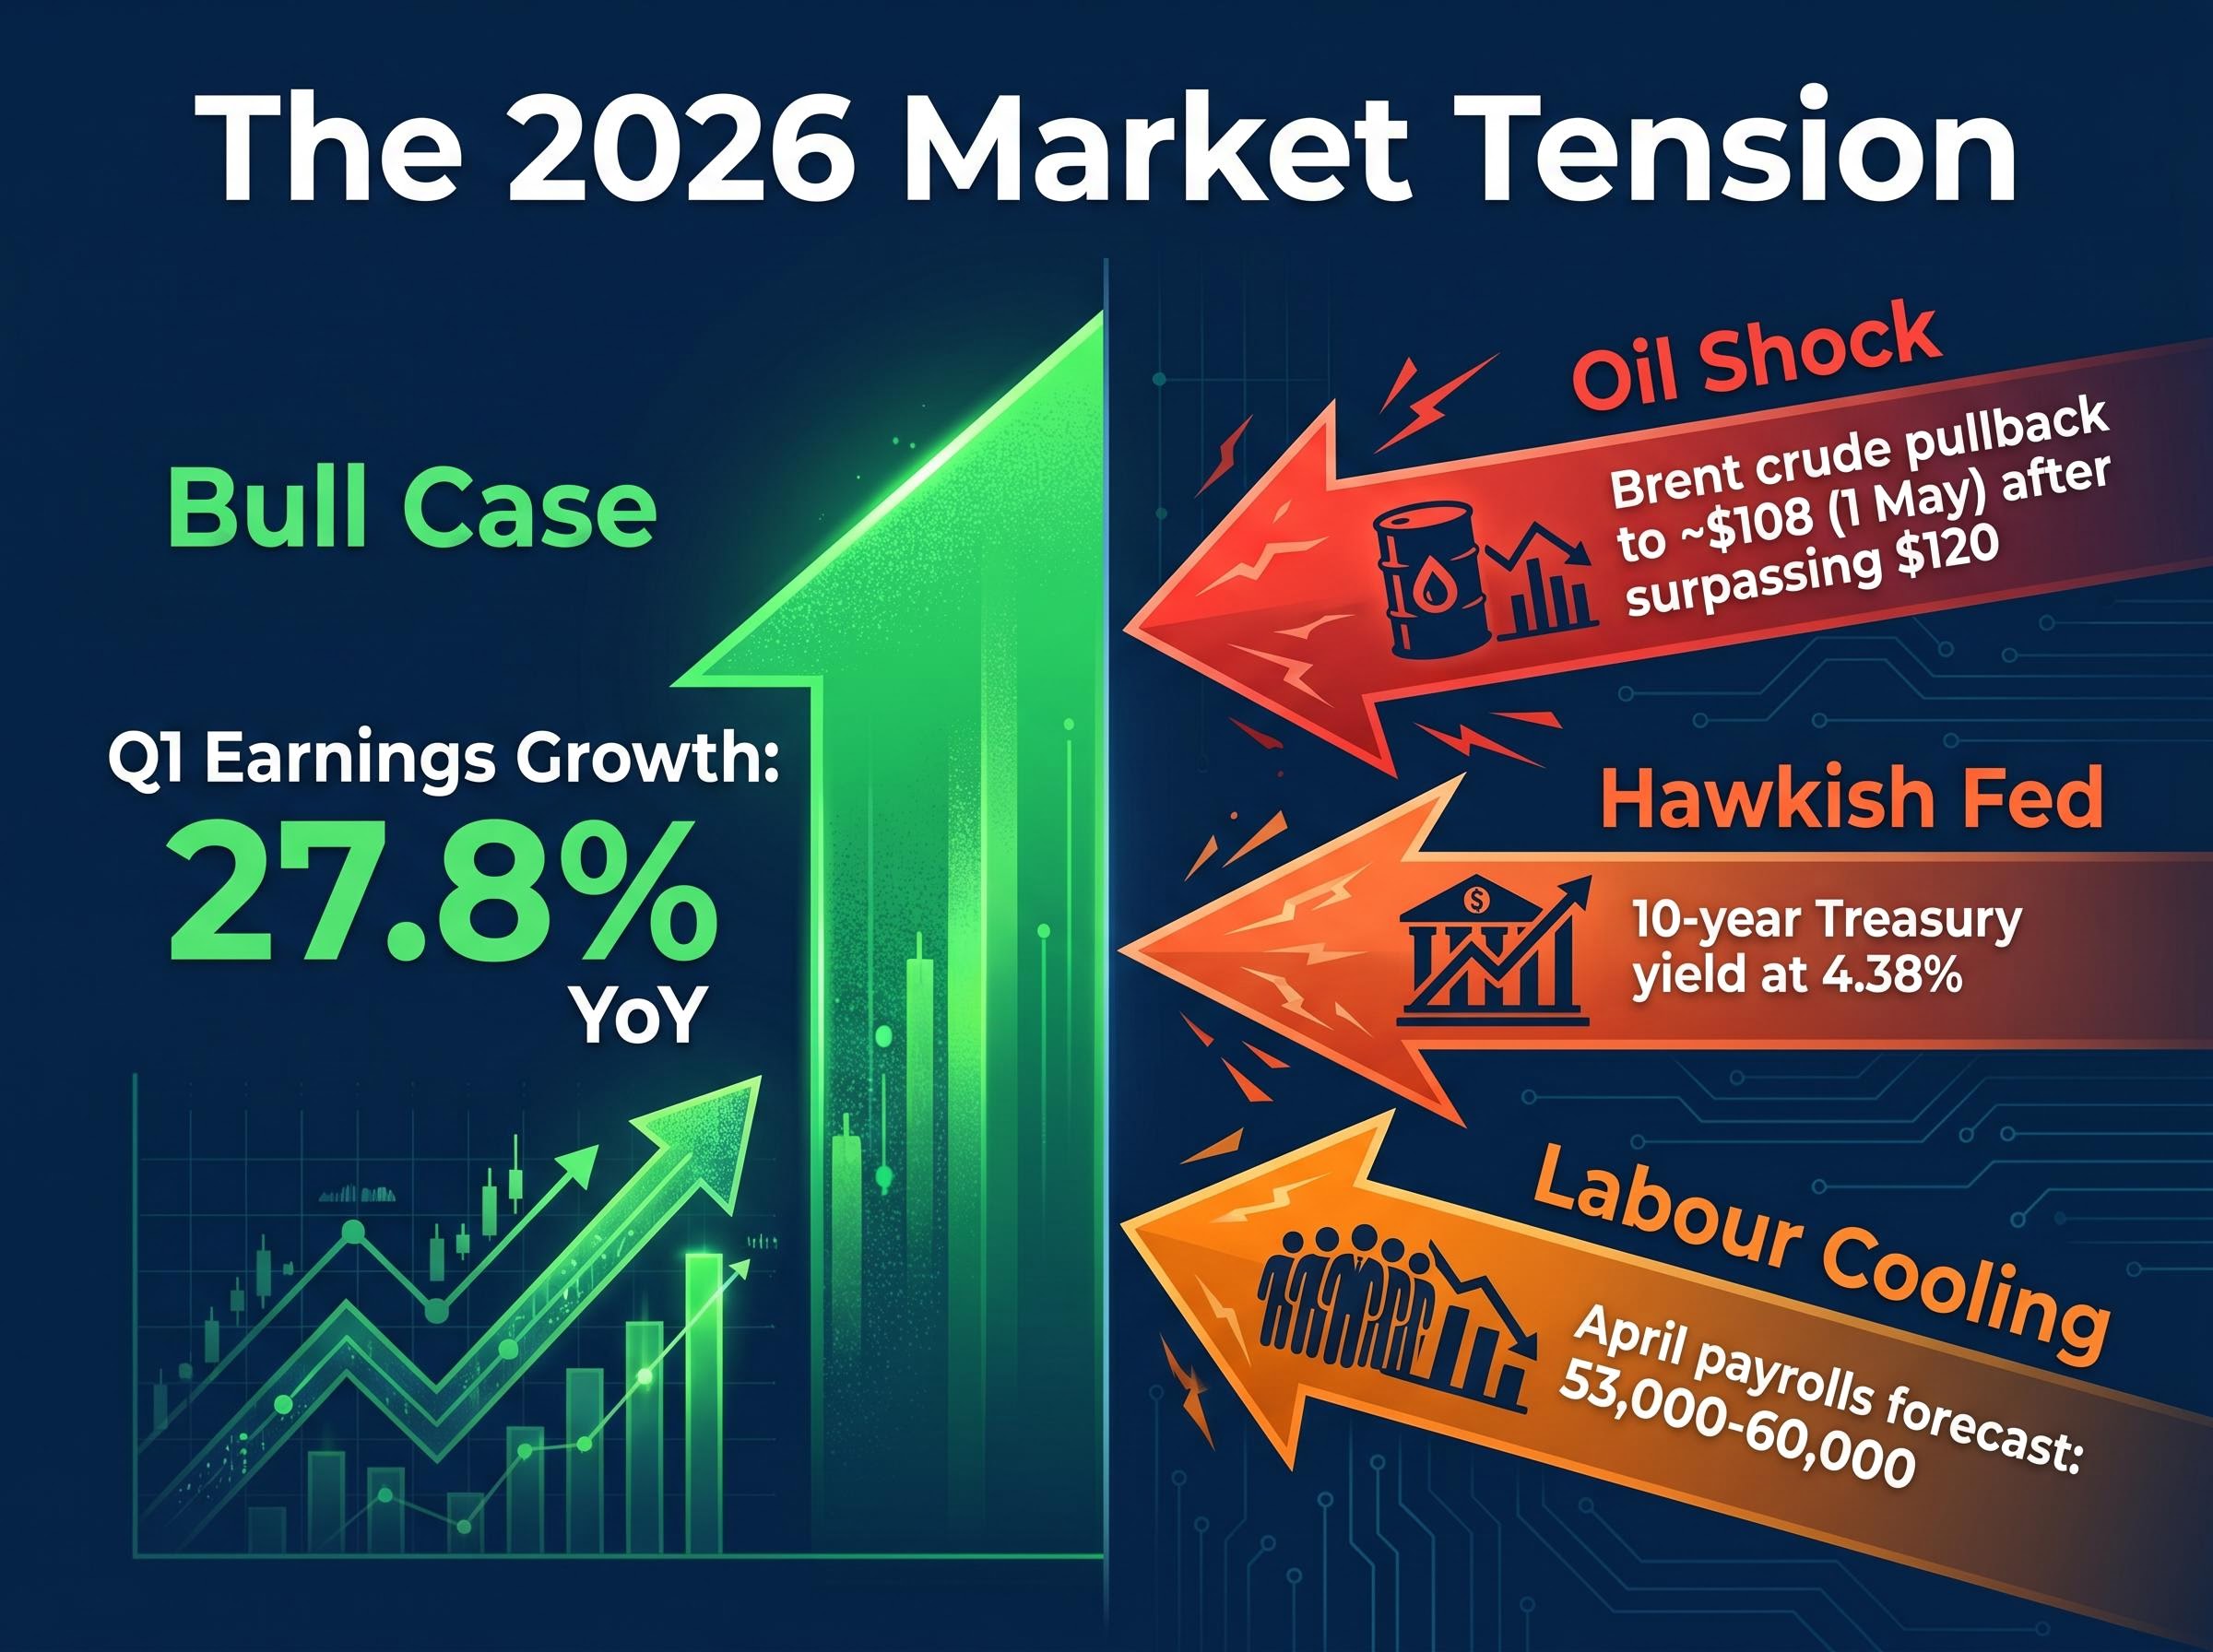
The tension sits in what happened alongside the earnings strength. The same weeks that produced a record rally also produced three converging signals moving in the opposite direction:
- Oil shock: Brent crude surpassed $120 per barrel, its highest level in four years
- Hawkish Fed hold: Three board members dissented on inflation language, with the 10-year yield pressing toward 4.4%
- Labour market cooling: April payrolls are forecast at 53,000-60,000, a sharp deceleration from March’s 178,000
The analytical question is precise: can earnings momentum sustain equity valuations when the macro environment is deteriorating on three fronts simultaneously?
The disconnect between headline severity and equity market reactions is a structural feature of how markets price risk, not a sign of complacency: geopolitical risk and stock market behaviour have historically diverged because investors process conflict as a probability-weighted input to future earnings rather than a proportional shock, which is precisely why the April rally and the oil spike coexisted for several weeks.
When big ASX news breaks, our subscribers know first
How a two-month conflict pushed crude oil to a four-year high
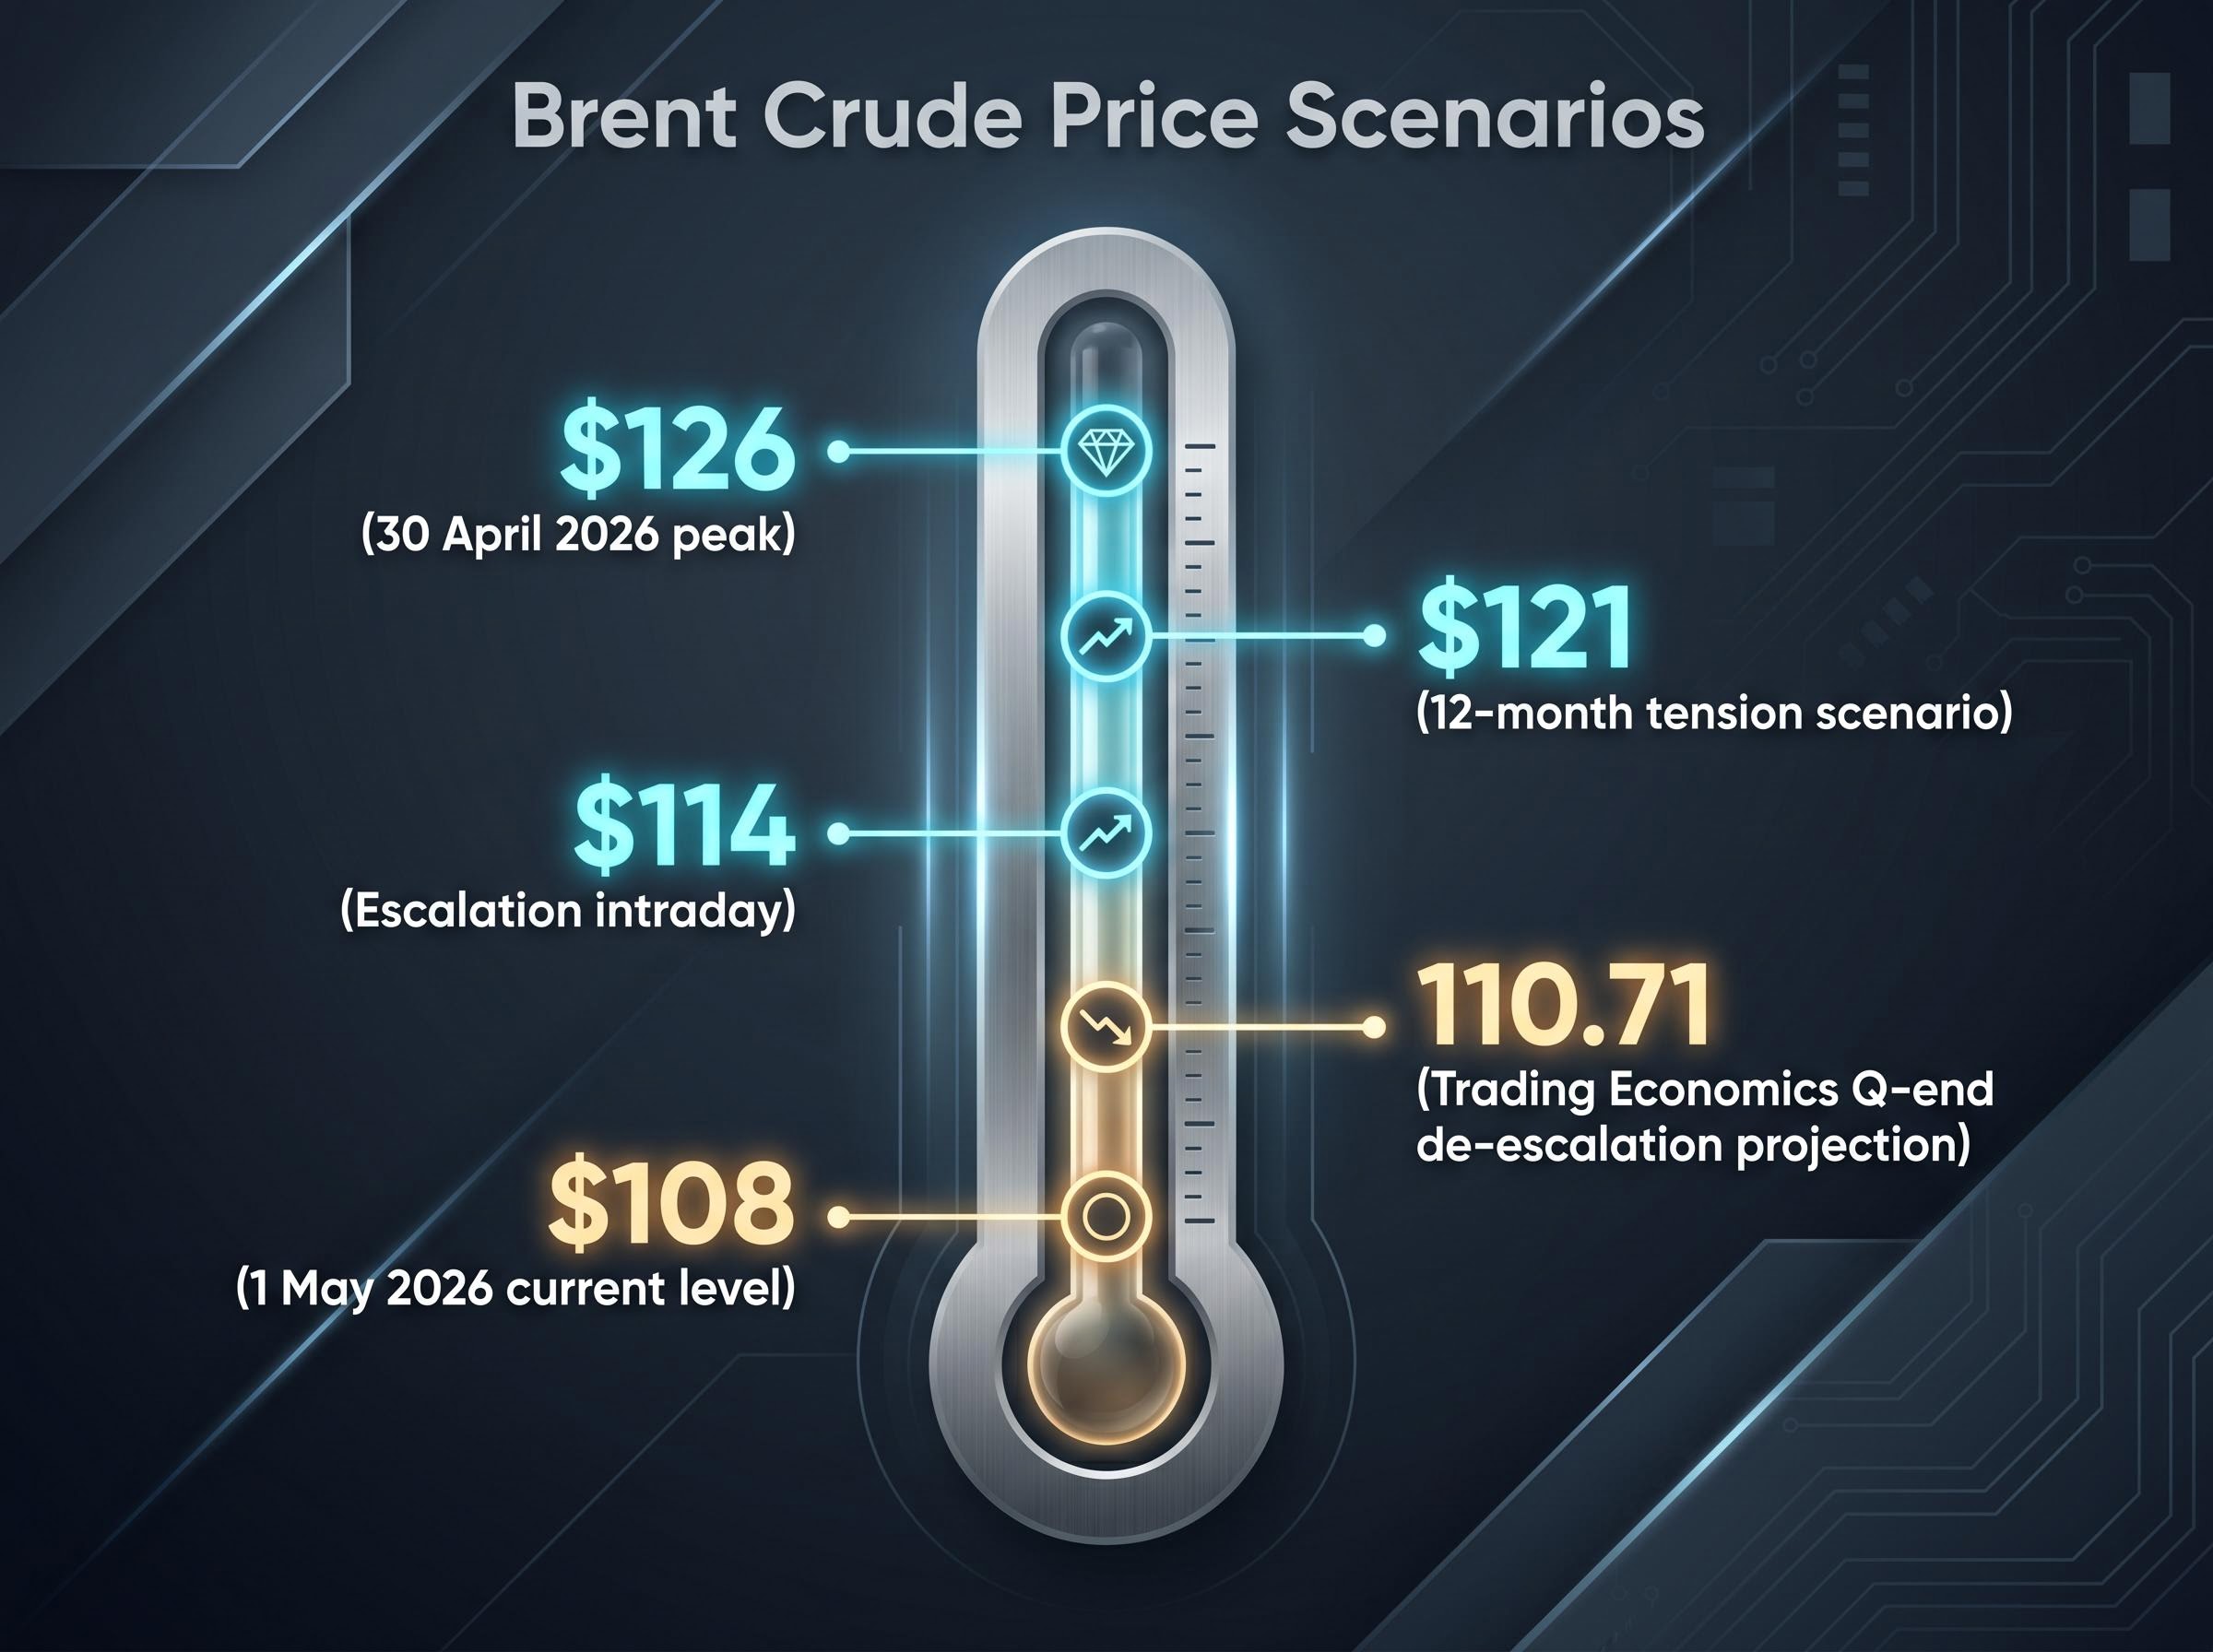
The oil price spike did not arrive from a single headline. It built over two months of escalation between the United States, Israel, and Iran, compounded by stalled nuclear talks and the Trump administration’s reaffirmation of a naval blockade posture in the Persian Gulf. The result was a supply disruption that pushed Brent crude past $120 per barrel during the week of 1 May, with the June delivery contract briefly exceeding $126 on 30 April 2026.
The pullback was almost as sharp. Brent retreated to approximately $108 per barrel on 1 May, a roughly 5% single-day decline, as ceasefire diplomacy introduced downside pressure on prices.
Jeff Buchbinder, LPL Financial, has stated that the ongoing blockade and active military operations could materially worsen the economic outlook if sustained over coming months.
Elevated oil prices transmit into equity markets through three direct channels:
- Margin compression: Higher energy input costs squeeze profit margins for non-energy sectors, particularly consumer discretionary and industrials
- Inflation persistence: Crude above $108 feeds directly into headline CPI, complicating the Federal Reserve’s rate-cut calculus
- Safe-haven dollar strength: The yen traded at approximately 160.02 against the dollar as of early May, reflecting defensive capital flows that pressure multinational earnings
What price level changes the calculus?
The binary that shifts the projection range sits between two scenarios. Trading Economics models project Brent at 110.71 by end of the current quarter under a de-escalation scenario tied to ceasefire diplomacy. If tensions persist over 12 months, prices could return toward $121. An escalation without a Strait of Hormuz reopening could push prices above $114 intraday, as recent market reactions have already demonstrated.
Ceasefire diplomacy remains the primary mechanism applying downside pressure on prices. Without it, the $121 scenario becomes the base case rather than the tail risk.
What oil prices mean for inflation, and why the Fed cannot look away
The transmission from oil prices to Federal Reserve policy runs through a logical chain that is worth spelling out clearly. Energy costs feed directly into headline Consumer Price Index (CPI) readings, the inflation measure the Fed monitors most visibly. When crude rises, petrol prices follow within weeks. But the effect extends beyond the pump: higher diesel and shipping fuel costs raise transportation expenses across supply chains, lifting production costs for goods and services that have no direct connection to energy.
This creates a specific policy problem. An oil-driven inflation spike is not caused by excessive consumer demand. Raising interest rates does not reduce the cost of crude oil. Yet the Fed’s mandate requires it to respond to inflation regardless of its source. The result is a bind: rate hikes would slow economic activity without addressing the root cause of rising prices, while holding rates steady risks allowing inflation expectations to become embedded.
The most recent FOMC meeting made this bind visible. Three Fed board members objected to policy statement language they considered insufficiently attentive to inflation risks that could necessitate a rate increase. The 10-year Treasury yield stood at approximately 4.38% as of 1 May 2026, near a one-month high.
The Federal Reserve’s April FOMC statement, released on 29 April 2026, records the dissenting votes alongside the committee’s formal assessment of inflation risks, confirming that the hawkish internal pressure visible in yield movements reflects documented disagreement at the board level rather than market speculation.
| Scenario | 10-Year Yield | Fed Posture | Equity Valuation Implication |
|---|---|---|---|
| Base case | 4.3-4.4% | Hold, dovish lean | Manageable headwind; multiples stable |
| Hawkish hold | 4.4-4.5% | Hold, hawkish lean | Multiple compression begins; growth stocks under pressure |
| Rate hike signal | Above 4.5% | Active tightening bias | Valuation reset trigger; equity risk premium thins materially |
The 4.5% threshold: why this number matters
According to Angelo Kourkafas of Edward Jones, a 10-year yield above 4.5% could prompt investors to reassess equity valuations more cautiously. The mechanism is straightforward: as the risk-free rate rises, the yield available from government bonds competes more directly with the earnings yield on equities. At 4.5%, the equity risk premium (the additional return investors demand for holding shares instead of bonds) becomes thin enough that capital begins rotating toward fixed income.
The current 4.38% level means the market is close to this threshold but has not crossed it. That proximity is itself a source of volatility sensitivity.
What the April payrolls number means for monetary policy
The April nonfarm payrolls report, due from the Bureau of Labor Statistics on 8 May 2026, arrives as the third data point in what is becoming a clear deceleration pattern. March delivered 178,000 jobs. February showed significant employment weakness. The April consensus forecast sits at 53,000-60,000, according to a Reuters economist survey conducted on 1 May.
Jeff Buchbinder of LPL Financial has described the labour market as slowing but still holding up. Q1 2026 GDP growth accelerated, with AI-related capital spending boosting business equipment investment and providing a partial offset to labour softness. The economy is not collapsing; it is cooling in a way that would normally increase pressure on the Fed to cut rates.
The K-shaped consumer recovery adds a layer of complexity to the payrolls picture that aggregate employment figures do not capture: while headline retail spending held up in March 2026, higher-income households are inflating that aggregate, masking the financial depletion running through lower-income cohorts whose savings buffers are nearly exhausted and whose discretionary spending has already shifted toward discount retail.
The problem is that “normally” does not apply when war-driven inflation is running simultaneously. A weak payroll print would confirm labour market deceleration but would not free the Fed to act on it, because cutting rates into an oil-driven inflation spike risks embedding higher price expectations.
| Month | Payrolls (000s) | Market Interpretation |
|---|---|---|
| February 2026 | Significant decline | Initial softening signal; treated as one-month anomaly |
| March 2026 | 178 | Partial rebound; soft-landing narrative intact |
| April 2026 (forecast) | 53-60 | Pattern confirmation; rate-cut timeline repricing |
Three scenarios for the 8 May release and their immediate implications:
- Beat (above 100,000): Soft-landing narrative stabilises; Fed maintains hawkish hold without additional pressure; equities likely rally on relief
- In-line (53,000-60,000): Deceleration confirmed; rate-cut expectations shift but remain constrained by inflation; modest equity volatility
- Miss (below 40,000): Recession risk repricing begins; bond yields could fall sharply as markets price emergency cuts, but Fed’s inflation bind limits its ability to deliver them
When three headwinds converge: what history and strategists say
Each of the three risks described above is manageable in isolation. An oil shock without inflation persistence is a temporary margin headwind. A hawkish Fed without labour weakness is a valuation compression that earnings growth can absorb. A soft jobs market without inflation is a catalyst for rate cuts that support equities.
The convergence changes the calculus. Oil raises inflation. The hawkish Fed cannot offset it with cuts. Weak payrolls prevent the economy from growing through the problem. The three forces amplify each other rather than operating independently.
Wall Street’s consensus forecast of approximately 9% average S&P 500 returns for 2026 embeds three assumptions that are worth making explicit. JPMorgan’s raised target of 7,600 relies on:
- Geopolitical de-escalation bringing Brent crude sustainably below $110
- No rate hike from the Fed; eventual pivot toward cuts in H2 2026
- Labour market stabilisation above recession-signal thresholds
If any one of those assumptions fails, the target becomes aspirational rather than base-case.
Equity valuations at elevated levels create an asymmetric sensitivity to the specific triggers described above: when the S&P 500 hits its year-end target in April, as it effectively did in 2026, the structural support for continued upward momentum weakens, because future returns must be funded by earnings growth alone rather than any combination of earnings growth and multiple expansion.
Sector rotation under this convergence follows a clear pattern:
| Macro Headwind | Sector Most Exposed | Sector That Benefits |
|---|---|---|
| Oil shock (Brent $108-$121) | Consumer discretionary, airlines, industrials | Energy producers |
| Hawkish Fed hold | Rate-sensitive sectors (real estate, utilities) | Financials |
| Weak payrolls | Consumer-facing sectors, domestic services | Defensive equities, healthcare |
Technology has provided a partial offset. The Philadelphia SE Semiconductor Index gained approximately 48% from late March through early May 2026, with AMD shares rising more than 80% in the same period. AI-driven capital expenditure continues to support a segment of the market that is less sensitive to oil-driven inflation.
China’s factory activity slowdown from the energy shock may also pressure industrials and materials companies with significant Asian supply chain exposure.
The bull market is intact but the margin for error has narrowed
The rally is real. 27.8% earnings growth, a 10% monthly gain, and a raised JPMorgan target of 7,600 are not artefacts of sentiment. They reflect delivered corporate performance.
The risks are also real. They do not cancel each other out. An oil shock, a hawkish Fed hold, and a cooling labour market are converging in a way that narrows the conditions under which the bull case holds.
Three monitoring signals deserve attention over the next 30-60 days:
- 10-year Treasury yield at 4.5%: This is the valuation reset trigger identified by Edward Jones. Currently at 4.38%, proximity alone introduces volatility sensitivity.
- Brent crude sustained above $120: A return to the 30 April intraday levels without ceasefire progress would reignite inflation expectations and tighten the Fed’s bind further.
- 8 May payrolls print: A result below 40,000 would force recession-risk repricing; a result above 100,000 would stabilise the soft-landing narrative.
Current strategist guidance supports a positioning framework rather than a directional bet:
- Remain overweight equities overall, but diversify internationally to reduce US concentration risk
- Increase exposure to small caps and emerging markets as part of a global allocation
- Maintain selective sector exposure: energy for the oil upside, financials for the rate environment, technology for the AI capital expenditure cycle
The practical advantage of this kind of macro framework is straightforward. Investors who know which numbers to watch can respond to evidence rather than sentiment. The bull market’s thesis has not broken, but the three data points that could break it are all arriving within the same month.
A consistent geopolitical risk investing strategy separates systematic rebalancing from reactive repositioning, a distinction that matters most when three macro headwinds converge simultaneously and the instinct to act on each new data point is strongest: Goldman Sachs, Morgan Stanley, and Charles Schwab have all converged on maintaining dollar-cost averaging into diversified index funds rather than repositioning around individual conflict headlines.
This article is for informational purposes only and should not be considered financial advice. Investors should conduct their own research and consult with financial professionals before making investment decisions. Past performance does not guarantee future results. Financial projections are subject to market conditions and various risk factors.