
Ask most Americans what happens to the economy when oil prices climb, and the answer comes back the same as it would have in 1979: higher prices at the pump, squeezed budgets, a drag on growth. That intuition is now sitting on top of a fact that quietly contradicts it. U.S. petroleum output currently exceeds Saudi Arabia’s by roughly 66% and Russia’s by about 70%, and Brent crude has traded above $100 since early September 2026.
The gap between that old assumption and the current structural reality matters right now, with Brent hovering between $96 and $103 per barrel as of late September 2026 and the U.S. Energy Information Administration (EIA) raising its 2026-2027 price forecasts. If your read on oil prices and the US economy is still built on the 2008 map, both your economic understanding and your portfolio positioning may be pointed at the wrong risks.
Here is the structural case for why elevated oil now helps more than it hurts, the genuine complications that keep it from being a clean win, and a framework for positioning if the thesis holds.
How America became the world’s dominant oil producer
The scale of the shift is easy to underestimate because it happened gradually. U.S. petroleum production now stands at nearly three times its 2008 level, the direct result of the shale revolution that turned marginal geology into the largest oil and gas production base on the planet.
This is a structural transformation, not a cyclical spike. The IEA and EIA have both characterised the post-2008 surge in U.S. unconventional output as a turning point that reordered global supply, giving America the characteristics of a swing producer, a role once held almost exclusively by Saudi Arabia.
OPEC’s pricing power has eroded from controlling more than 50% of global crude supply to roughly 27-28% following the UAE’s formal exit in May 2026, and that structural narrowing is precisely what allows U.S. producers to absorb price upside that would previously have been managed away by cartel coordination.
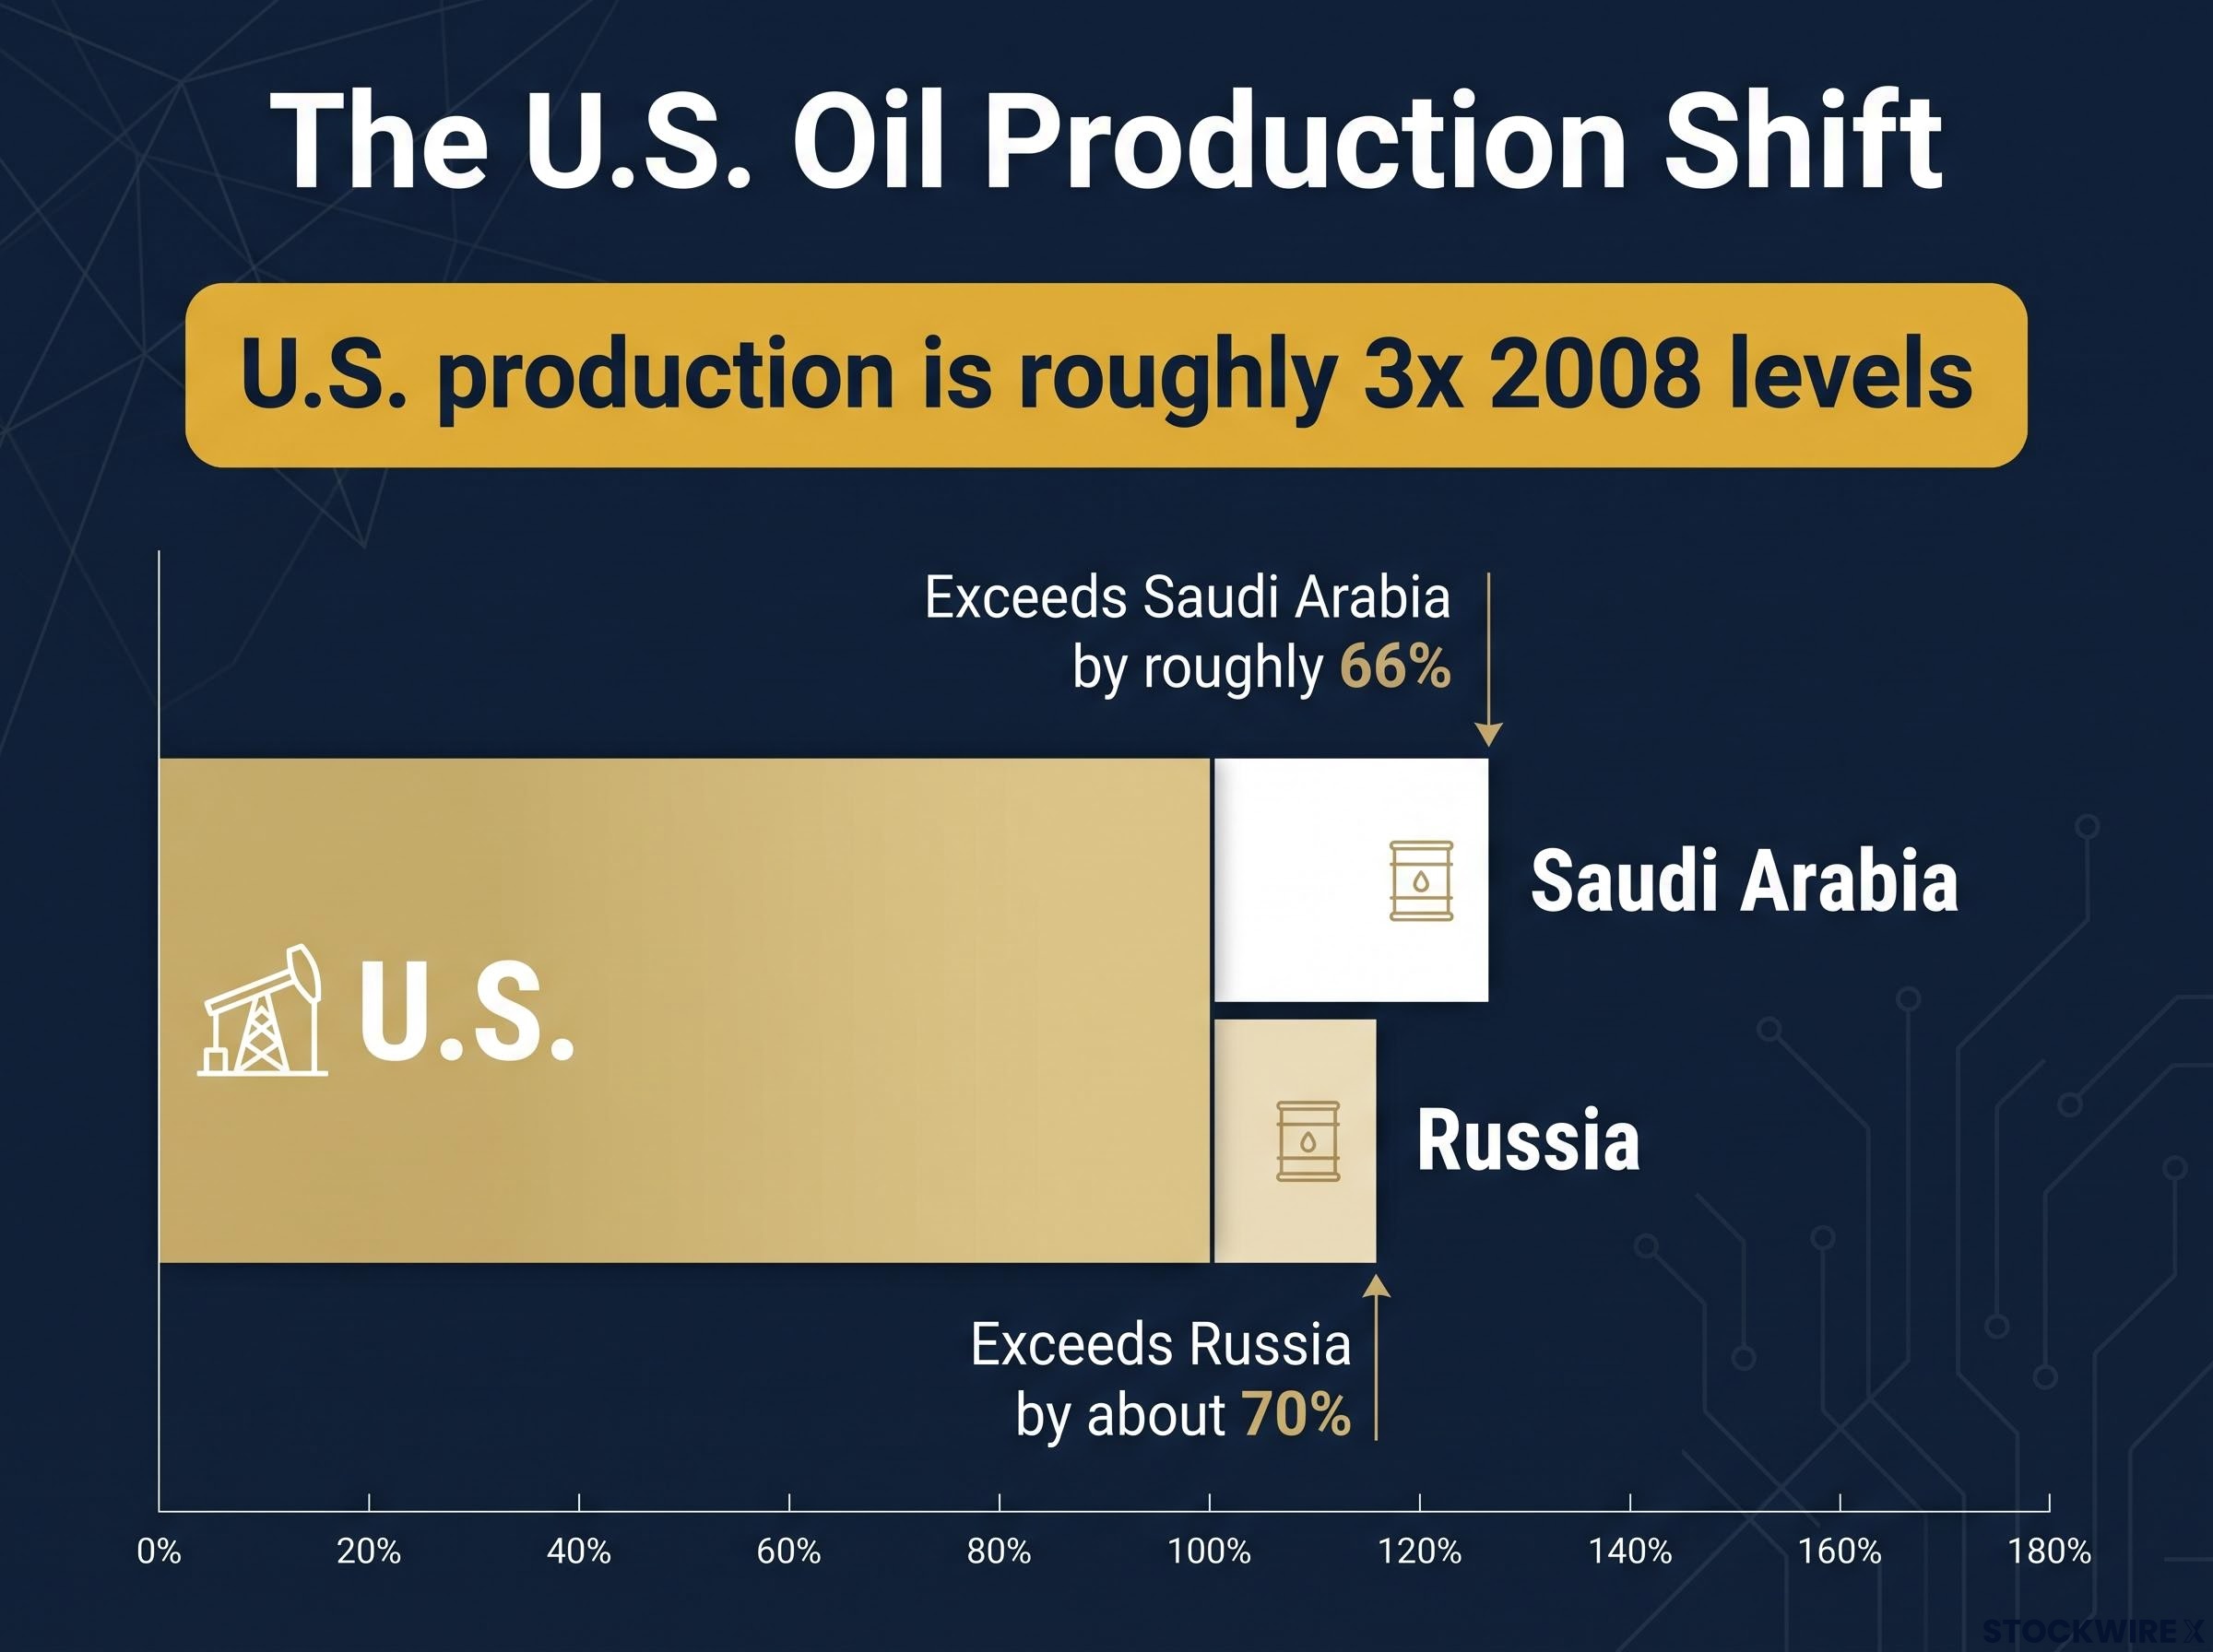
The operational reality shows up in company results. ExxonMobil reported record Permian Basin production of more than 1.8 million oil-equivalent barrels per day in Q2 2026, a single-company figure that would have seemed implausible two decades ago.
| Country or Benchmark | Production vs. 2008 | Comparative output | Notable recent data point |
|---|---|---|---|
| United States | ~3x 2008 levels | World’s leading producer | Brent above $100 since 3 Sept 2026 |
| Saudi Arabia | Broadly stable | ~66% below U.S. output | Traditional swing producer role diluted |
| Russia | Broadly stable | ~70% below U.S. output | Output constrained by external factors |
| ExxonMobil (Permian) | Record quarterly output | >1.8M boepd (single basin) | Q2 2026 record production |
The current price environment gives these production numbers real weight. Brent front-month futures settled at $101.21 on 9 September 2026, with spot prices easing to around $96.14 by 30 September 2026.
Brent above $100 since 3 September 2026 Reuters reported that physical dated Brent had held above the $100 mark since 3 September 2026, driven by Middle East supply losses and falling global inventories. The EIA responded by raising its price forecasts for both 2026 and 2027.
What this means in practical terms is direct. When you fill up at a gas station in 2026, a substantial share of what you pay now flows back into the U.S. economy rather than to Riyadh or Moscow. That is a fundamentally different economic circuit than the one that existed in 2008, and it is the foundation for everything that follows.
When big ASX news breaks, our subscribers know first
Why the old playbook on oil price shocks no longer applies
If the production picture has flipped, the economic transmission mechanism has flipped with it. Understanding how oil prices now move through the U.S. economy makes the reversal feel less like a paradox and more like arithmetic.
Transmission simply describes how a change in one variable, in this case the oil price, works its way into the wider economy: household budgets, corporate costs, employment, and investment returns. In the 1970s that chain ran almost entirely in one negative direction. Today it splits.
Four mechanisms now channel elevated prices into domestic benefit rather than pure drag:
- From net importer to leading producer: Higher prices once meant income leaving the country. Now a large share accrues domestically, and income gains in Texas, New Mexico, North Dakota, and the Gulf Coast offset part of the consumer drag.
- Lower energy intensity of GDP: Research by economist James Hamilton and others documents that U.S. output is far less energy-intensive than in the 1970s, so a given price rise delivers a smaller shock to costs and spending.
- Domestic recycling of energy returns: U.S. producers are widely held in pension funds, mutual funds, and retirement accounts, so higher prices feed dividends, buybacks, and capital spending back into American financial wealth.
- Improved policy credibility: Better-anchored inflation expectations reduce the risk that a price spike triggers the wage-price spirals that defined the 1970s.
The 1973-79 shocks hit an economy that was a heavy net importer with high energy intensity, so price spikes translated almost directly into stagflation and recession. The current economy absorbs the same price move as a mix of consumer headwinds and producer windfalls.
The producer windfall is not abstract. ExxonMobil generated $17.2 billion in free cash flow and $23.6 billion in operating cash flow in Q2 2026. EOG Resources posted $2.8 billion in free cash flow on revenue of $8.62 billion, up 57% year over year.
EOG revenue up 57% year over year EOG Resources reported Q2 2026 revenue of $8.62 billion, a 57% increase on the prior-year quarter. That is income that, under the old regime, would have accrued largely to foreign producers.
What those cash flow figures tell you is that money which previously left the country now funds dividends, buybacks, and capital spending that cycle back through U.S. pension funds, retirement accounts, and state budgets. An energy earnings surge in 2026 is a different economic signal than the same surge in 2006.
Regional evidence reinforces the point. Dallas Fed research shows that in the shale era, higher oil prices tend to correlate with stronger employment, income growth, and tax revenues in producing states like Texas and North Dakota, even as national headline inflation rises.
Dallas Fed research on oil prices and the U.S. economy documents how the shale era fundamentally altered the transmission channel, finding that the GDP energy intensity decline since the 1970s means a given price rise now delivers a materially smaller shock to household and corporate costs than historical models predict.
The petrodollar geography shift
Under the old regime, high prices sent enormous surpluses to OPEC producers, who recycled that capital into global financial markets and U.S. Treasuries. The dollars left, then returned as foreign-owned claims on American assets.
The geography has changed. A substantial portion of incremental oil revenue now circulates inside the U.S. financial system through energy equity returns, pension fund holdings, and the state fiscal revenues that fund schools and infrastructure in Texas and North Dakota. The recycling happens at home.
Where the structural thesis gets complicated
The aggregate improvement is real, but it is not the whole story, and treating it as one would be a mistake. Economists and central bank researchers at the Federal Reserve, IMF, World Bank, and Brookings Institution broadly agree that sensitivity has changed while stressing that material qualifications remain.
Five complications deserve genuine caution:
- Distributional effects: Fuel and utility bills consume a larger share of income for lower-income households, so higher prices act as a regressive tax even as wealthier households and institutions capture energy-sector returns.
- Regional disparity: Producing states benefit, but energy-intensive manufacturing regions in the Midwest and Northeast face higher input and logistics costs without offsetting upstream gains.
- Inflation and monetary policy: Sustained high prices push headline inflation up and may force tighter monetary policy that slows the broader economy, complicating the net-benefit calculation.
- Cyclical downside: An economy more tied to production is more exposed when prices fall. Shale’s responsiveness means capital spending and employment can swing sharply in both directions.
- Energy transition risk: Treating high prices as structurally positive may slow the transition and raise stranded-asset risk over a longer horizon, a concern climate policy analysts and long-term investors both flag.
Dallas Fed and broader Federal Reserve regional research consistently shows this producing-versus-non-producing divergence, and the distributional critiques from the IMF, World Bank, and Brookings point in the same direction: the national average conceals real localised pain.
Refinery capacity constraints running at 96.8% utilisation, with crack spreads at four to five times their historical norm, illustrate precisely the kind of distributional and regional price pressure the structural thesis does not neutralise: the consumer bears the downstream cost even when the upstream producer captures the windfall.
What this means for your positioning is specific. The structural thesis is a useful lens for constructing sector exposure, but it does not mean the whole economy benefits equally, and it does not license ignoring the downside scenarios embedded in a price-sensitive production base. The same mechanism that turns rising prices into a tailwind turns falling prices into a headwind.
Selective stock exposure versus broad energy ETFs: how to apply the thesis
If you accept the structural case, the next question is practical: how do you express it? Not all energy exposure is equivalent. Companies with low breakeven costs, disciplined capital allocation, and top-tier acreage are structurally better positioned than the blended average inside a cap-weighted ETF.
The numbers make the case for selectivity concrete.
| Criteria | Selective single stocks | Broad energy ETF | Trade-off |
|---|---|---|---|
| Risk profile | Higher concentration risk | Diversified across the sector | Company shocks hit single names hardest |
| Upside capture | Full exposure to top performers | Diluted by weaker holdings | Selectivity captures structural winners |
| Expertise required | High: ongoing operational analysis | Low: passive holding | Time and skill versus convenience |
| Best suited for | Investors with sector expertise | Investors without deep sector knowledge | Match vehicle to your capacity |
When evaluating individual energy names, five criteria separate quality from the pack:
- Breakeven cost relative to the current oil price, which determines how much of a price rise flows to the bottom line.
- Free cash flow yield, the cash generated after capital spending as a share of market value.
- Capital-return framework, meaning the discipline and consistency of variable dividends and buybacks.
- Acreage quality, since top-tier basins like the Permian generate outsized returns at elevated prices.
- Governance transparency, including conservative leverage and clear disclosure of regulatory and transition risks.
What quality looks like in practice
EOG Resources offers a live illustration. Q2 2026 total production rose 24% year over year to 1.41 million boepd, with crude and condensate up 9% and NGLs up 34%. Net income doubled to $2.72 billion from $1.35 billion a year earlier.
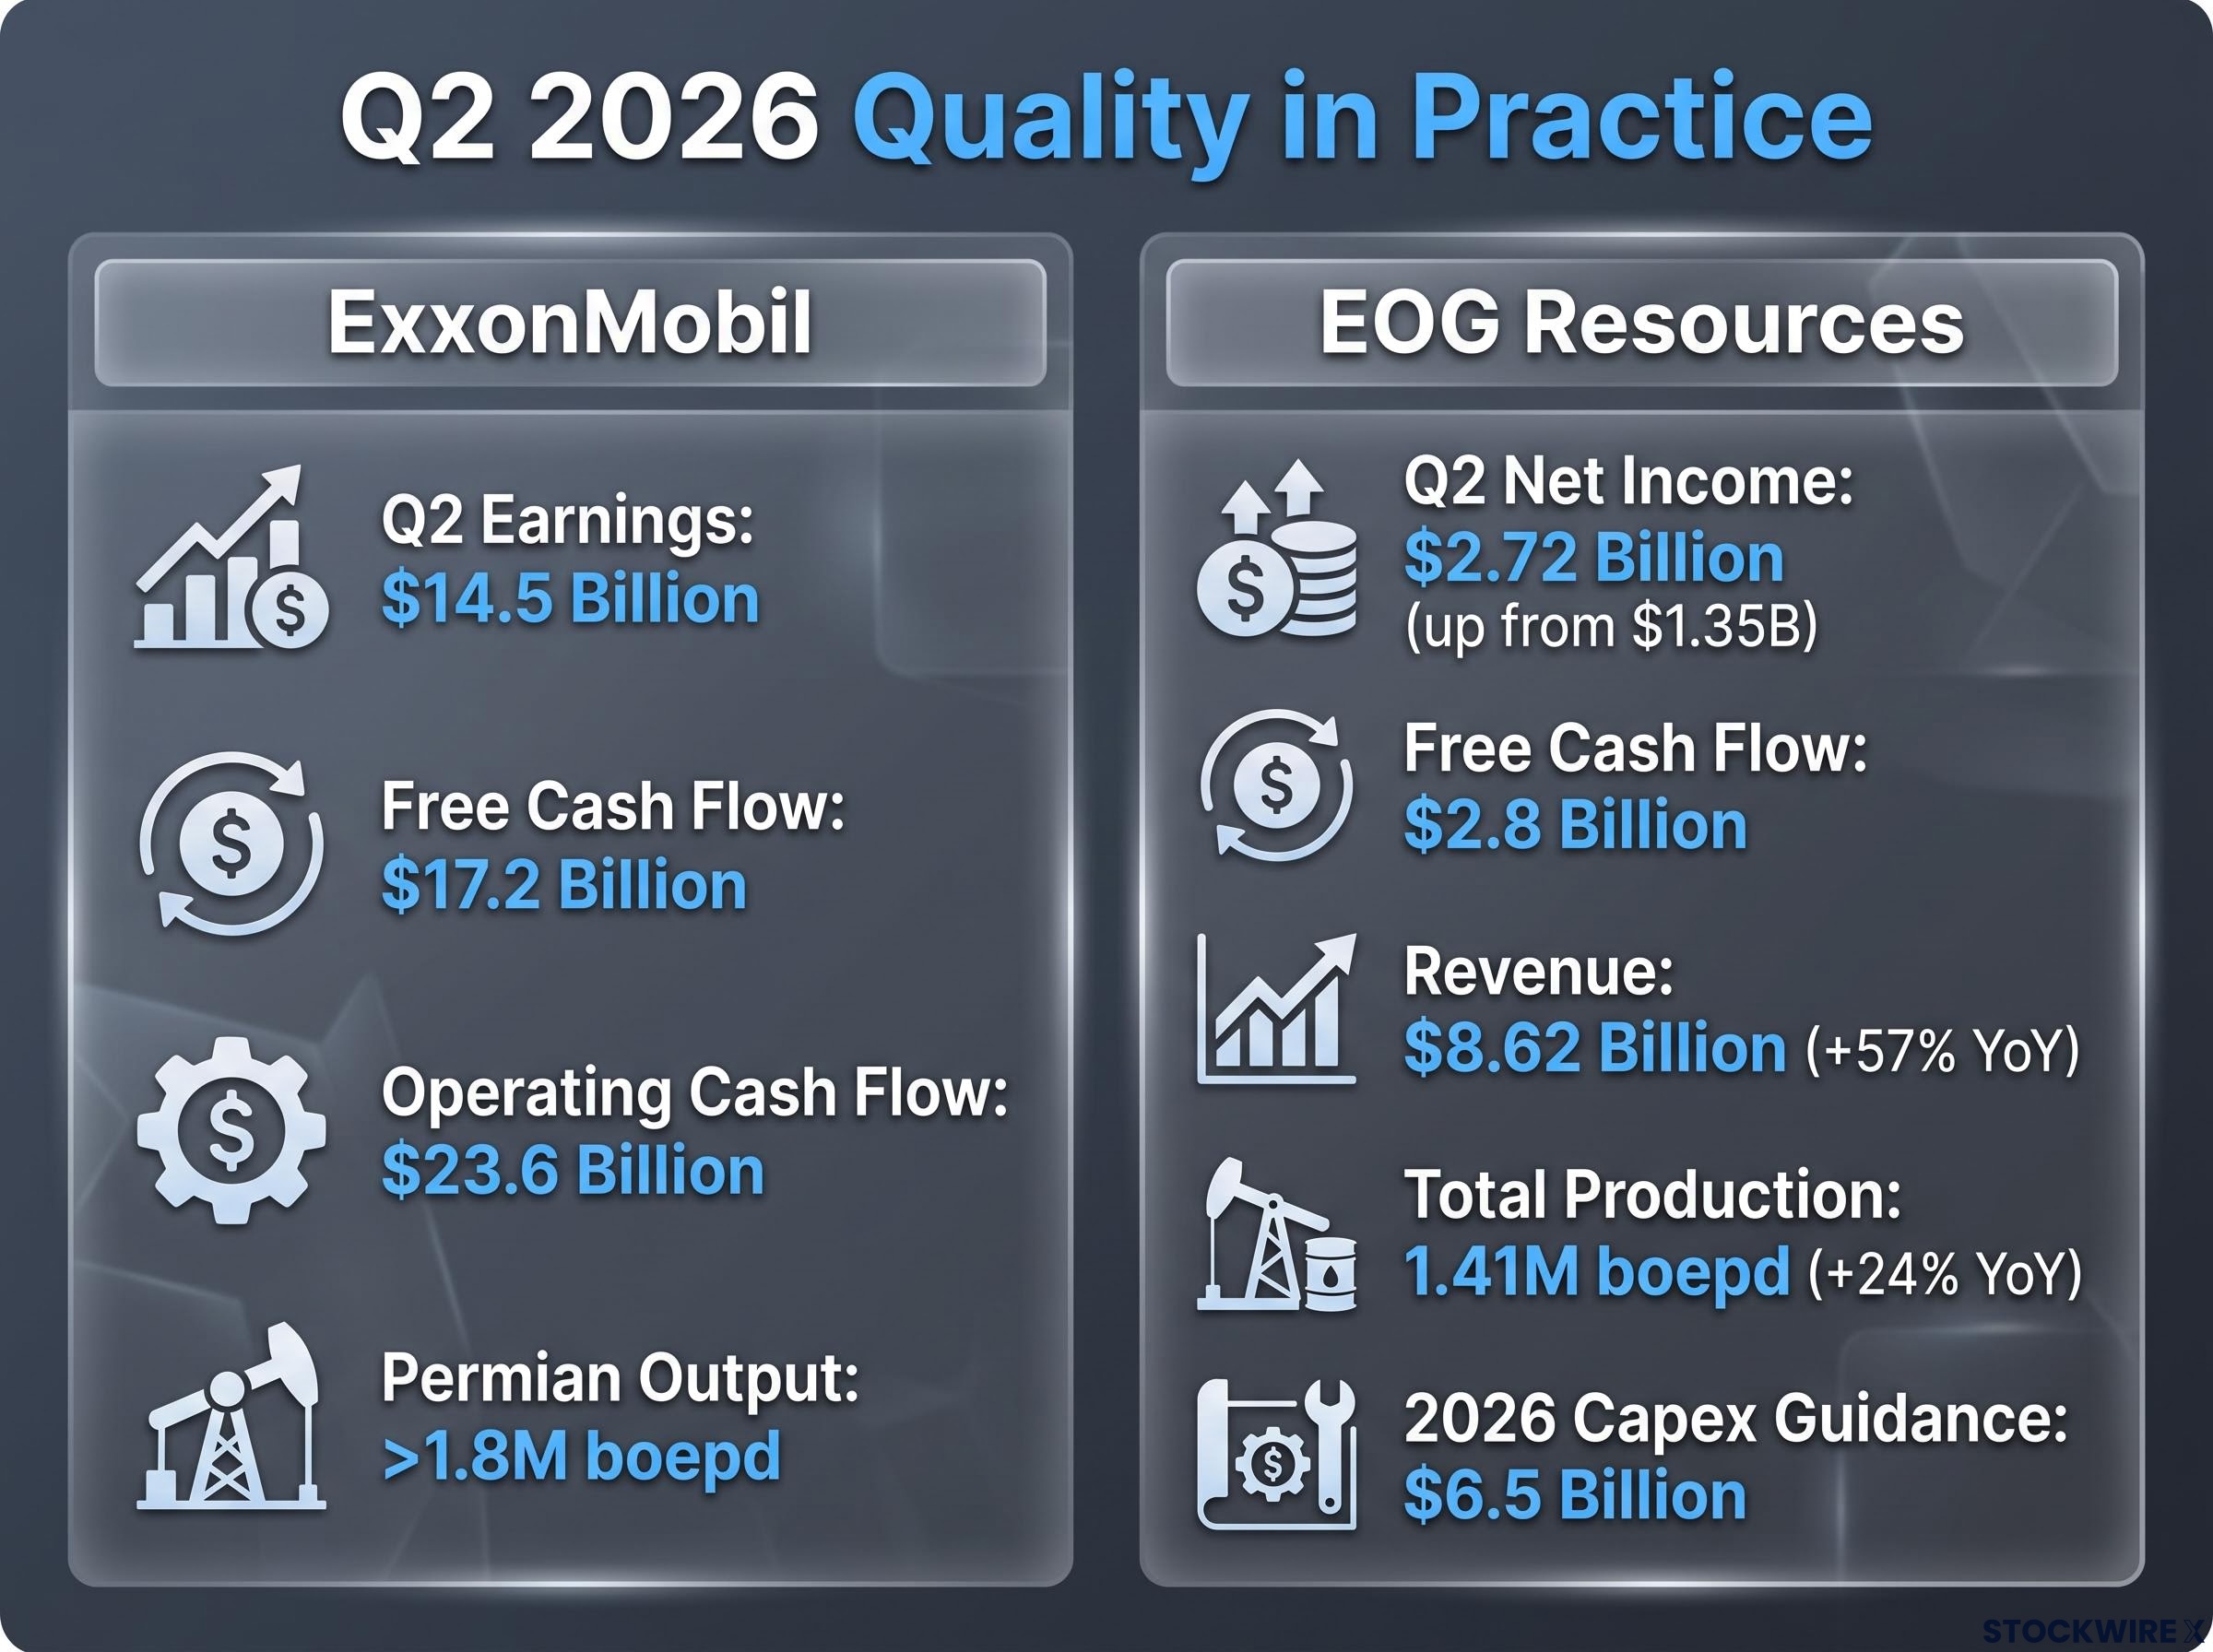
Discipline shows in the capital plan: full-year 2026 capex guidance of $6.5 billion alongside $2.8 billion of free cash flow in a single quarter. ExxonMobil tells a similar story, with $14.5 billion in Q2 earnings, $17.2 billion in free cash flow, and record Permian output above 1.8 million boepd.
The honest case for ETFs
Single-stock exposure carries concentration risk that a broad ETF eliminates. One accident, lawsuit, or governance failure can gut a single position while barely moving a diversified fund.
For investors who lack the time to monitor operational performance and balance sheet quality company by company, a diversified energy ETF remains a valid way to capture the structural thesis at the sector level. As sell-side research from firms including Goldman Sachs and Morgan Stanley has framed since the post-2020 recovery, the choice is not about right versus wrong but about matching the vehicle to your expertise.
The NBER research underpinning the case for energy stocks as an inflation hedge finds a 4.0 percent increase in energy sector returns associated with an energy inflation shock, giving empirical grounding to what the free cash flow figures from ExxonMobil and EOG confirm in practice.
The gap between EOG’s doubling net income and Exxon’s record Permian output on one side, and a generic ETF’s blended performance on the other, is the measurable argument for selectivity. The thesis is not expressed equally across every energy business.
What the structural shift means for investors watching the next price move
The through-line across all of this is straightforward. Production has tripled since 2008, the transmission mechanism now channels income home rather than abroad, the benefits are real but unevenly distributed, and quality within the sector is measurably different from the average.
That leaves a monitoring framework rather than a static call. Four variables will either reinforce or undermine the thesis from here:
Monitoring the four variables flagged above requires a practical read of EIA data and price charts on a weekly basis, because the surprise between analyst forecasts and reported figures moves markets more than headline inventory numbers alone.
- Global demand trajectory: A demand slump would expose the cyclical downside embedded in a price-sensitive production base.
- U.S. production cost trends: Rising breakevens would erode the domestic windfall that underpins the whole case.
- Monetary policy response: Aggressive tightening against sustained inflation could offset regional income gains with broader economic drag.
- Energy transition policy: Acceleration would raise stranded-asset risk and reframe the long-horizon picture.
EIA raises 2026-2027 forecasts The EIA lifted its oil price forecasts for both 2026 and 2027, the institutional signal that this tighter environment is expected to persist rather than reverse quickly.
That upward revision matters for decisions made in late 2026, not just short-term trades. With Brent holding above $100 since early September and Trading Economics projecting roughly $123 per barrel over 12 months (an unverified estimate best treated as directional sentiment rather than a precise target), the price environment underpinning the thesis looks set to endure long enough to matter for portfolio construction.
This article is for informational purposes only and should not be considered financial advice. Investors should conduct their own research and consult with financial professionals before making investment decisions.
Past performance does not guarantee future results. Financial projections are subject to market conditions and various risk factors, and forward-looking statements are speculative and subject to change based on market developments.