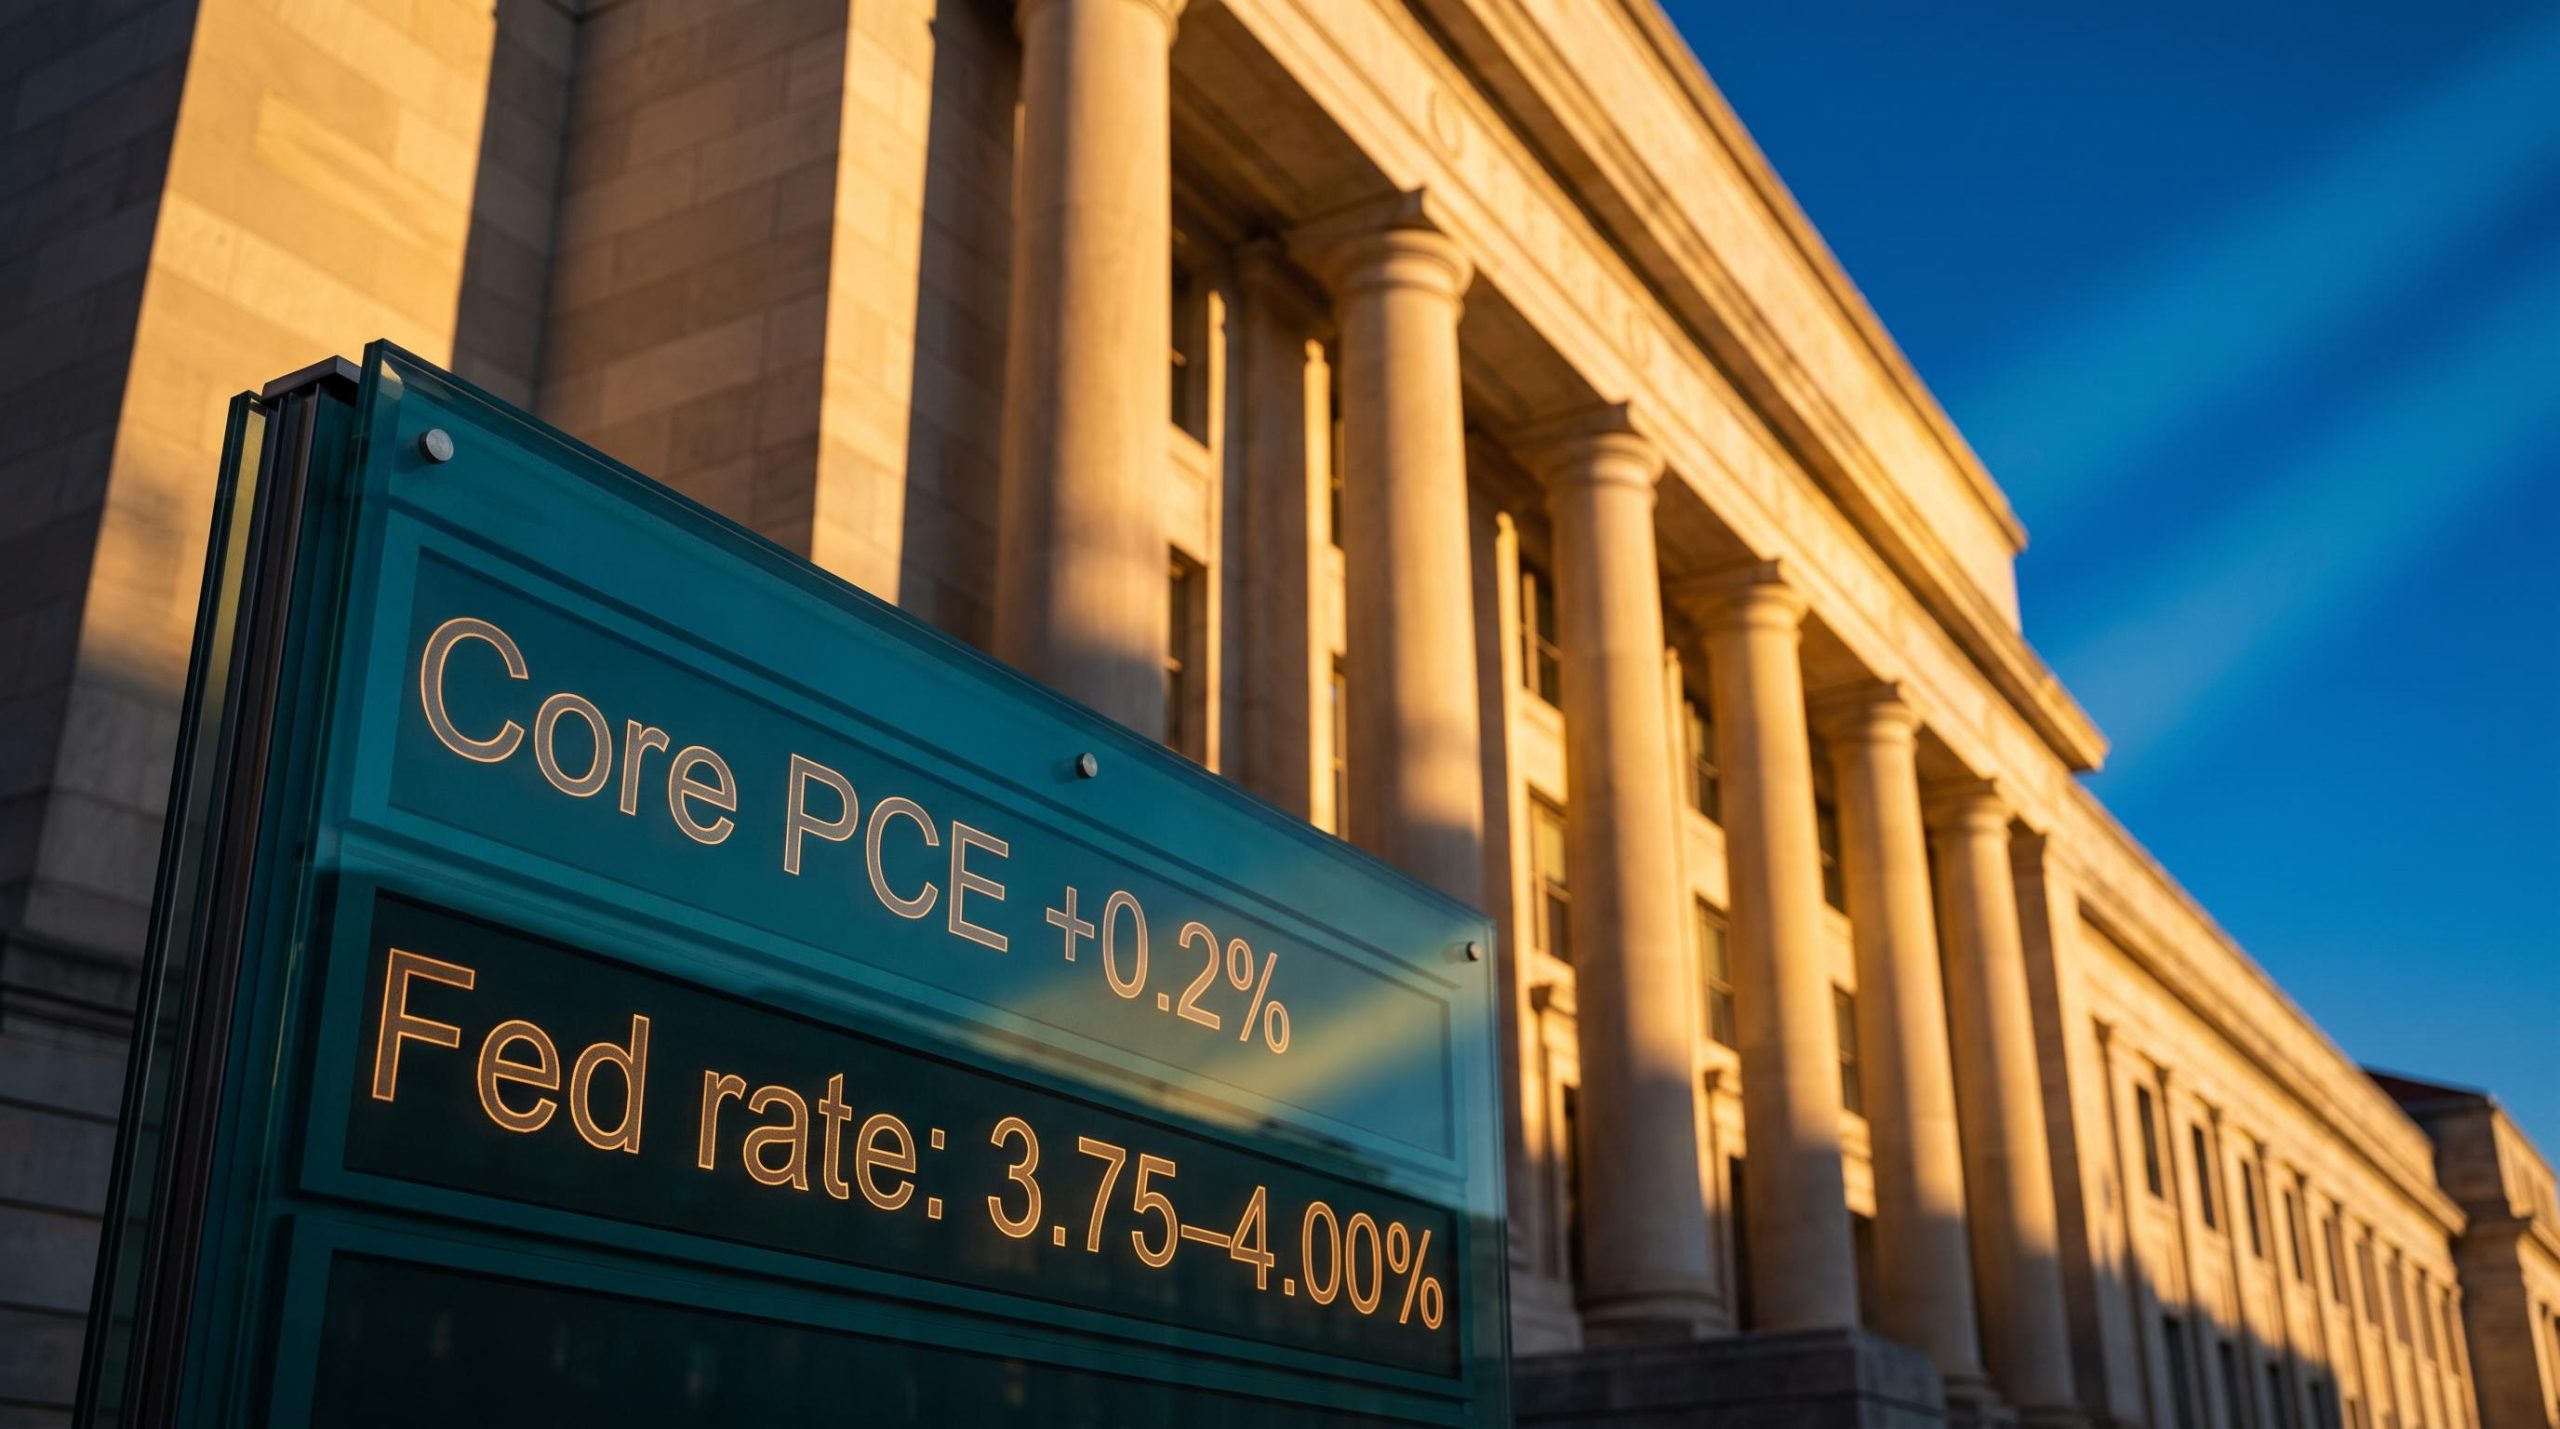
The Bureau of Economic Analysis released its August 2026 personal consumption expenditures (PCE) inflation data on 30 September, and for the first time in a persistently hot year, core prices came in cooler than the market expected.
Core PCE, the Federal Reserve’s preferred gauge of underlying inflation, rose just +0.2% on the month against a forecast of +0.3%. On an annual basis the reading eased to roughly 3.0%, down from July’s 3.3%.
The timing sharpens the story. The release lands just two weeks after the Federal Open Market Committee raised rates to 3.75-4.00% on 16 September and revised its inflation projections higher, meaning the Fed’s most recent decision was made without this softer number in hand.
That is why markets are now recalibrating. Here is what the August PCE inflation data actually tells you about where prices stand, how the Fed is likely to read it, and what it means for interest rates and asset prices in the months ahead. The short version: real progress, but nothing that shifts the trajectory yet.
August core inflation cooled, but the numbers still tell a complicated story
Start with the cleanest signal in the release. Core PCE rose +0.2% month-over-month in August, below the +0.3% economists had penned in. On a twelve-month basis the original BEA reading came in at approximately 3.0%, easing from July’s 3.3% annual rate.
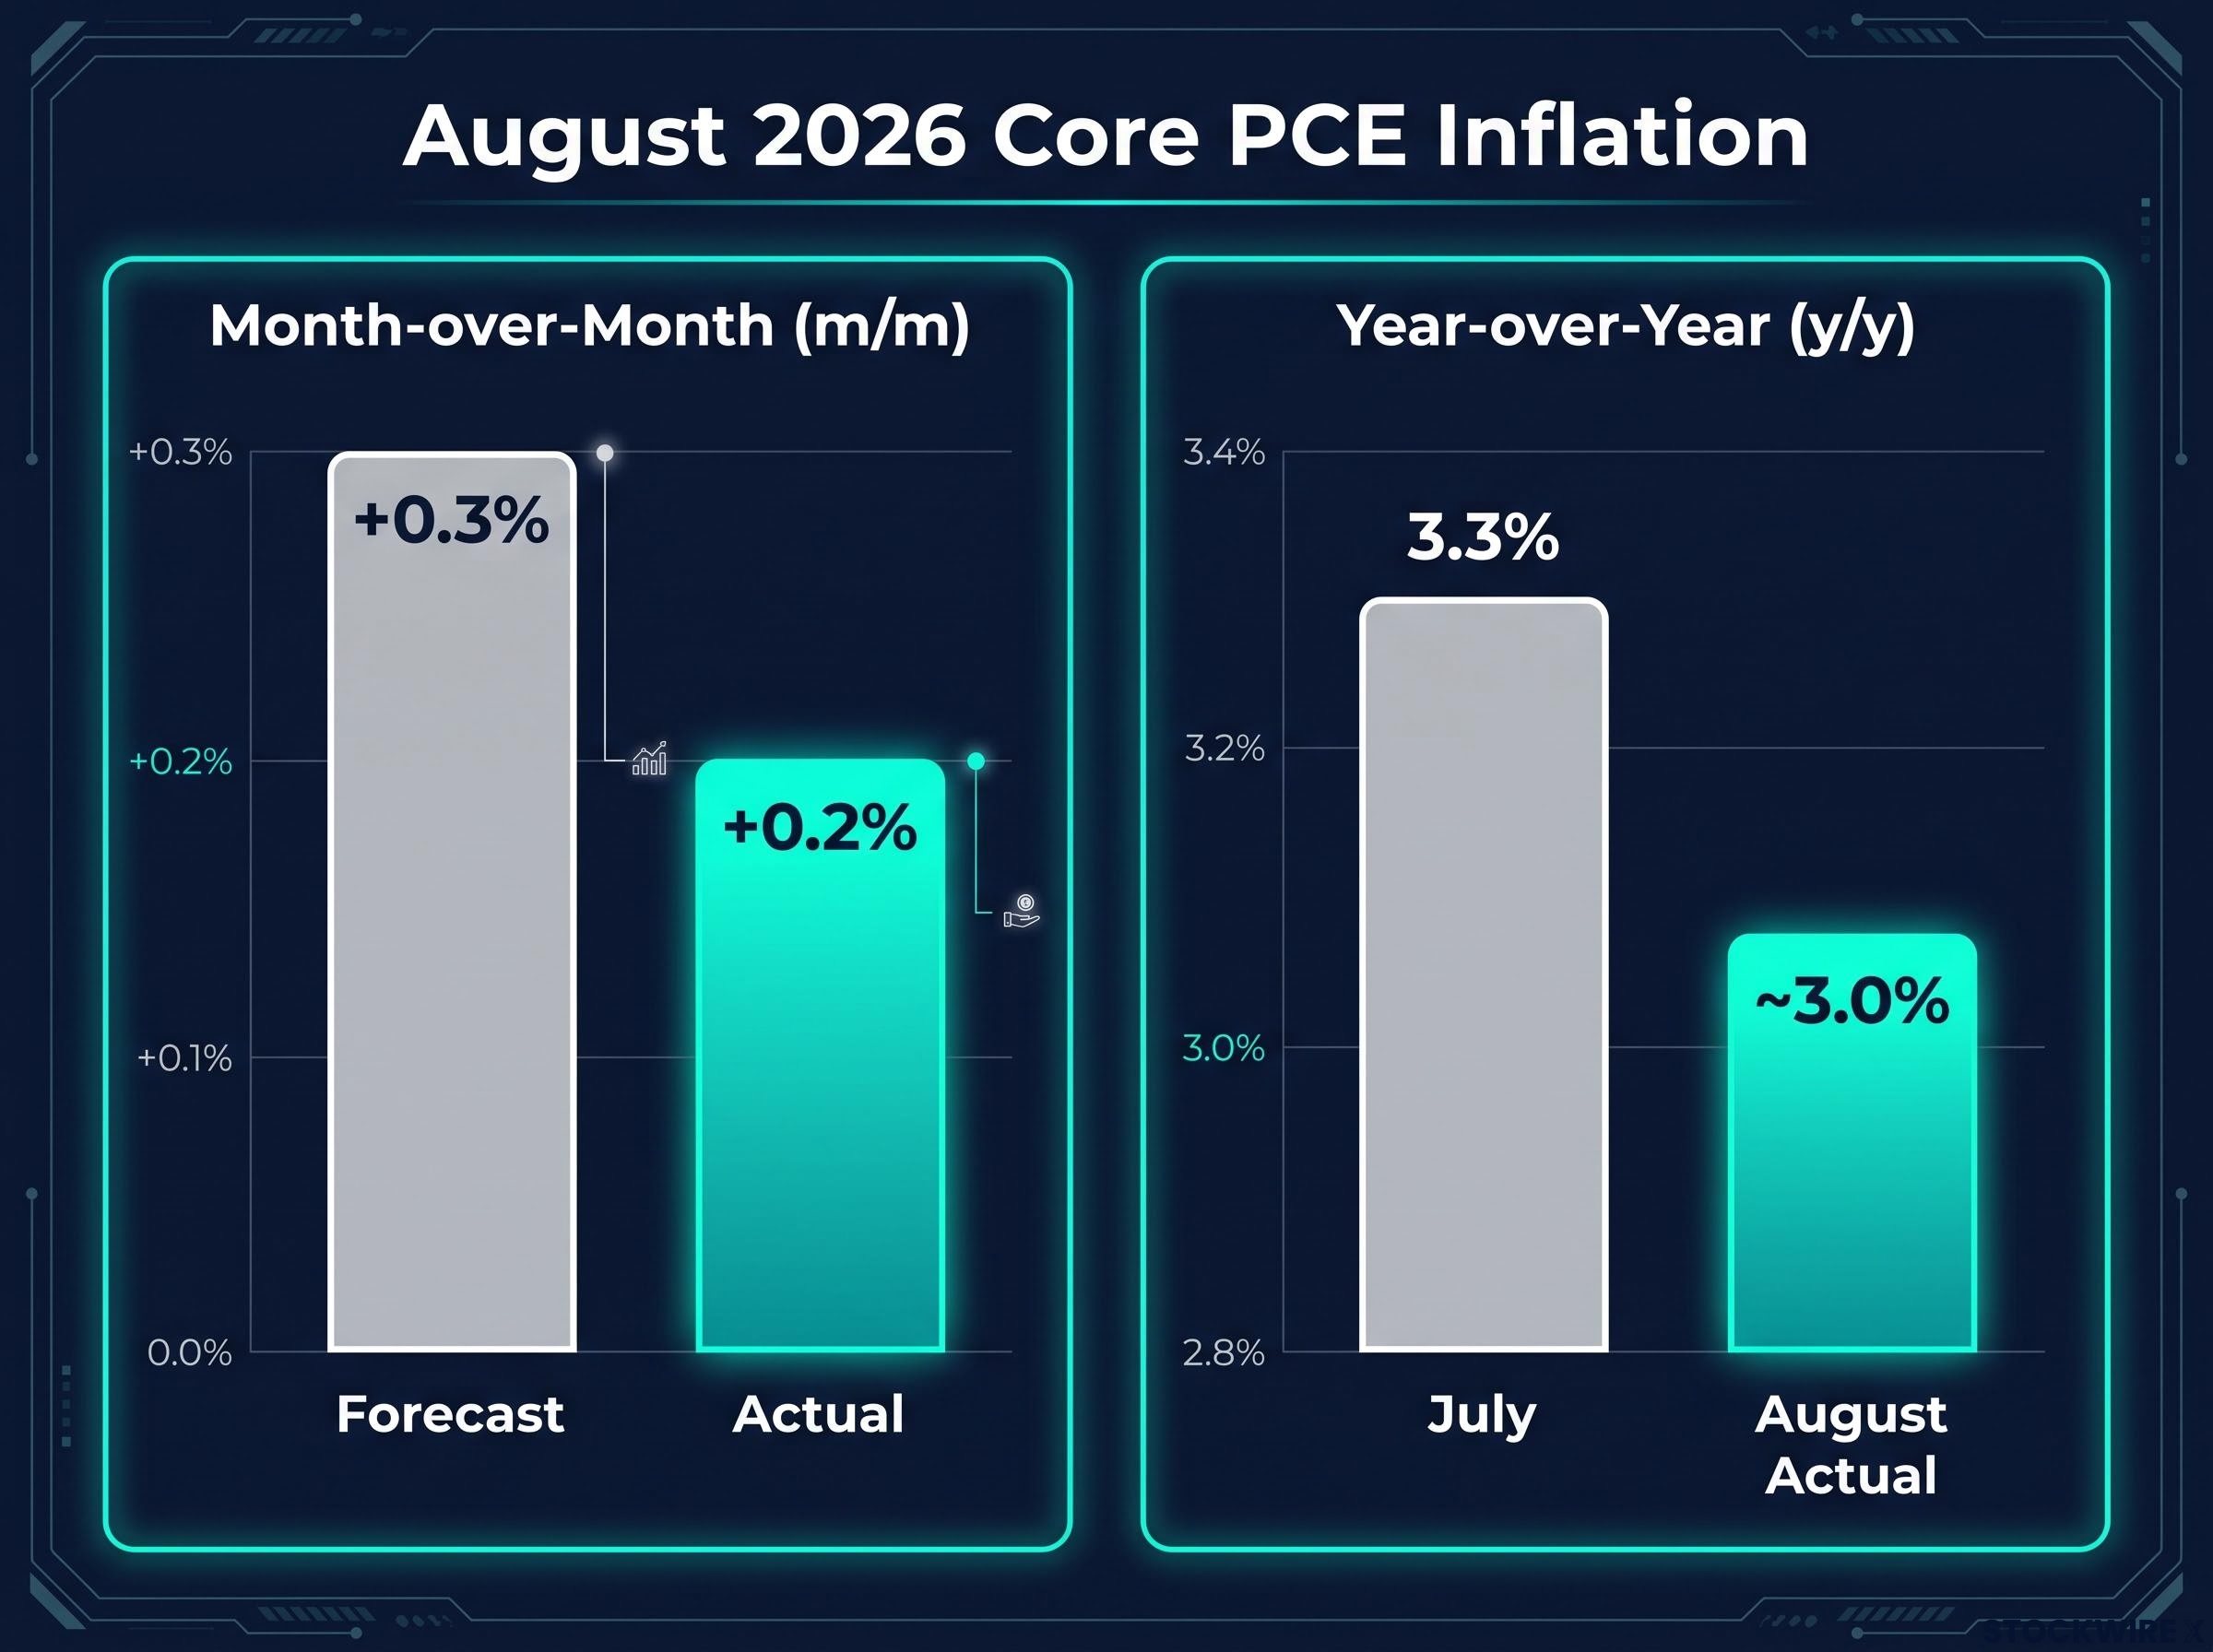
That monthly figure is the one to trust most. It is undisputed across the data, and it is the number that captures the freshest movement in prices rather than a rolling twelve-month average that drags older data along with it.
The annual figure needs a caveat. The 3.0% headline annual rate comes from the original BEA release, but a secondary summary of the same “Personal Income and Outlays” report cited a slightly lower 2.9% core reading. The gap is small, and both point in the same direction, so treat the annual number as a strong indicator rather than a settled final figure.
On the headline measure, which includes food and energy, prices rose +0.3% on the month and roughly 3.4% over the year.
Here is the tension you should sit with. A single below-forecast print is welcome, but core PCE has run above 3% every month of 2026, according to J.P. Morgan Global Research. One softer number is a data point, not a trend reversal.
The July PCE release established the direct baseline for August’s reading, with core PCE holding at 3.3% year-over-year for a second consecutive month and real personal spending collapsing to effectively zero, confirming that the August softening follows a period of entrenched stickiness rather than a clean disinflation trend.
The persistence problem J.P. Morgan Global Research notes that core PCE has remained above 3% in every month of 2026, framing that persistence as the structural backdrop that justified the Fed’s September hike and its signal of at least one more.
The distance still to travel is the real story. The Fed’s own September projection puts full-year 2026 core PCE at 3.4%. Set that against a single 3.0% monthly annual reading and you can see how far actual disinflation must go before it changes the Committee’s posture.
| Measure | August 2026 actual | Forecast / July 2026 | Fed 2026 projection |
|---|---|---|---|
| Core PCE (m/m) | +0.2% | +0.3% forecast | – |
| Core PCE (y/y) | ~3.0% | 3.3% (July) | 3.4% |
| Headline PCE (m/m) | +0.3% | – | – |
| Headline PCE (y/y) | ~3.4% | – | 3.7% |
Why the Fed is unlikely to treat one soft print as a reason to change course
The Fed was not flying blind when it hiked. At the 16 September press conference, Chair Warsh estimated August total PCE was already running at approximately 3.6% year-over-year, drawn from the CPI and PPI data available at the time. The Committee raised rates to 3.75-4.00% with a real-time inflation signal already in view.
The September FOMC statement documents the Committee’s decision to raise rates to 3.75-4.00% and the accompanying rationale, establishing the policy baseline against which the softer August PCE print must now be assessed.
That matters for how you read the new data. The Fed was working with a rough picture of August inflation before it acted, so a formal print that lands modestly below forecast confirms rather than surprises.
It helps to understand why the Fed watches PCE at all, rather than the CPI figure that dominates headlines. Three structural reasons drive the preference:
- Broader coverage: PCE captures spending made on behalf of households, such as employer-provided health insurance and government healthcare payments, not just out-of-pocket costs.
- Chain weighting: PCE regularly updates its spending weights to reflect how consumers substitute toward cheaper goods when prices shift, capturing actual behaviour rather than a fixed basket.
- Formal alignment: The Fed’s 2% target and every official projection are expressed in PCE terms, so it is the measure the Committee is institutionally built around.
The upshot is that PCE is not just another inflation gauge to the Fed. It is the gauge, embedded directly in the projections and the policy framework.
Two ways to read the same number
The dovish case is straightforward. A below-forecast core reading near 3.0% looks like evidence that disinflation is finally taking hold, which strengthens the argument for pausing after September’s hike rather than pressing on.
The hawkish case is just as grounded. A 3.0% core rate still sits a full 100 basis points above the 2% goal and lines up almost exactly with the Fed’s own 3.4% full-year projection. On that view, one softer month changes nothing about a multi-year path.
The debate, in one line, is whether “3-handle” inflation counts as genuine progress or simply less-bad persistence.
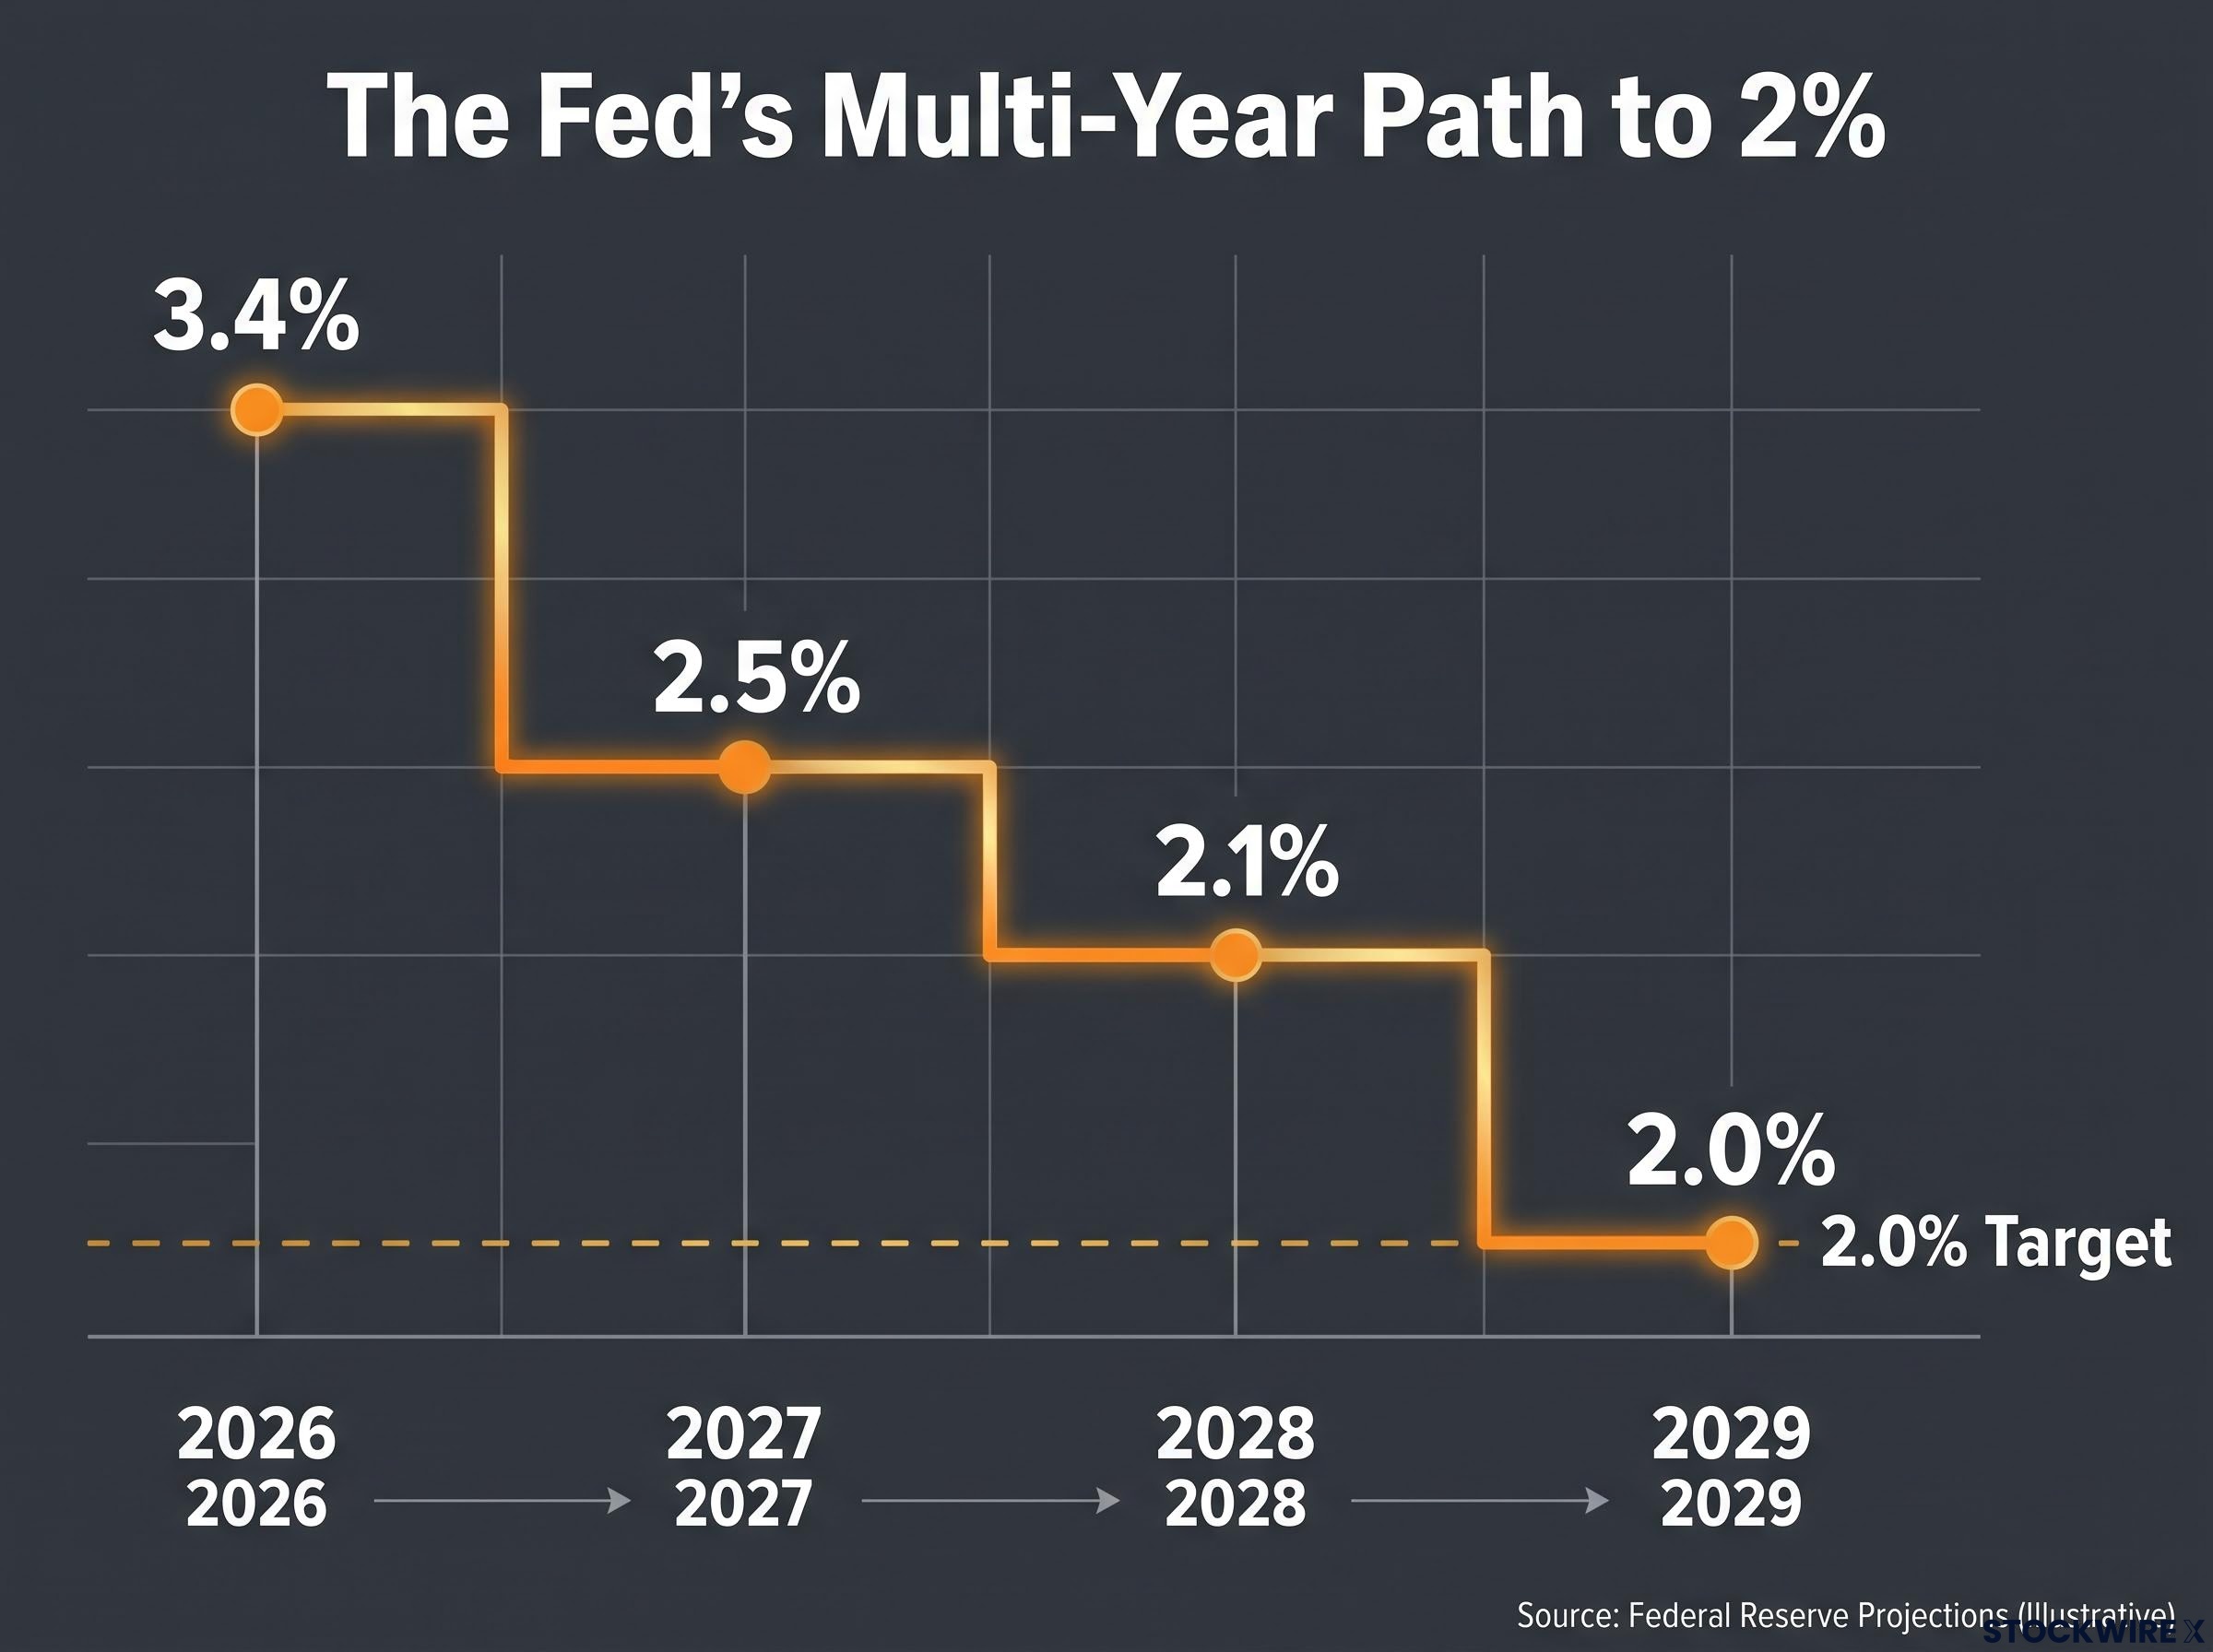
The Fed’s projections tilt that debate. The September Summary of Economic Projections puts median core PCE at 3.4% for 2026, 2.5% in 2027, and 2.1% in 2028, with inflation not returning to 2% until 2029, per Saxo Bank’s reading. Saxo characterised the updated projections as a hawkish message that keeps the door open to further tightening. That 2029 timeline is the anchor: the Fed never assumed fast disinflation, so one soft month does not move its needle the way markets might hope.
What markets are pricing in, and what to watch before the next FOMC meeting
The market backdrop tells you investors are not treating this as resolved. Through late August, the S&P 500 finished the month up +2.63%, according to Madison Partners, while the 10-year Treasury yield sat around 4.7% and the 30-year pushed above 5.3%.
Read those two signals together. Equity resilience and bond market stress are coexisting, not converging, which is the market’s way of saying inflation risk is still live even as corporate earnings hold up.
The 10-year yield near 4.7% after a below-forecast print is the clearest tell. It is the bond market signalling it is not yet convinced the disinflation trend is durable, and it means positioning as though a pivot is imminent carries real duration risk.
Treasury yield dynamics at the long end of the curve reflect forces beyond month-to-month PCE prints, including a CBO-projected FY2026 deficit of $2.1 trillion and retreating foreign central bank demand, which explains why the 10-year held near 4.7% even after a below-forecast inflation release.
Several risks a single soft print does not eliminate:
- Energy pressure: Madison Partners warned that rising oil prices are already adding upward pressure to inflation gauges, which can offset a soft core reading by re-accelerating headline PCE.
- Sticky services: Services inflation and wage-linked components remain the hardest categories to bring down quickly, and they anchor core PCE well above target.
- Fiscal term premium: Treasury yields at multi-year highs reflect concerns about the federal debt burden and medium-term inflation, not just month-to-month data.
The Fed’s own projection reinforces the caution, placing headline PCE at 3.7% for 2026.
So what actually shifts the picture? Watch this sequence before the next FOMC meeting:
- The next PCE print, due in October, and specifically whether the sticky services components soften rather than just the volatile ones.
- Labour market data, to gauge whether demand pressures and wage growth are genuinely easing.
- Fed speaker communications, for any signal on whether September’s hike was the last move or a mid-cycle step.
What markets are waiting for Madison Partners frames the real catalyst as a combination, not a single number: cooler inflation alongside a softening labour market would be read as supportive for both stocks and bonds. One PCE print in isolation is not that catalyst.
Past performance does not guarantee future results. Financial projections are subject to market conditions and various risk factors, and forward-looking statements are speculative and subject to change based on market developments.
What the August print changes, and what it does not
The honest verdict is a dual one. A below-forecast core reading is genuinely informative and marginally lowers the odds of an immediate further hike, but it does nothing to the Fed’s multi-year disinflation baseline or its 2029 return-to-target timeline.
The scenario ahead is asymmetric. If the September PCE print also lands below forecast and services components ease, the case for a pause builds. If energy-driven headline PCE re-accelerates or labour data stays hot, the above-3% core story reasserts itself and bond market pressure deepens.
For your portfolio, the practical read is that this print buys time rather than changes direction. With the funds rate at 3.75-4.00% and the SEP still signalling at least one more hike, per J.P. Morgan, the implication is reduced near-term rate risk, not a green light to add duration on the assumption of a pivot.
Progress is real. But the Fed’s framework, its projections, and the bond market are all saying the same thing: one soft print is welcome and insufficient in equal measure.
For investors wanting to map the September hike’s full impact across their holdings, our full explainer on how rate changes reprice asset classes covers the five transmission channels from the funds rate to equities, bonds, and currency exposure.
This article is for informational purposes only and should not be considered financial advice. Investors should conduct their own research and consult with financial professionals before making investment decisions.