The S&P 500 closed at 5,415 on 2 June 2026, up roughly 10% for the year. The Nasdaq Composite settled near 18,050, carrying a 14% gain over the same period. Those numbers are easy to celebrate. They are harder to explain.
Two competing accounts of this rally are circulating with roughly equal conviction. One, anchored by Yardeni Research’s “Fabulous Earnings Momentum” framework and supported by Goldman Sachs strategists, holds that the advance is built on real earnings growth and an AI-powered productivity cycle that is migrating from Wall Street narratives into measurable economic output. The other, articulated most forcefully by Morgan Stanley’s Mike Wilson and JPMorgan’s Marko Kolanovic, warns that positioning, multiple expansion, and speculative enthusiasm are doing more of the lifting than headline returns suggest. The distinction matters because the two cases imply very different risk profiles for the second half of 2026. This piece works through the actual data behind both arguments, covering Q1 earnings results, April and May demand-side indicators, AI’s measurable footprint in U.S. investment, and the strategist debate itself, so readers can form a reasoned view on whether this rally has structural staying power.
A market up 10% needs a reason to keep climbing
The year-to-date scorecard as of 2 June 2026:
- S&P 500: closed at 5,415, up approximately 10% year-to-date
- Nasdaq Composite: closed near 18,050, up approximately 14% year-to-date
- Leadership: concentrated in megacap technology and AI-linked names
Those gains are not evenly distributed. The megacap technology and AI-exposed cohort has done a disproportionate share of the work, which is precisely why the question of what is driving the rally remains contested. If the advance reflects genuine earnings strength across a broadening set of sectors, investors are looking at a market with room to compound. If it reflects sentiment crowding into a narrow leadership group trading on AI enthusiasm, the same headline return masks a concentration risk that could unwind quickly on a single disappointing earnings cycle.
Both camps claim the data. What follows is the data itself.
When big ASX news breaks, our subscribers know first
What the earnings scorecard actually says
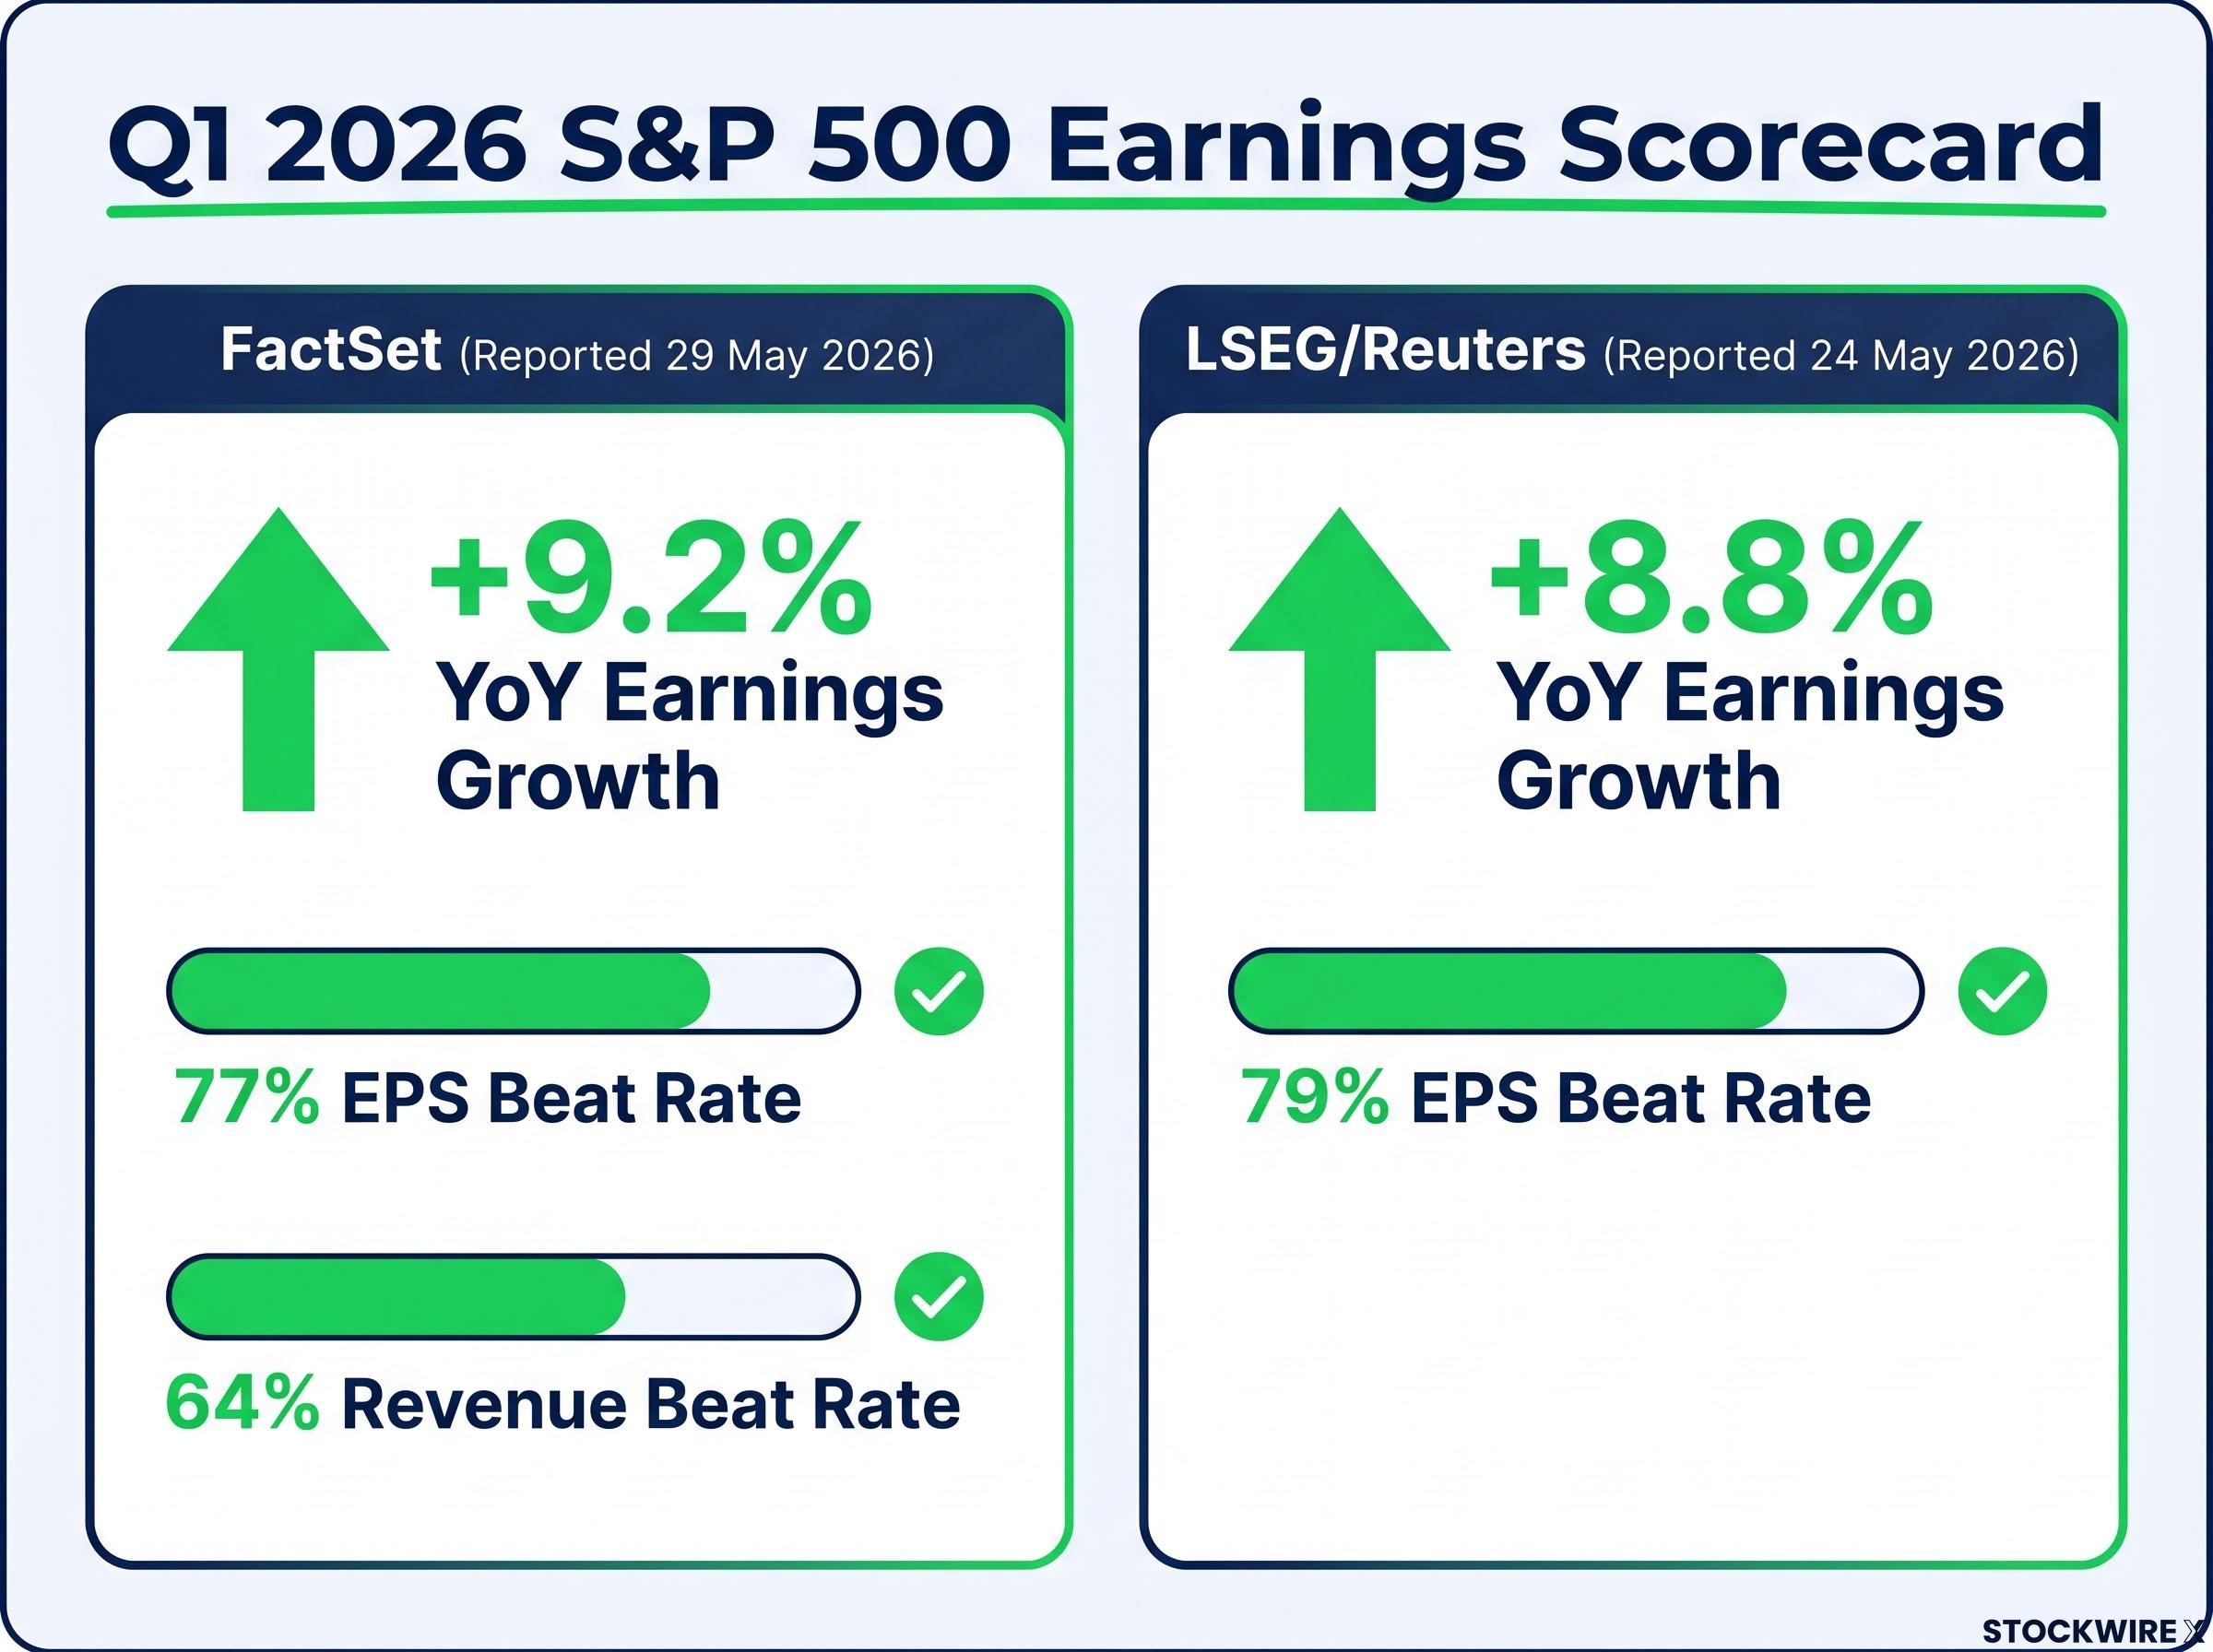
With approximately 98% of S&P 500 companies having reported Q1 2026 results, the picture is detailed enough to adjudicate.
| Data Source | Earnings Growth (YoY) | EPS Beat Rate | Revenue Beat Rate | Report Date |
|---|---|---|---|---|
| FactSet | +9.2% | 77% | 64% | 29 May 2026 |
| LSEG/Reuters | +8.8% | 79% | Not specified | 24 May 2026 |
The two data providers differ modestly because LSEG’s snapshot was compiled earlier, when fewer companies had reported. FactSet’s 29 May vintage, covering nearly the full index, represents the more complete figure. Either way, the range of +8.8% to +9.2% year-over-year earnings growth is comfortably above the long-run average, and a 77% EPS beat rate signals corporate execution that exceeded analyst expectations by a meaningful margin.
Sector composition sharpens the picture. Information technology, communication services, and health care were the largest contributors to Q1 growth, with AI-related demand a visible driver within the technology sector. That concentration gives the earnings bulls their strongest talking point and the bears their primary objection simultaneously.
Ed Yardeni, President of Yardeni Research, described the current advance on 29 April 2026 as an “earnings-driven bull market supported by AI-related productivity gains and solid nominal GDP growth.”
A 77% beat rate and nearly 10% earnings growth represent genuine corporate performance, not manufactured optimism. The question is whether the macro backdrop can sustain it.
The earnings expectations gap is what separates a strong season from a rewarding one for investors: a 77% beat rate signals that companies outperformed consensus estimates by a wide margin, but the market had already begun pricing in above-average results before reporting began, which limits how much incremental upside each individual beat can deliver.
The macro engine underneath the market
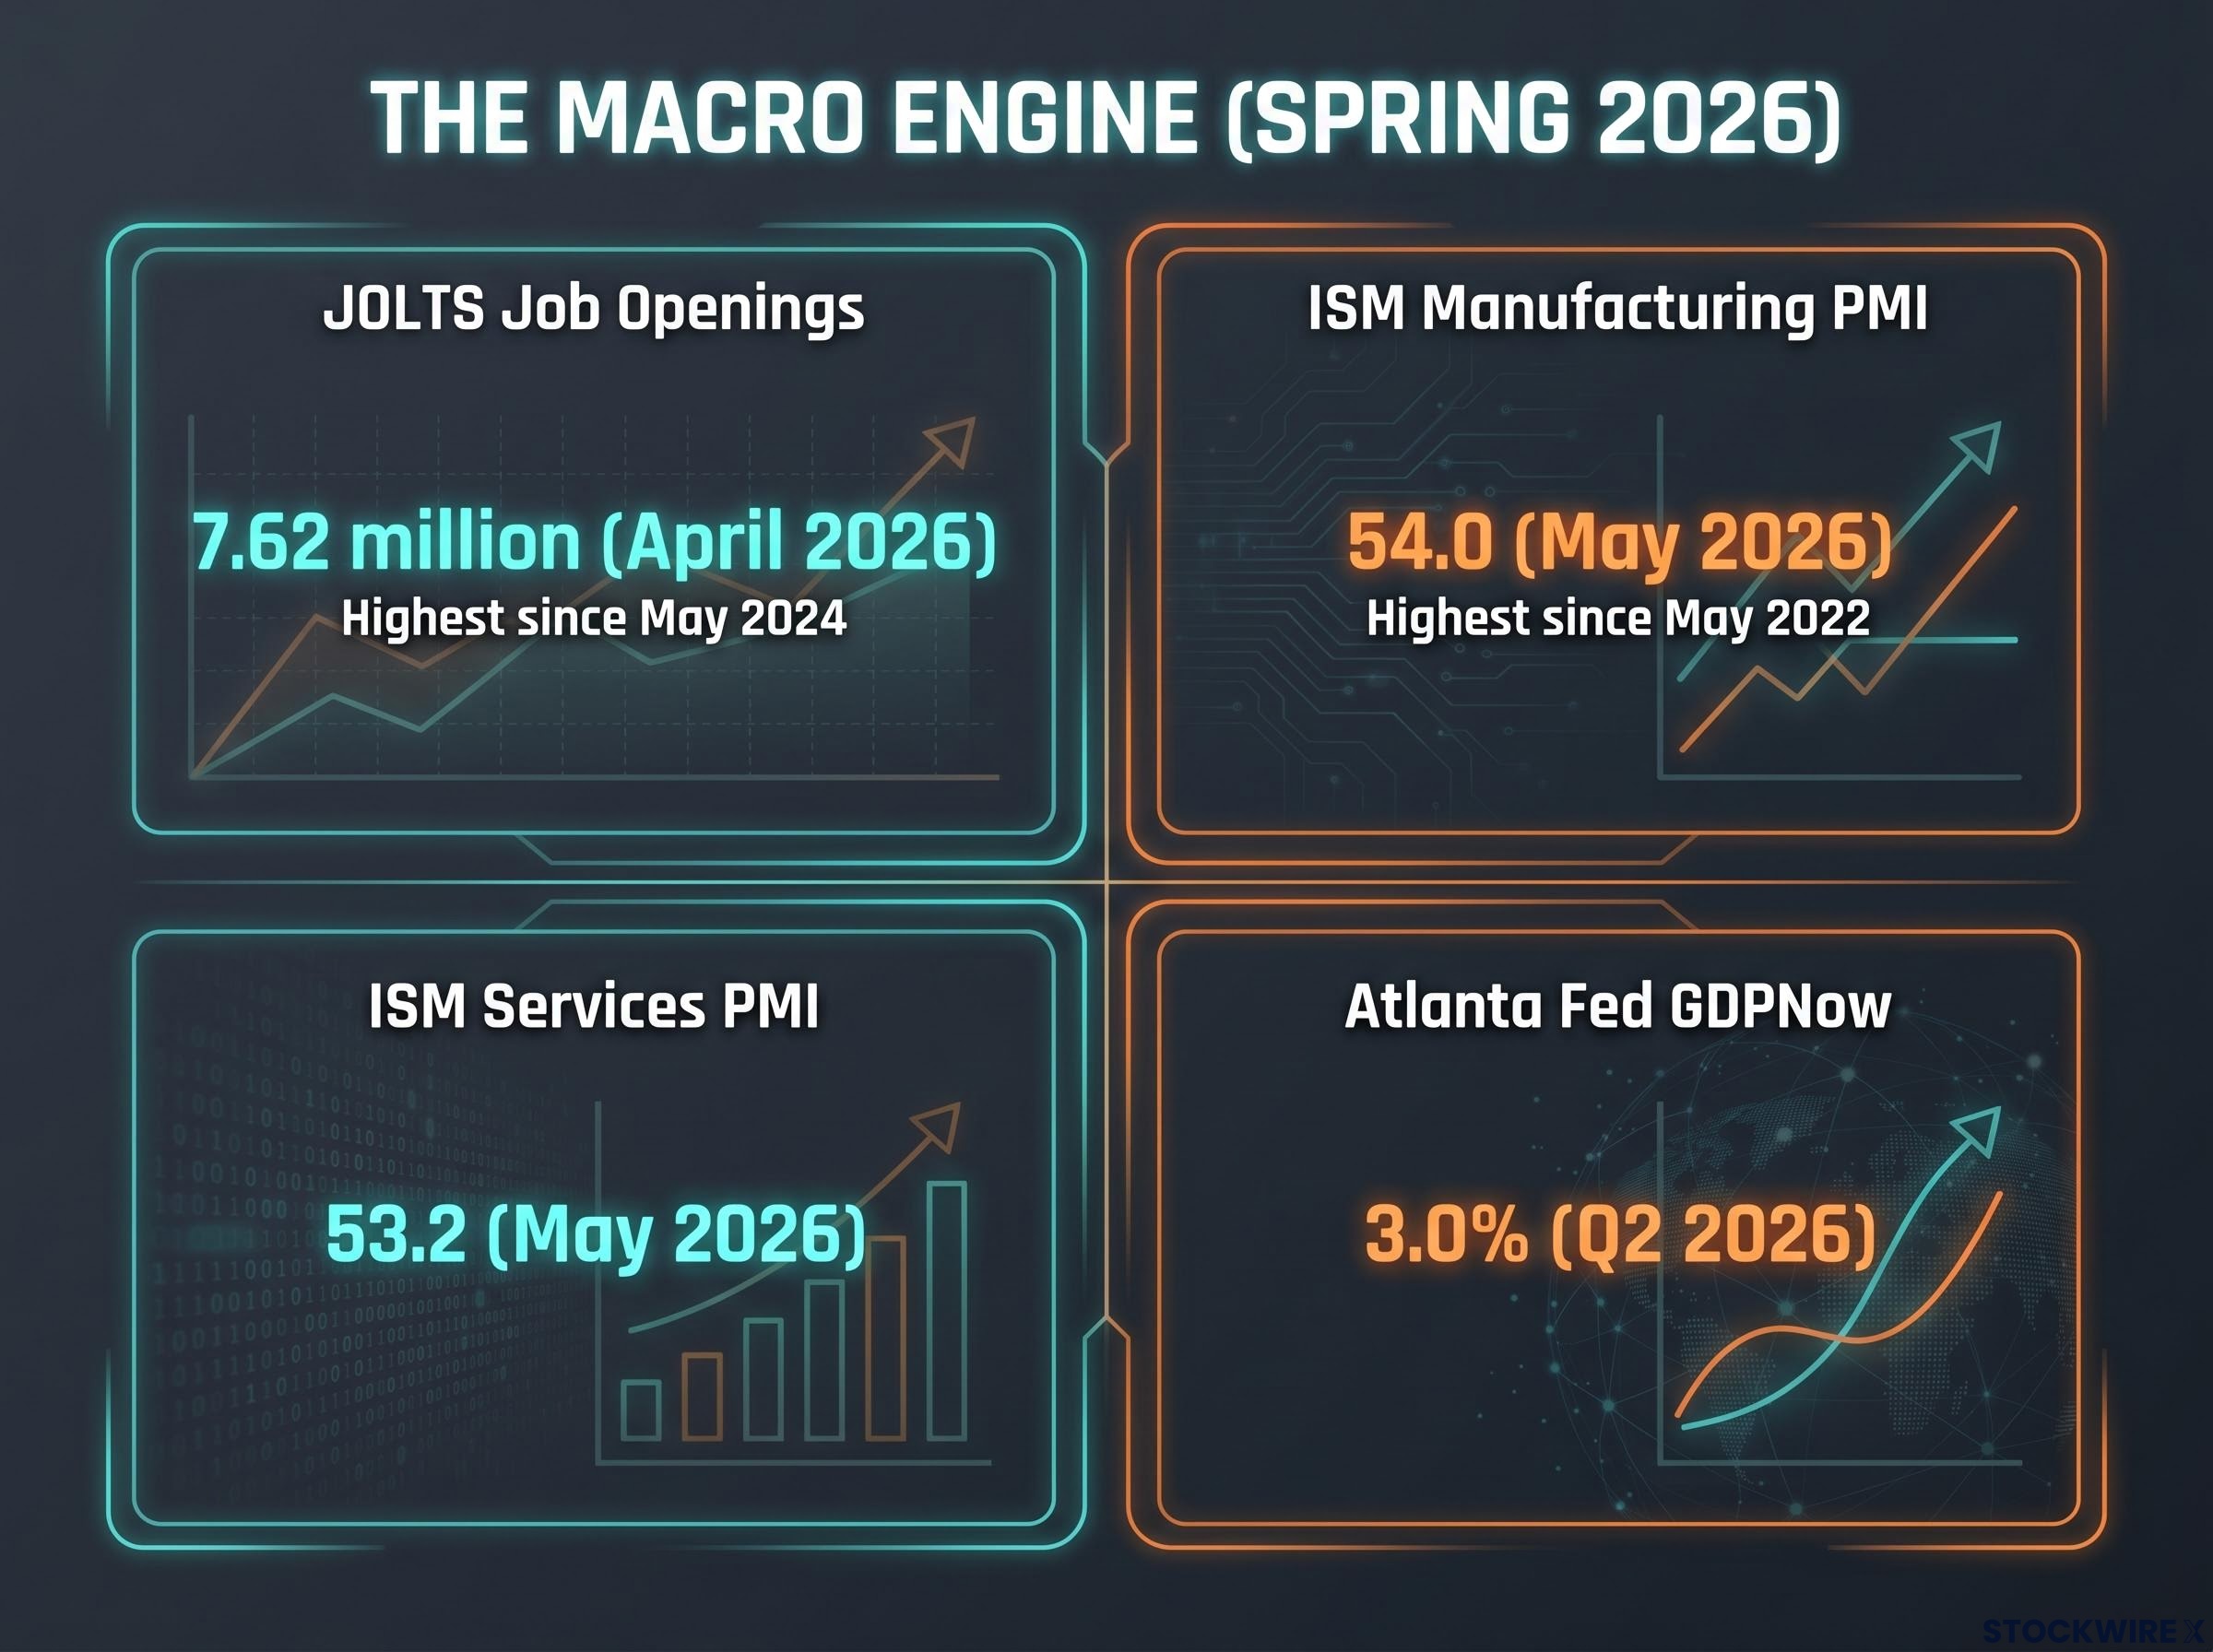
Start with the labour market. U.S. job openings in April 2026 reached 7.62 million, the highest level since May 2024, according to Bureau of Labor Statistics JOLTS data. A labour market that tight does not signal an economy on the verge of contraction; it signals one where employers are still competing for workers, which supports both wage growth and consumer spending capacity.
Move to goods production. The ISM Manufacturing PMI hit 54.0 in May 2026, its strongest reading since May 2022, a four-year high that signals broad-based expansion across the factory sector. The ISM Services PMI for the same month registered 53.2, confirming that both halves of the economy are in expansion territory simultaneously.
The significance of dual-sector expansion becomes clearer against an international baseline: the UK services sector registered 47.9 in the same May 2026 survey window and the Eurozone services PMI came in at 46.4, both in outright contraction, making the U.S. the only major developed economy with both manufacturing and services simultaneously above 50.
The ISM Manufacturing PMI report for May 2026 confirmed the headline reading of 54.0, with new orders and production sub-indices both in expansion territory, lending weight to the argument that goods-sector momentum is broad-based rather than concentrated in a single category.
| Indicator | Value | Period | What It Signals |
|---|---|---|---|
| Job openings (JOLTS) | 7.62 million | April 2026 | Labour market tightness, highest since May 2024 |
| ISM Manufacturing PMI | 54.0 | May 2026 | Goods-sector expansion at four-year high |
| ISM Services PMI | 53.2 | May 2026 | Continued services-sector expansion |
| Real PCE (monthly change) | +0.3% | April 2026 | Steady consumer spending growth |
| Atlanta Fed GDPNow (Q2) | 3.0% | Q2 2026 | Above-trend GDP trajectory |
Consumer spending reinforces the story. Real personal consumption expenditures rose 0.3% in April 2026 according to Bureau of Economic Analysis data, while advance retail sales hit $709.4 billion, up 0.4% month-over-month and 3.2% year-over-year. None of these readings suggest an economy overheating, but taken together they build to the Atlanta Fed’s GDPNow Q2 projection of 3.0% real GDP growth, a figure that feels earned rather than asserted once the individual inputs are laid out.
Goldman Sachs Chief Economist Jan Hatzius stated in March 2026 that the U.S. economy was on a “soft-landing path” with above-trend growth and falling inflation, providing “a solid macro backdrop for risk assets.”
For investors debating whether equities are priced for a growth outcome that has not materialised, the data suggests it largely has.
AI is no longer just a stock market story
Sentiment cycles fade. Investment cycles compound. That distinction is why AI’s migration from a financial market theme into a real economy driver matters for durability assessments.
The institutional estimates are converging on a meaningful productivity contribution:
- McKinsey Global Institute (June 2025) estimated generative AI could add $2.6 trillion to $4.4 trillion annually to global productivity, with a substantial U.S. share, documenting early adoption in business services, software, and manufacturing
- Goldman Sachs Global Investment Research (reported by the Financial Times, 10 February 2026) estimated AI could raise U.S. labour productivity growth by approximately 0.4 percentage points per year over the next decade
- Brookings Institution (November 2025) found early firm-level evidence of higher output per worker in AI-adopting firms, particularly in information services, finance, and professional services
- Federal Reserve Governor Christopher Waller (Bloomberg, 4 April 2026) noted that AI-related investments in data centres and software are visible in BEA figures, with equipment and intellectual property investment categories growing faster than overall GDP since 2024
NBER research on AI and labour productivity finds that gains are positive, vary meaningfully across sectors, and are expected to strengthen through 2026, a trajectory consistent with the pattern of early outperformance in information services and finance that Brookings documented at the firm level.
From data centres to GDP: tracing the investment chain
The mechanism by which AI spending enters the real economy runs through specific Bureau of Economic Analysis national accounts categories. When companies purchase semiconductors, servers, and cloud infrastructure, that spending registers as equipment investment and intellectual property investment, two components of GDP that have accelerated since 2024 according to Governor Waller.
Yardeni Research highlighted in March 2026 that AI infrastructure, including chips, servers, networking equipment, and cloud capacity, has become a major driver of S&P 500 capital spending. The AI capex boom is simultaneously a cost line for companies building infrastructure and a revenue line for the semiconductor and cloud firms selling it, creating a reinforcing loop within the same index. That dual nature is what separates a structural investment cycle from a speculative narrative: the spending generates real revenue, which generates real earnings, which supports real valuations.
The bear case deserves a serious hearing
The structural argument is strong. It is not unchallenged.
Morgan Stanley’s Mike Wilson, in a January 2026 report covered by CNBC, offered the most granular objection. Wilson acknowledged that overall earnings have improved but argued that “parts of the AI trade show classic late-cycle speculative behaviour,” pointing to extreme multiple expansion in a subset of high-growth technology names. His characterisation of the broader index: “partly supported by earnings, partly driven by optimism and multiple expansion.”
JPMorgan’s Marko Kolanovic went further. In a February 2026 strategy note reported by Reuters, Kolanovic contended the rally was “increasingly driven by positioning and liquidity rather than fundamentals,” citing narrow leadership and elevated sentiment indicators. He recommended underweighting U.S. equities.
The two critiques target different vulnerabilities. Wilson’s concern is concentrated: a pocket of AI names trading at unsustainable multiples. Kolanovic’s concern is systemic: the entire advance is more fragile than the earnings data suggests because positioning and liquidity, not fundamentals, are the marginal driver.
Crowded positioning in AI names compounds the concentration risk that both Wilson and Kolanovic identify: BofA, Goldman Sachs, and CFTC data collectively confirmed that U.S. equity positioning hit its most crowded levels since late 2021 as of mid-May 2026, with Wolfe Research analyst Chris Senyek identifying five compounding tail risks including yen carry trade unwind and AI capex disappointment as the primary mechanisms by which an overextended long book could accelerate a drawdown.
| Analyst | Firm | Stance Summary | Key Risk Cited |
|---|---|---|---|
| Ed Yardeni | Yardeni Research | Strongly earnings-driven | None specified; structural bull |
| David Kostin | Goldman Sachs | Fundamentally supported, elevated valuations | Vulnerable to earnings slowdown |
| Jan Hatzius | Goldman Sachs | Macro backdrop supportive | Soft-landing dependent on disinflation |
| Ellen Zentner | Morgan Stanley | Fundamentals sound, thin valuation buffer | Little margin for macro disappointment |
| Mike Wilson | Morgan Stanley | Mixed; speculative pockets in AI subset | Late-cycle multiple expansion in AI names |
| Marko Kolanovic | JPMorgan | Positioning and liquidity driven | Narrow leadership, elevated sentiment |
Where the camps agree is telling. Even the bears concede that earnings have improved. The dispute is over how much of the index-level gain reflects that improvement versus how much reflects anticipatory positioning that could reverse. Morgan Stanley’s Ellen Zentner captured the middle ground in March 2026: “equity valuations leave little margin for macro disappointment.” The fundamentals are real; the cushion is thin.
The next major ASX story will hit our subscribers first
Weighing the evidence: what a durable rally actually looks like from here
The weight of current data tilts toward the fundamentals case. A +9.2% earnings growth rate, a 77% EPS beat rate, a 3.0% GDP tracker, a four-year high in manufacturing activity, and an AI capital expenditure cycle that has migrated into BEA investment categories collectively form a structural argument that sentiment alone cannot explain.
That does not mean the market is without risk. Goldman Sachs’ David Kostin framed the position precisely in May 2026: the rally is “fundamentally supported but vulnerable to an earnings slowdown.” Zentner’s observation that valuations leave “little margin for macro disappointment” identifies the same fault line from the other side.
The conditions under which the structural case holds or breaks are observable. Investors can monitor them directly:
- Earnings revision trajectory: If consensus estimates for Q2 and Q3 2026 begin declining rather than stabilising, the earnings foundation weakens
- Job openings trend: A sustained decline in JOLTS data below 7 million would signal labour market softening that feeds into consumer spending risk
- AI capex execution: Quarterly reports from megacap technology firms (capital expenditure figures, cloud revenue growth, data centre build rates) will reveal whether the AI investment cycle is accelerating or plateauing
- ISM Manufacturing PMI continuation: A reading back below 50 would contradict the goods-sector re-acceleration thesis
Goldman Sachs’ estimate that AI could boost labour productivity by approximately 0.4 percentage points per year over a decade places the structural tailwind on a long timeline. The full payoff is not contained in a single year’s rally, which means both bulls and bears are partly right: the earnings foundation is real today, and the AI productivity story requires ongoing validation.
The rally has earned its case, but the verdict is still conditional
The data assembled here supports a specific conclusion. This is a rally with genuine structural underpinning, not a sentiment bubble. Earnings growth is real. The macro backdrop is firm. AI capital expenditure is registering in national accounts data, not just stock prices.
The margin of safety, however, is narrower than a 10% index gain might suggest. Valuations are elevated against historical norms, leadership remains concentrated, and the entire structural case depends on economic readings that must be sustained, not merely achieved once.
Goldman Sachs’ David Kostin described the rally as “fundamentally supported but vulnerable to an earnings slowdown,” a framing that captures both the strength and the conditionality of the current evidence.
The productive position for investors is not conviction in a direction but clarity on the conditions. The earnings trajectory, the labour market, AI capex execution, and manufacturing momentum are all observable in real time. Watch them. The data will update the verdict before the strategists do.
For investors wanting to map their portfolio positioning against the current cycle stage, our full explainer on the late-cycle bull market outlook examines how BlackRock, Fidelity, J.P. Morgan, Russell Investments, and AllianceBernstein are weighting equities as of mid-May 2026, including the specific defensive tilts toward quality balance sheets and cash-flow-rich large caps that the most cautious institutions are implementing.
This article is for informational purposes only and should not be considered financial advice. Investors should conduct their own research and consult with financial professionals before making investment decisions. Past performance does not guarantee future results. Financial projections are subject to market conditions and various risk factors.