Hormuz Crisis: 7 Weeks In, Inflation Surging, No End in Sight

Key Takeaways
- The Strait of Hormuz crisis entered its seventh week on 19 April 2026 with no diplomatic resolution confirmed, as Iran re-closed the waterway after the U.S. maintained its naval blockade.
- U.S. inflation surged to 3.3% in March 2026, a 90 basis point jump from February, with fuel oil up 44.2% and gasoline up 18.9% year-over-year.
- Federal Reserve rate cut expectations for 2026 have been eliminated entirely, with some market participants now discussing potential rate increases driven by energy-fuelled inflation.
- The S&P 500 and Nasdaq hit record highs on 15 April 2026 despite the crisis, but the S&P 500's Shiller CAPE ratio of 40.57 is the second-highest reading in over 155 years of data, historically preceding major market corrections.
- Economists warn that even a rapid resolution to the crisis will not immediately reverse its economic impact, with inflationary consequences expected to persist across multiple quarters as supply chains normalise.
Where the Standoff Stands: Timeline of the Past Week
The Strait of Hormuz crisis entered its seventh week on 19 April 2026, following Iran’s announcement the previous day that it had re-closed the waterway in response to the United States maintaining its naval blockade. This marked the continuation of the most significant energy supply disruption in modern times, with no immediate resolution in sight.
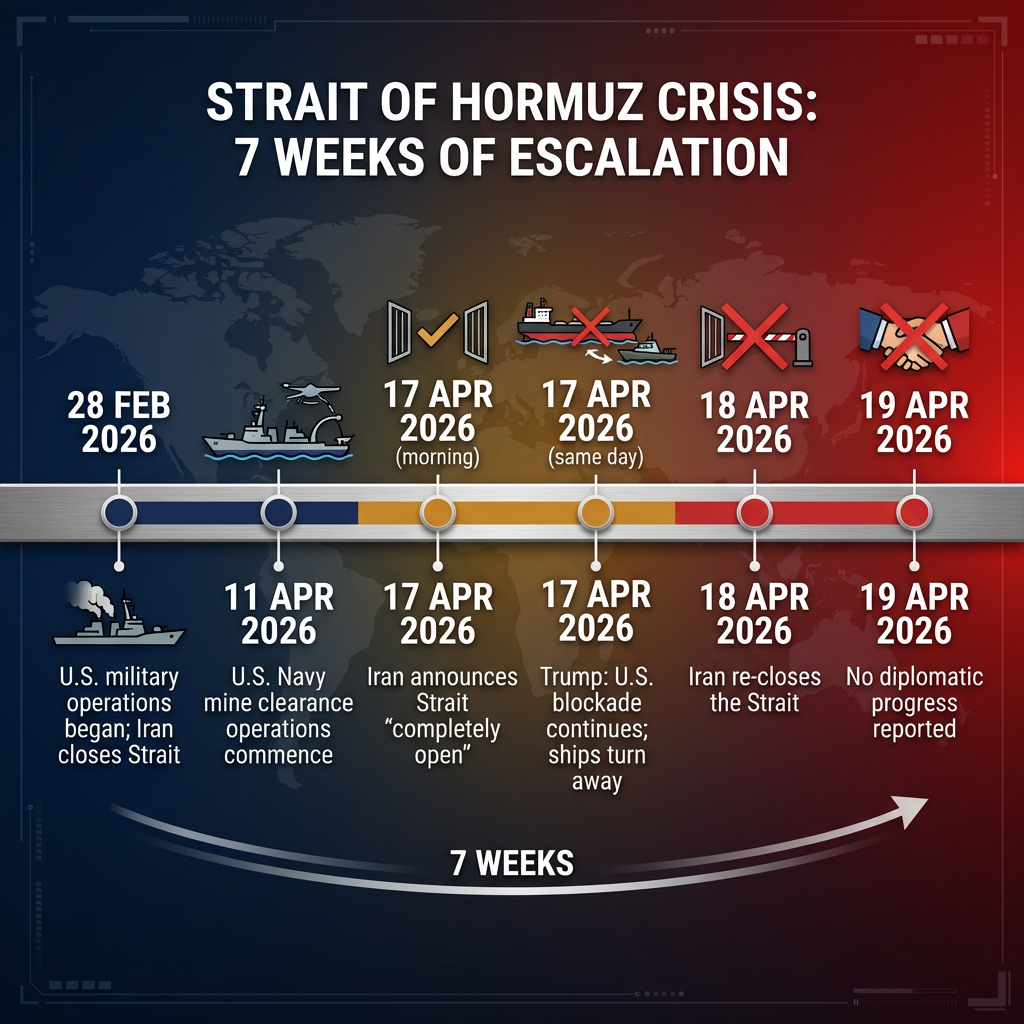
For a brief window on 17 April, relief appeared possible. Iran announced that commercial vessel passage through the Strait was “completely open” during a truce in Lebanon. Markets responded with cautious optimism. Within hours, however, President Trump clarified that the U.S. blockade on vessels entering or leaving Iranian ports would persist, and video footage showed ships turning away from the waterway.
The standoff’s recent trajectory reflects the entrenched positions of both parties:
- 28 February 2026: U.S. military operations began, triggering Iran’s initial closure of the Strait
- 11 April 2026: U.S. Navy mine clearance operations commenced
- 17 April 2026: Iran announced the Strait was “completely open” for commercial traffic during the Lebanon truce
- 17 April 2026 (same day): President Trump clarified the U.S. blockade would continue; vessels turned away
- 18 April 2026: Iran re-closed the Strait in response to the persistent U.S. blockade
- 19 April 2026: No confirmed diplomatic progress reported
President Trump stated on an unspecified Friday (likely 17 April) that the United States could open the Strait “with a little more time,” but Iran’s toll demands remain unaddressed and U.S. blockade enforcement continues. The International Crisis Group documented warnings from the administration about eliminating approaching Iranian vessels, underscoring the military dimension of the impasse.
When big ASX news breaks, our subscribers know first
Why the Strait of Hormuz Controls Global Energy
The Strait of Hormuz is a narrow waterway between Iran and Oman connecting the Persian Gulf to the Gulf of Oman and, ultimately, the open ocean. At its narrowest point, the shipping lanes funnel through a chokepoint barely wide enough for large tanker traffic to pass safely in both directions. This geographic constraint makes the Strait a natural bottleneck for energy exports from the region.
Approximately one-fifth of global oil supply transits through the Strait under normal conditions, including exports from Saudi Arabia, Iraq, the United Arab Emirates, and Kuwait. These are some of the world’s largest oil producers, and their primary export route to international markets runs through this single passage.
There are no practical alternative shipping routes for tanker traffic at this scale. Pipeline capacity through alternative overland routes cannot absorb the volume that typically moves by sea, and rerouting around Africa would add weeks to delivery times and billions in additional costs. This absence of substitutes is why seven weeks of disruption has created what energy analysts describe as the most significant supply shock in modern times.
The seven-week closure represents what the International Energy Agency describes as the greatest global energy security challenge in history, with no modern precedent for a disruption of this scale affecting such a critical proportion of global oil supply.
How the Crisis Is Hitting American Wallets
March 2026 inflation data revealed the crisis’s immediate economic toll on U.S. consumers. The Consumer Price Index jumped to 3.3% year-over-year, a 90 basis point surge from February’s 2.4%. The Cleveland Federal Reserve’s Inflation Nowcasting tool projects April inflation will reach approximately 3.58%, with estimates rising continuously.
Energy-related categories led the surge, according to data compiled by Charlie Bilello:
| Category | Year-over-Year Change (March 2026) |
|---|---|
| Fuel Oil | +44.2% |
| Gasoline | +18.9% |
| Gas Utilities | +6.4% |
| Electricity | +4.6% |
| Transportation | +4.1% |
| Dining Out | +3.8% |
| Medical Care | +3.7% |
| Shelter | +3.0% |
| Groceries | +1.9% |
The cascade effect extends beyond the petrol pump. Higher energy costs elevate transportation and production expenses for businesses across sectors, feeding through to consumer prices in categories ranging from dining out to groceries. Economists warn that even if the crisis concludes rapidly, inflationary consequences are expected to persist across multiple quarters as supply chains normalise and businesses absorb accumulated cost pressures.
Fed Rate Cut Hopes Reversed: What It Means for Borrowing
At the start of 2026, investors and analysts broadly expected the Federal Reserve to lower borrowing costs several times during the year. Rate cuts were viewed as necessary to stimulate hiring, corporate activity, and particularly financing for artificial intelligence data centre construction. The Hormuz crisis has eliminated those expectations.
The reversal in Fed rate cut expectations from two anticipated reductions to zero represents one of the sharpest monetary policy pivots in recent Federal Reserve history, driven entirely by energy-fuelled inflation overwhelming the disinflationary progress of late 2025.
With trailing 12-month inflation approaching 3.6%, the 12-member Federal Open Market Committee has little motivation to ease monetary policy. The March inflation spike reversed the disinflationary progress that had characterised late 2025, and April projections suggest the trend is worsening rather than stabilising.
Market expectations have shifted from anticipating cuts to considering the possibility of rate increases before year-end. While no rate hike has been announced or formally projected, the inflationary trajectory has reopened discussions that were considered closed just three months ago.
For American consumers, this means mortgage rates, auto loans, and credit card rates are unlikely to fall anytime soon and could rise further. Anyone planning major purchases or refinancing faces a fundamentally altered rate environment compared to expectations at the beginning of the year.
The Market Paradox: Record Highs Amid Crisis Conditions
As of 15 April 2026, both the Nasdaq Composite and S&P 500 achieved new record highs. The Nasdaq posted 11 straight days of gains, its longest winning streak since November 2021. This came just three weeks after major indices had entered correction territory around 26 March.
Market levels on 15 April:
- S&P 500: 7,126.06 (up 1.2%)
- Dow Jones Industrial Average: 49,447.43 (up 1.79%, approximately 3% below all-time high)
- Nasdaq Composite: 24,468.48 (up 1.52%, at record)
The rally reflects market optimism fuelled by expectations of swift resolution to the Iran conflict and continued strong earnings growth driven by artificial intelligence investment. Investors appear to be pricing the crisis as a temporary disruption rather than a structural shift in the economic landscape.
Analysts remain divided on whether the market paradox of record indices during crisis conditions reflects genuine AI-driven earnings resilience or a denial of macroeconomic realities, with historical valuation extremes suggesting the current rally may be pricing in near-perfect execution at a time when energy headwinds are accelerating.
The S&P 500’s Shiller Price-to-Earnings Ratio (CAPE) stands at 40.57, the second-highest reading during a continuous bull market in over 155 years of data. The historical average is 17.35.
Only three instances in recorded history have seen the CAPE exceed 40. The two prior occasions (before the dot-com bust and ahead of the 2022 bear market) were followed by S&P 500 declines of 49% and 25% respectively. Analysis from the Motley Fool’s Sean Williams warns this rally may not be sustainable, given valuations are pricing in near-perfect execution of corporate earnings forecasts at a time when macroeconomic headwinds are accelerating.
Investors face a genuine paradox. The case for continued rallies rests on rapid crisis resolution and AI-driven productivity gains offsetting inflationary pressures. The bear case centres on valuation extremes colliding with tightening monetary policy and persistent energy cost pressures. Both scenarios have historical precedent; neither has certainty.
The next major ASX story will hit our subscribers first
What Happens Next: Scenarios to Watch
No confirmed diplomatic progress has emerged in the past three to four days. President Trump’s statement that the United States could open the Strait “with a little more time” offers hope but no timeline. U.S. Navy mine clearance operations continue, but both sides remain entrenched in their positions with Iran’s toll demands unlifted and the U.S. blockade enforcement ongoing.
Key indicators to monitor as the crisis evolves:
- Progress on U.S. Navy mine clearance operations and any signals regarding completion timelines
- Movement on Iran’s toll demands or any indication of negotiated terms
- Diplomatic back-channel signals or third-party mediation efforts
- Crude oil price movements, which will reflect market expectations of resolution or escalation
- Statements from U.S. Central Command or Iranian officials regarding operational status
Critical data remains unavailable, including real-time crude and petrol price movements since 15 April, updated Federal Reserve responses to the inflation trajectory, and detailed expert geopolitical analysis from the past 72 hours. The situation remains fluid, and information gaps limit the ability to project outcomes with confidence.
The Bottom Line for Americans
The Strait of Hormuz crisis has triggered the most significant energy supply disruption in modern times, sending inflation surging to 3.3% in March with April projections at 3.58%, reversing Federal Reserve rate cut expectations, and creating a market paradox where indices hit records despite genuine economic damage. Seven weeks into the standoff, no resolution is in sight.
Even if resolution comes tomorrow, the economic effects will persist for multiple quarters. Energy price increases have already fed into transportation, production, and consumer goods costs. The Federal Reserve’s policy trajectory has shifted from easing to potential tightening. Market valuations have reached levels that historically precede corrections, even as investors price in optimistic scenarios.
For American consumers planning major purchases, investors weighing portfolio risk, or anyone filling their petrol tank, this crisis has already reshaped 2026’s economic landscape. The situation deserves continued attention.
—
This article is for informational purposes only and should not be considered financial advice. Investors should conduct their own research and consult with financial professionals before making investment decisions.
For investors weighing portfolio risk amid the valuation extremes and crisis uncertainty, our comprehensive guide to portfolio positioning during energy-driven market volatility examines defensive sector allocation, commodity hedge strategies, and the historical performance of different asset classes during supply shock episodes with worked allocation frameworks for various risk profiles.
Frequently Asked Questions
What is the Strait of Hormuz crisis and why does it matter to the global economy?
The Strait of Hormuz crisis refers to the ongoing closure of a critical shipping waterway between Iran and Oman that carries approximately one-fifth of the world's oil supply. With no practical alternative shipping routes available at scale, the seven-week disruption has triggered what the International Energy Agency describes as the greatest global energy security challenge in history.
How is the Strait of Hormuz crisis affecting U.S. inflation in 2026?
March 2026 CPI jumped to 3.3% year-over-year, a 90 basis point surge from February's 2.4%, driven by fuel oil prices rising 44.2% and gasoline rising 18.9%. The Cleveland Federal Reserve projects April inflation will reach approximately 3.58%, with estimates continuing to rise.
Will the Federal Reserve cut interest rates in 2026 given the Hormuz crisis?
Rate cut expectations have been effectively eliminated by the energy-driven inflation spike, reversing market forecasts that had previously priced in two cuts during 2026. With trailing 12-month inflation approaching 3.6%, some market participants are now discussing the possibility of rate increases before year-end.
Why are stock markets at record highs during the Strait of Hormuz crisis?
Markets appear to be pricing the crisis as a temporary disruption rather than a structural economic shift, with optimism fuelled by expectations of a swift resolution and continued strong AI-driven earnings growth. However, analysts warn that the S&P 500's Shiller CAPE ratio stands at 40.57, the second-highest reading in over 155 years, a level historically associated with significant subsequent declines.
What should investors watch for as the Strait of Hormuz standoff continues?
Key indicators include progress on U.S. Navy mine clearance operations, any movement on Iran's toll demands, third-party diplomatic mediation efforts, and crude oil price movements that reflect market expectations of resolution or escalation. The situation remains fluid, with no confirmed diplomatic progress reported as of 19 April 2026.