The Federal Reserve just raised interest rates to 3.75-4.00%. Inflation is still running at 3.4%. Unemployment is holding at 4.1%. None of those numbers is alarming on its own, but together they describe a central bank missing both of its legally required targets at the same time.
That is not a policy failure. It is precisely the tension the Fed was built to manage, and it is exactly why the framework behind these decisions is so hard to execute in practice.
Here is why it matters to you directly. Every time the Fed moves, your mortgage costs shift, the purchasing power of the dollar in your wallet shifts, and the attractiveness of US assets against foreign ones shifts with it. The Federal Reserve dual mandate is not an abstraction for policy wonks. It is the decision-making engine behind the rates you pay and the value of the currency you hold.
Here is the framework the Fed actually uses, the tools it reaches for when it acts, and the market signals professionals track to stay one step ahead of the next move. By the time you finish, you will read Fed decisions as a system, not a series of surprises.
What the dual mandate actually requires the Fed to do
Start with the law, because everything else builds on it. Congress requires the Federal Reserve to promote three things, according to the Congressional Research Service: “maximum employment, stable prices, and moderate long-term interest rates.” The first two are what people mean when they say the dual mandate.
Those five words sound simple. They describe an assignment that frequently contradicts itself.
Here are the three statutory objectives, kept separate so you can see them plainly:
- Maximum employment: the highest level of jobs the economy can sustain without triggering runaway inflation
- Stable prices: low and predictable inflation over time
- Moderate long-term interest rates: a byproduct of achieving the first two, rarely treated as a standalone target
Notice what is missing. Congress never wrote a specific inflation number into law. The 2% target is the Fed’s own operational choice, a definition it adopted to give “stable prices” a measurable meaning. Nor is there a legislated unemployment target: “maximum employment” is a moving estimate that shifts with demographics and productivity, not a fixed figure the Fed can simply aim at.
The hard part is that the two goals pull against each other. Fighting inflation usually means slowing the economy, which costs jobs. Stimulating employment usually means cheaper money, which can stoke prices. You cannot floor both pedals at once.
One complication worth holding in mind is that the Fed’s actual economic reach is narrower than the mandate language implies: the committee sets the overnight interbank rate, but the mortgage, business loan, and consumer credit rates that shape real activity are downstream variables the Fed can influence but not directly control.
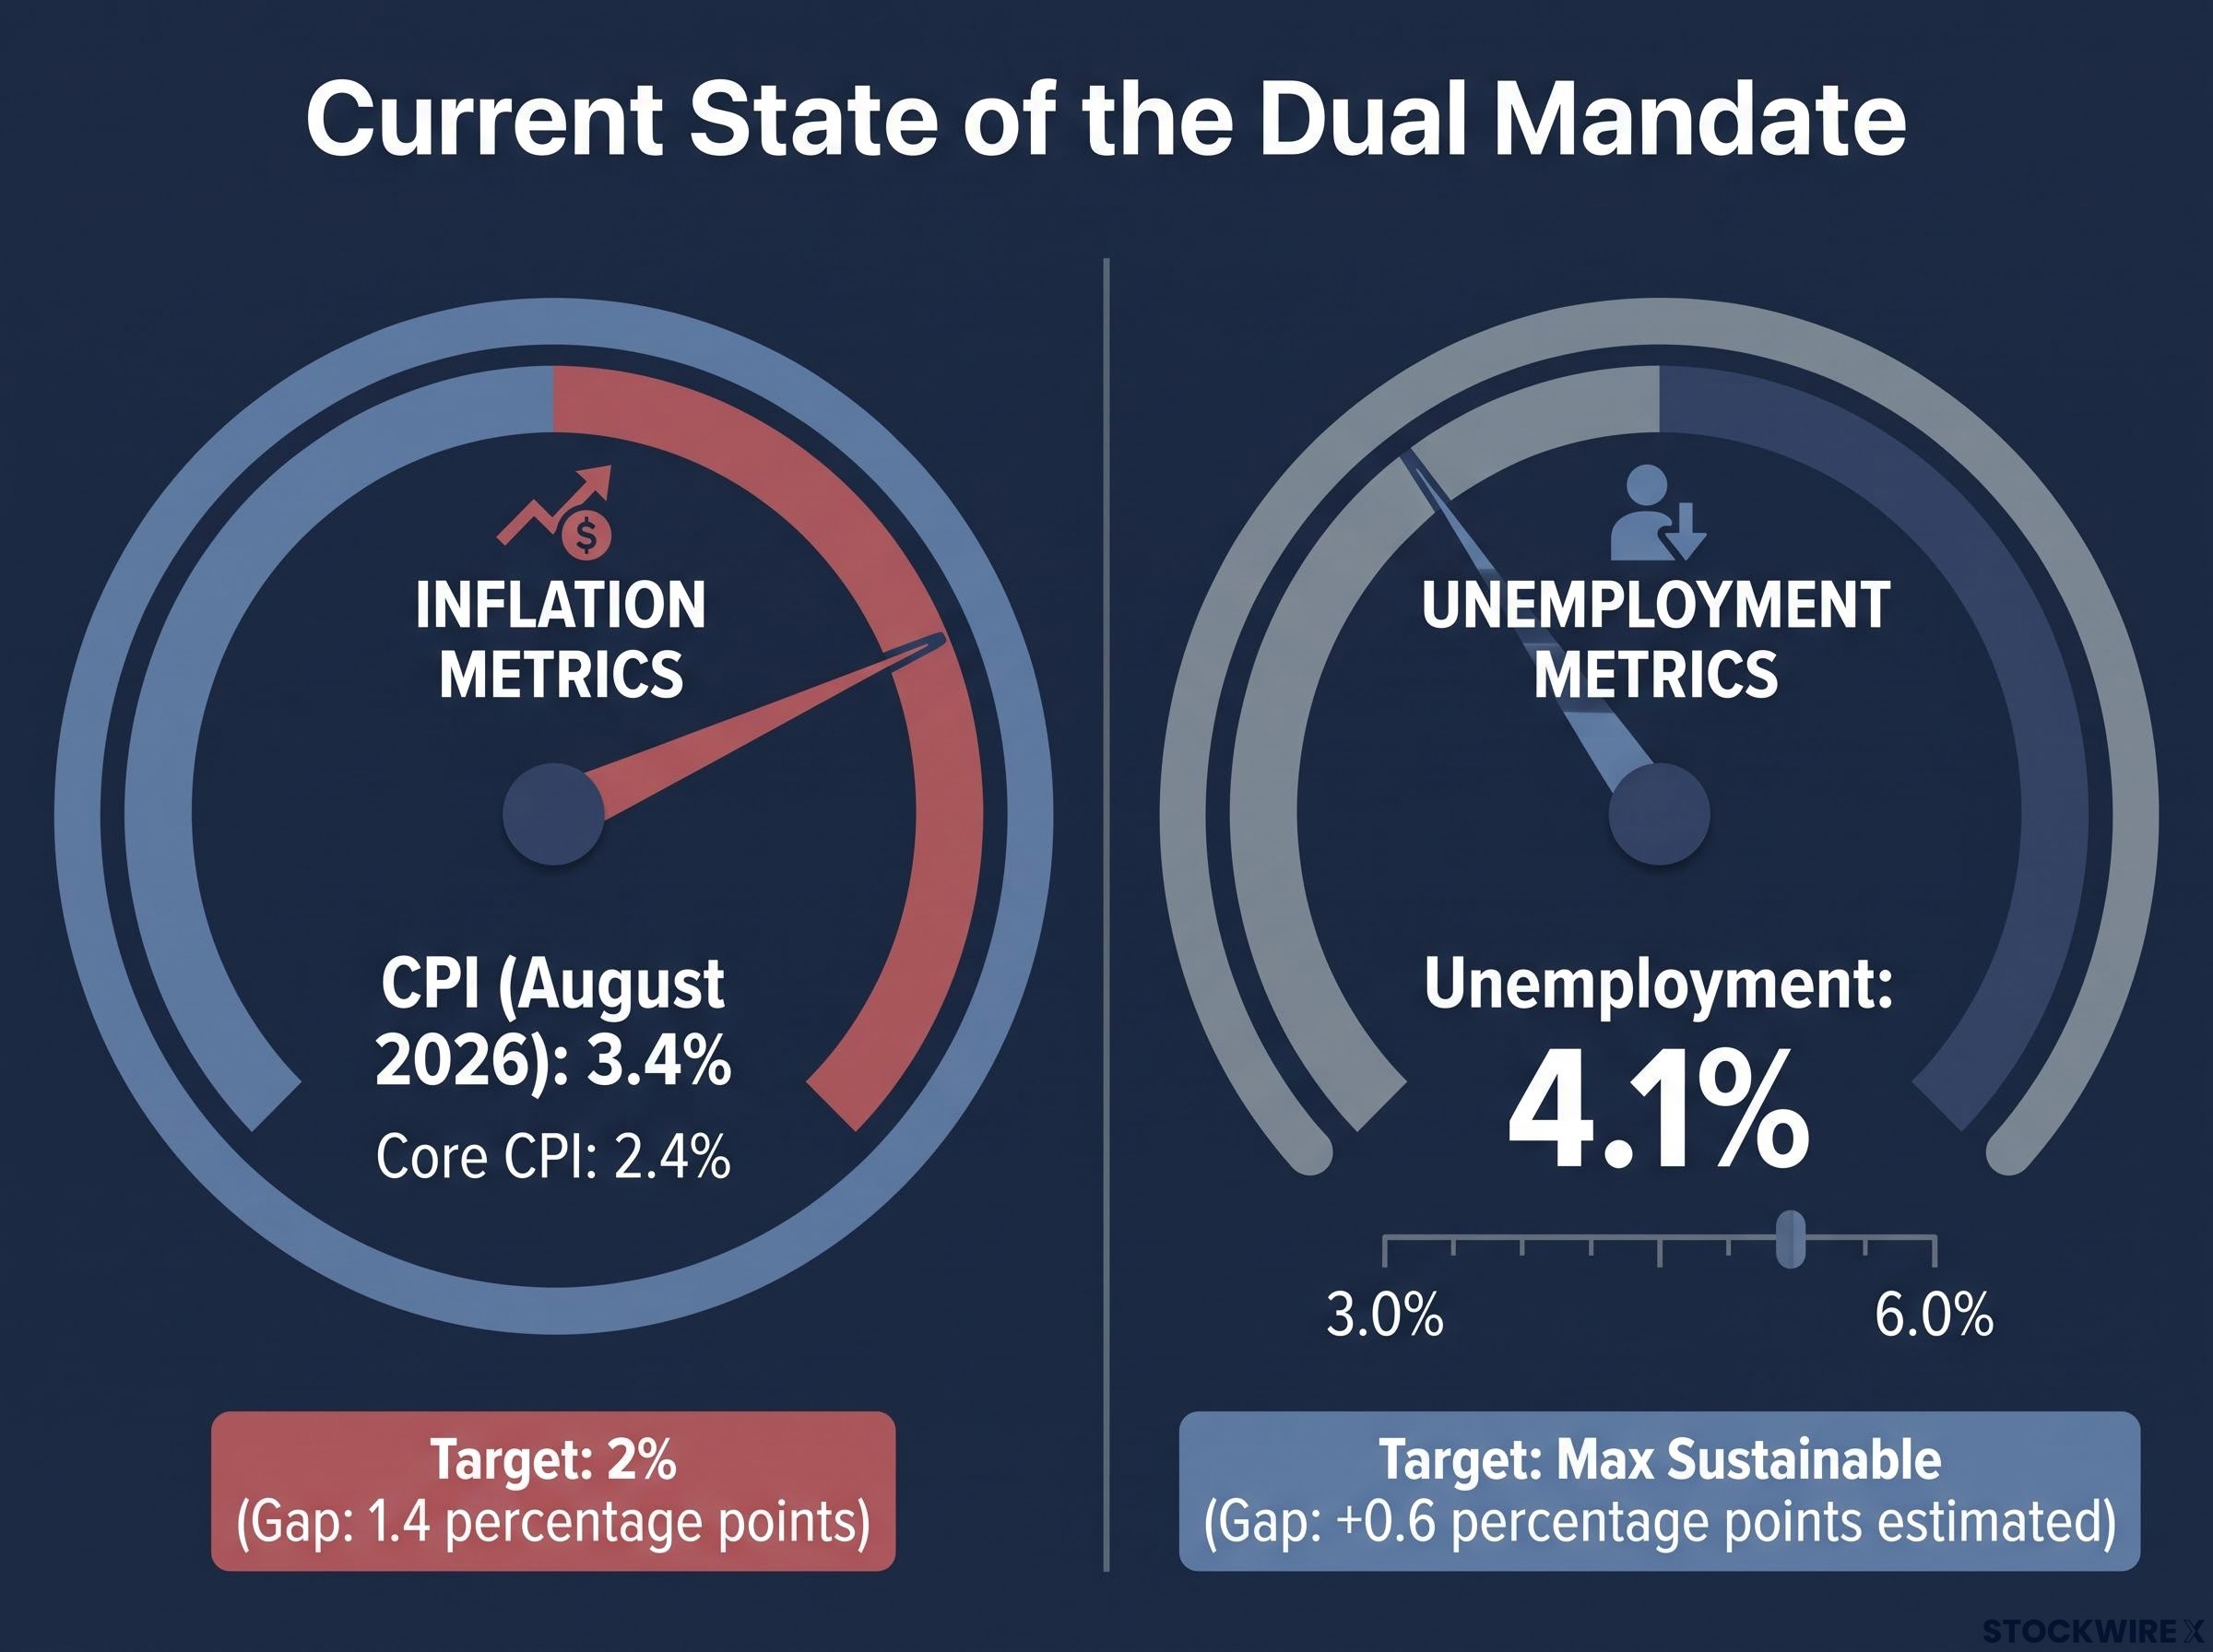
Look at the current numbers and the bind becomes obvious. CPI is running at 3.4% year-over-year as of August 2026 (BLS), well above the 2% target, while core CPI sits at 2.4%. Unemployment is at 4.1%. The Fed is arguably missing on both sides at the same time.
So which goal wins? Atlanta Fed President Raphael Bostic offered the clearest rule in a November 2025 speech.
When mandated objectives are in tension, policy should prioritise the goal that is farthest from being achieved, often price stability when inflation sits materially above target.
For you, that principle is the key that unlocks Fed behaviour. It explains why the Fed does not automatically cut when unemployment ticks up or hike every time prices rise. It weighs both, then leans hardest on the goal that is furthest off track.
When big ASX news breaks, our subscribers know first
The Fed’s toolkit: how rate moves, QE, and QT translate mandate goals into action
If the mandate is the assignment, the toolkit is how the Fed actually carries it out. Each instrument has a specific job, a specific condition it is built for, and a specific trade-off it creates. Learn to match the tool to the situation, and Fed announcements stop sounding interchangeable.
Standard tool: the federal funds rate
The federal funds rate is the Fed’s primary lever. It is the target range for the interest rate banks charge each other for overnight lending, and it ripples outward into the cost of mortgages, car loans, and credit cards.
The Federal Open Market Committee (FOMC) sets it. That committee has 12 voting members: the seven Board of Governors, the New York Fed president, and four regional presidents who rotate through on one-year terms. They meet eight times a year to decide.
When inflation runs hot, the FOMC raises the range to make borrowing more expensive and cool demand. When employment weakens, it lowers the range to encourage borrowing and spending. That is the entire logic in one sentence, but the timing of it is where the difficulty lives.
The September 2026 decision shows the lever in action. On 16 September 2026, the FOMC raised the federal funds rate by 25 basis points to 3.75-4.00%, ending a stretch of holding at 3.50-3.75%.
That hike did not come out of nowhere. At the July 2026 meeting, three officials, Neel Kashkari, Beth Hammack, and Lorie Logan, voted against holding rates steady, preferring the very hike that arrived two months later. For you, that dissent is a signal worth remembering: Fed decisions are contested judgments, not unanimous decrees, and dissent often points to where policy is heading next.
Non-standard tools: QE and QT
Sometimes cutting rates is not enough. That is when the Fed reaches for its crisis instruments.
Quantitative easing (QE) is a bond-purchase programme. The Fed buys high-grade bonds from financial institutions to expand credit availability and push money into the system, a tactic deployed most notably during the 2008 Global Financial Crisis when rate cuts alone could not do the job. QE tends to weaken the dollar.
Quantitative tightening (QT) is the reverse. Rather than actively selling, the Fed simply lets its bond holdings mature without reinvesting the proceeds, gradually draining money from the system. QT tends to support dollar strength.
Here is the trap to avoid: QT is not the same as a rate cut, and it is not a pivot to easing. Confusing a shift toward tightening with a shift toward stimulus can lead to costly misreads of where markets are headed.
| Tool | Typical deployment condition | Effect on borrowing costs | General effect on US Dollar |
|---|---|---|---|
| Federal funds rate | Routine policy at eight scheduled meetings | Rises with hikes, falls with cuts | Hikes tend to strengthen it |
| Quantitative easing (QE) | Crisis or very low inflation, when cuts are insufficient | Lowers longer-term rates | Tends to weaken it |
| Quantitative tightening (QT) | Unwinding prior stimulus | Gradually raises them | Tends to strengthen it |
How Fed decisions move the US Dollar
The link between a Fed rate decision and a move in the dollar is not coincidence. It follows a chain of capital flows that plays out almost mechanically, and once you see the steps, the connection becomes hard to unsee.
Here is the four-step transmission mechanism, drawn from a May 2026 analysis titled “What Makes a Currency Strong?”:
- The Fed raises its policy rate above those of peer economies.
- Domestic bonds and deposits start yielding more than foreign equivalents.
- Foreign capital buys dollars to access those higher returns.
- That increased demand pushes the exchange rate up.
Capital, in this view, is rational. It flows toward the best risk-adjusted return, which is why higher real rates tend to lift the currency that offers them.
The yield differential mechanics behind that capital flow break down in specific conditions: when a hike is fully priced in before the meeting, when markets read the move as a policy error, or when growth abroad accelerates faster than the rate advantage the Fed is offering.
The September 2026 hike put the mechanism on display. Reuters reported on 16 September 2026 that the dollar rose after the Fed lifted rates to 3.75-4.00%, as the move widened US yields relative to other economies.
What is striking is that markets had already priced the hike in. According to ING strategists, the expected outcome was largely baked into the dollar before the decision landed.
A surprise hold would have been “materially negative for the dollar,” ING strategists noted, because markets had fully priced the move to 4.0%.
That detail matters more than it first appears. It tells you the dollar responds to expectations, not just to the decision itself. By the time the vote is announced, much of the move has often already happened.
Which is why professionals track sentiment before the formal announcement. Tools like the FXStreet Speechtracker translate Fed officials’ public remarks into a numerical score. Kashkari’s recent comments scored 6.2 out of 10 against a historical average of 6.3, a reading that signals a stable, moderately hawkish tone with no lurch toward a pivot.
The broader FXStreet Fed Sentiment Index tells a similar story. It sits at 150.61, down 1.47 points, but still well above the neutral threshold of 100.
For you, the takeaway is practical. If you hold dollar-denominated assets, travel internationally, or track currency exposure in a portfolio, the FOMC calendar is not distant macro commentary. It is a schedule of events that move the value of what you own, and sentiment tools give you a read on the direction before the gavel falls.
When the two goals collide: the dual mandate’s hardest moments
The tension between employment and prices is not new. It has produced some of the most difficult chapters in the Fed’s history, and each one teaches the same lesson about what the central bank does when its goals diverge.
Here are three episodes, in order, that show the pattern escalating toward the present:
- The 1970s stagflation and Volcker shock: the foundational cautionary tale.
- The 2021-2023 inflation cycle: the modern parallel.
- 2026, the present: the latest chapter, playing out now.
In the 1970s, the Fed ran what the Richmond Fed later called “stop-go” monetary policy, repeatedly easing to bring down unemployment. According to Federal Reserve education material, the result was that “all we ended up doing was raising the inflation rate.” Inflation expectations came unanchored, and the cost of that mistake was severe.
Breaking it required pain. Chair Paul Volcker sharply raised the federal funds rate, triggering a punishing recession, but ultimately restoring price stability. The lesson was blunt: once inflation entrenches, the bill for taming it only grows.
A structural factor the Volcker comparison omits is the fiscal dominance constraint: federal debt at roughly 122% of GDP means each percentage point of rate increase now imposes approximately four times the fiscal interest cost it did in 1981, limiting how aggressively the current tightening cycle can push rates before government debt servicing becomes the binding consideration.
The 2021-2023 cycle rhymed with that history. The Fed held rates low to support the post-pandemic recovery, then in December 2021 announced plans to taper QE as inflation pushed well above 2%, followed by an aggressive run of rate hikes as prices departed sharply from target.
The through-line connecting both episodes is the sequencing rule the Fed keeps returning to. As RSM economist Joe Brusuelas put it in March 2026, the Fed “can’t attack both ends” of its mandate at once.
“Price stability is a precondition of maximum sustainable employment,” Brusuelas argued, meaning inflation has to be contained before the Fed can safely turn its tools toward a weakening job market.
From textbook to today
Now place today’s data inside that history. Inflation is at 3.4% against a 2% target, leaving a gap of 1.4 percentage points, while unemployment sits at 4.1%. Both goals are being missed, but inflation is the more deviated one.
Apply the Bostic principle and the current tightening bias stops looking arbitrary. Minneapolis Fed President Neel Kashkari has assessed that price pressures remain excessively elevated and extend across multiple sectors, not just energy. Critics from the Congressional Research Service to the Manhattan Institute have long argued that one instrument cannot serve two goals efficiently when they diverge, which is exactly the strain on display.
For you, the implication is direct. When inflation is the farther-off goal, the Fed will tolerate higher unemployment rather than pivot, and rate cuts are unlikely until that 1.4 percentage point gap closes meaningfully. That sequencing shapes bond prices, mortgage rates, and equity valuations alike.
Reading the signals: what to watch before the next Fed decision
You now understand the mandate, the tools, and the transmission to the dollar. The final step is turning that understanding into a monitoring routine, so you are positioned ahead of the next move rather than reacting after it.
Here is the checklist worth keeping:
- CPI, released monthly by the BLS. The August 2026 reading landed on 11 September 2026, days before the FOMC met, a reminder that inflation data often sets the tone going into a decision.
- Core CPI, the food-and-energy-stripped measure, currently at 2.4%, which shows the underlying trend.
- The unemployment rate and employment-population ratio, at 4.1% and 59.1% respectively, which gauge the labour side of the mandate.
- The FOMC calendar, with eight scheduled meetings a year as the formal decision points.
- Fed speeches and sentiment tools between meetings, where policy signals often surface first.
That last item deserves attention, because it is where you gain an edge. Fed officials speak constantly between meetings, and their tone shifts before formal decisions do. The FXStreet Speechtracker converts that tone into a score: Kashkari’s 6.2 out of 10 against a 6.3 average is a stable, moderately hawkish reading, and his comments that inflation extends across multiple sectors are exactly the kind of hawkish content such a tool flags.
The FXStreet Fed Sentiment Index does the same at an aggregate level. Watch its direction, not just its level.
The FXStreet Fed Sentiment Index reads 150.61, down only 1.47 points and still far above its neutral threshold of 100.
Here is how to read that combination. When the sentiment index sits well above 100 and speech scores hold above average, the policy posture favours dollar strength. When those scores slide toward neutral, a pivot may be approaching. Right now, the marginal decline against a still-elevated level tells you professional-grade trackers see the Fed as leaning hawkish, which makes dollar strength the path of least resistance until the numbers move meaningfully closer to 100.
Where the mandate goes from here, and what it means for your dollar exposure
Pull the threads together and the core insight is this: the dual mandate is not a constraint that freezes the Fed. It is a structured trade-off framework, and knowing which side is currently dominant tells you the likely direction of policy, the probable path of the dollar, and the risk environment for rate-sensitive assets.
The current data leaves little ambiguity. With inflation at 3.4% against a 2% target, the price-stability side is the farther-off goal, so it dominates. The September 2026 FOMC statement described inflation as “elevated,” and the tightening bias is the operative posture.
The FOMC framed the September hike as supporting “a timelier return to the Committee’s 2% goal,” language that signals inflation, not employment, is driving the bus.
Everything points the same way. TD Economics characterised the stance as data-dependent but still tightening-leaning. A Reuters FX poll found hawkish guidance has kept forecasters inclined toward a firm dollar in the near term. CNBC and Reuters both reported that another rate increase before year-end remains possible if inflation does not move convincingly toward 2%.
The DXY valuation premium complicates the straightforward dollar-strength thesis: Morningstar’s model estimated the index at approximately 15% overvalued as of mid-2026, meaning current strength reflects a cyclical rate-differential premium that requires the tightening narrative to hold indefinitely in order to sustain itself.
The practical takeaway
None of this framework is academic. The mandate logic, the tool distinctions, the transmission chain, and the sentiment indices are the same inputs professional investors use to position ahead of Fed decisions, and every one of them is publicly available.
Keep the Bostic principle as your operating heuristic: whichever mandate goal is farthest from being achieved will dominate Fed behaviour. Apply it, and you will interpret every future data release, statement, and dollar move without starting from scratch each time.
This article is for informational purposes only and should not be considered financial advice. Investors should conduct their own research and consult with financial professionals before making investment decisions. Past performance does not guarantee future results. Financial projections are subject to market conditions and various risk factors, and forward-looking statements are speculative and subject to change based on economic developments.