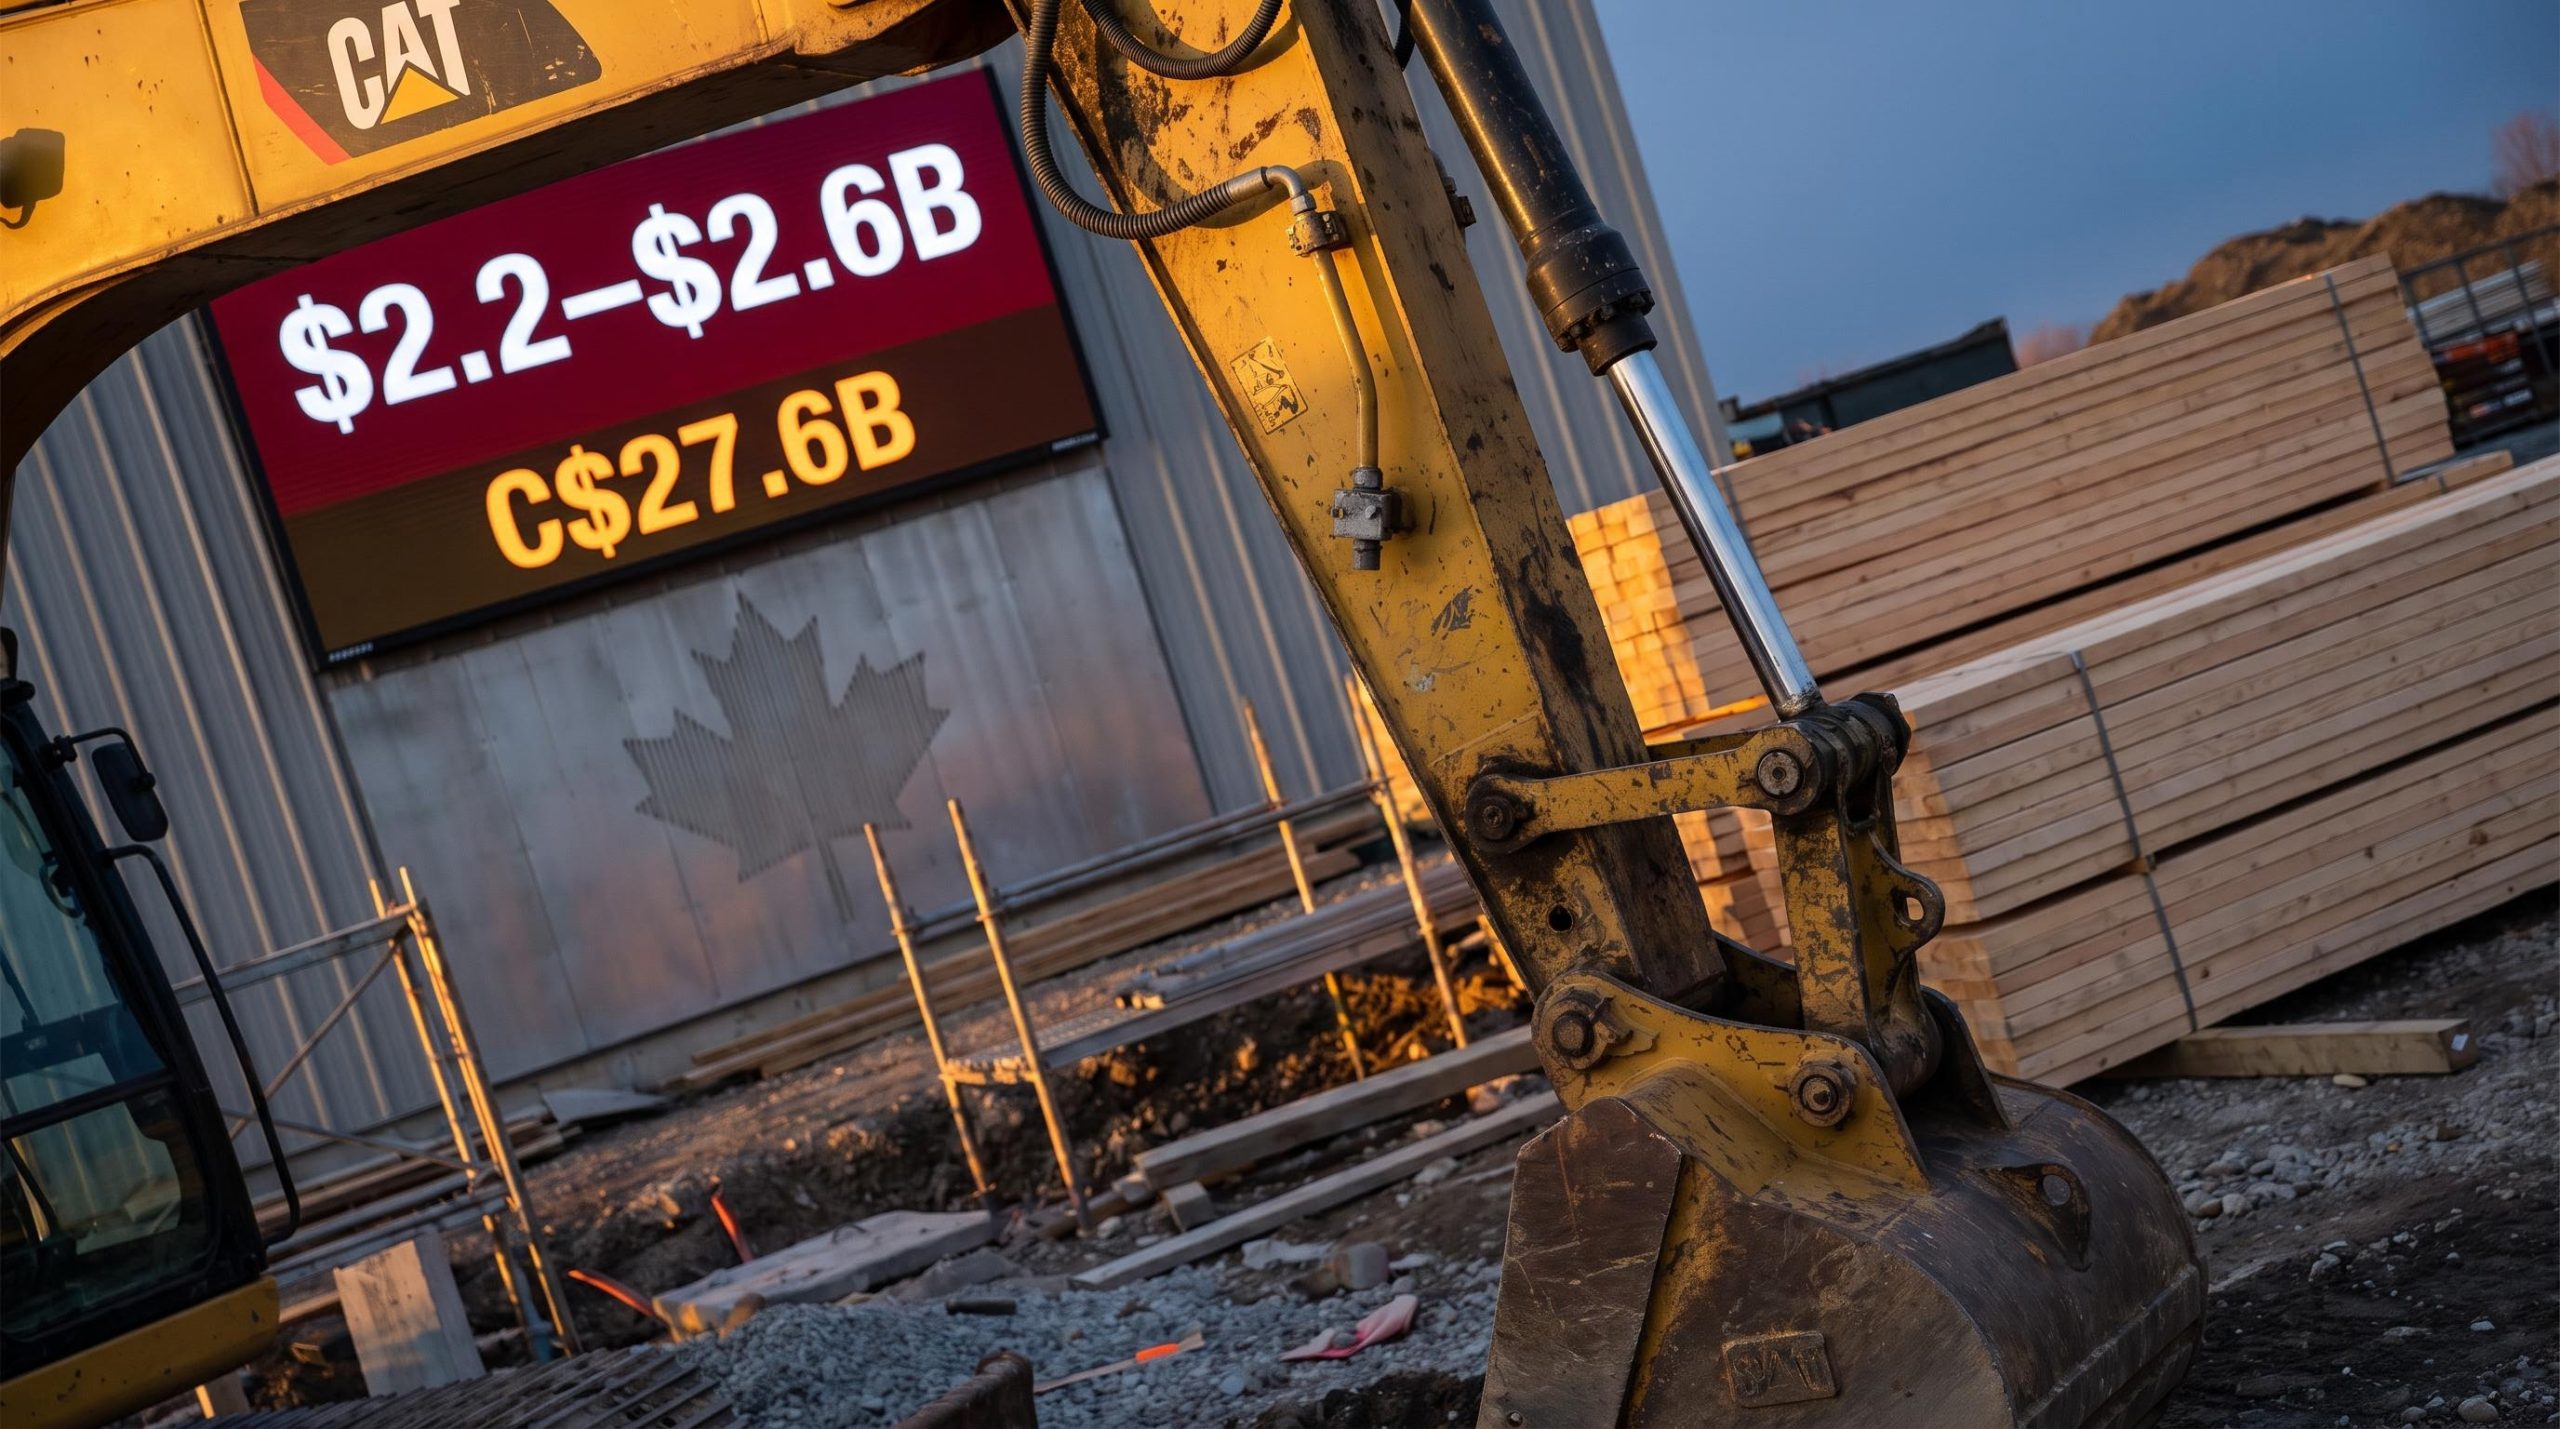
New home sales in the United States have fallen 10.5% and 7.6% in back-to-back months, a combined contraction of roughly 17% across July and June. That is the kind of deterioration that would normally dominate a market cycle conversation. But the US tariffs on Canadian lumber and cement that are about to compound the damage have not yet appeared in a single official data release.
The gap between what the numbers currently show and what is coming matters more than usual right now. Both sets of tariff measures, the US weekend round targeting approximately US$28 billion in Canadian exports and Canada’s September 8 counter-tariffs covering C$27.6 billion across roughly 700 product lines, post-date every housing, confidence, and price reading investors have in hand. Caterpillar and Home Depot, two of the Dow Jones Industrial Average’s most watched components, sit on opposite sides of the tariff transmission mechanism, and both are exposed before the data catches up.
Here is what the tariff structure, the data lag, and the specific risk channels tell you about how to read any US economic indicator released before October, and why the next two months of data are more consequential than anything published so far this year.
Why the tariff timing creates a blind spot in the data
The most recent official economic releases, from the US Census Bureau’s new residential sales figures to the Federal Housing Finance Agency’s Housing Price Index, all reflect conditions that existed before either government’s tariff schedule took effect. The June Housing Price Index registered no monthly movement, landing below both the 0.2% consensus forecast and the 0.3% recorded in the prior period. New home sales dropped 10.5% on a monthly basis in July, following a 7.6% retreat in June.
The US-Canada trade war reached a new threshold when Washington imposed 50% duties on roughly $20 billion in Canadian imports, bypassing USMCA protections and setting a September 8 retaliation deadline that gives both governments a narrow diplomatic window before cross-border supply chains reprice structurally.
The combined two-month contraction in new home sales, roughly 17% of the monthly run rate, represents the pre-tariff baseline. Conditions are deteriorating before the tariff impact has registered in a single official dataset.
Those figures describe a housing market already weakening. But they describe it under the old cost structure. Most official economic data publishes with a lag of one month or more, meaning September and much of October’s readings will still reflect pre-tariff conditions. For any investor comparing month-over-month changes, the base period itself is structurally misleading.
What the counter-tariff structure actually covers
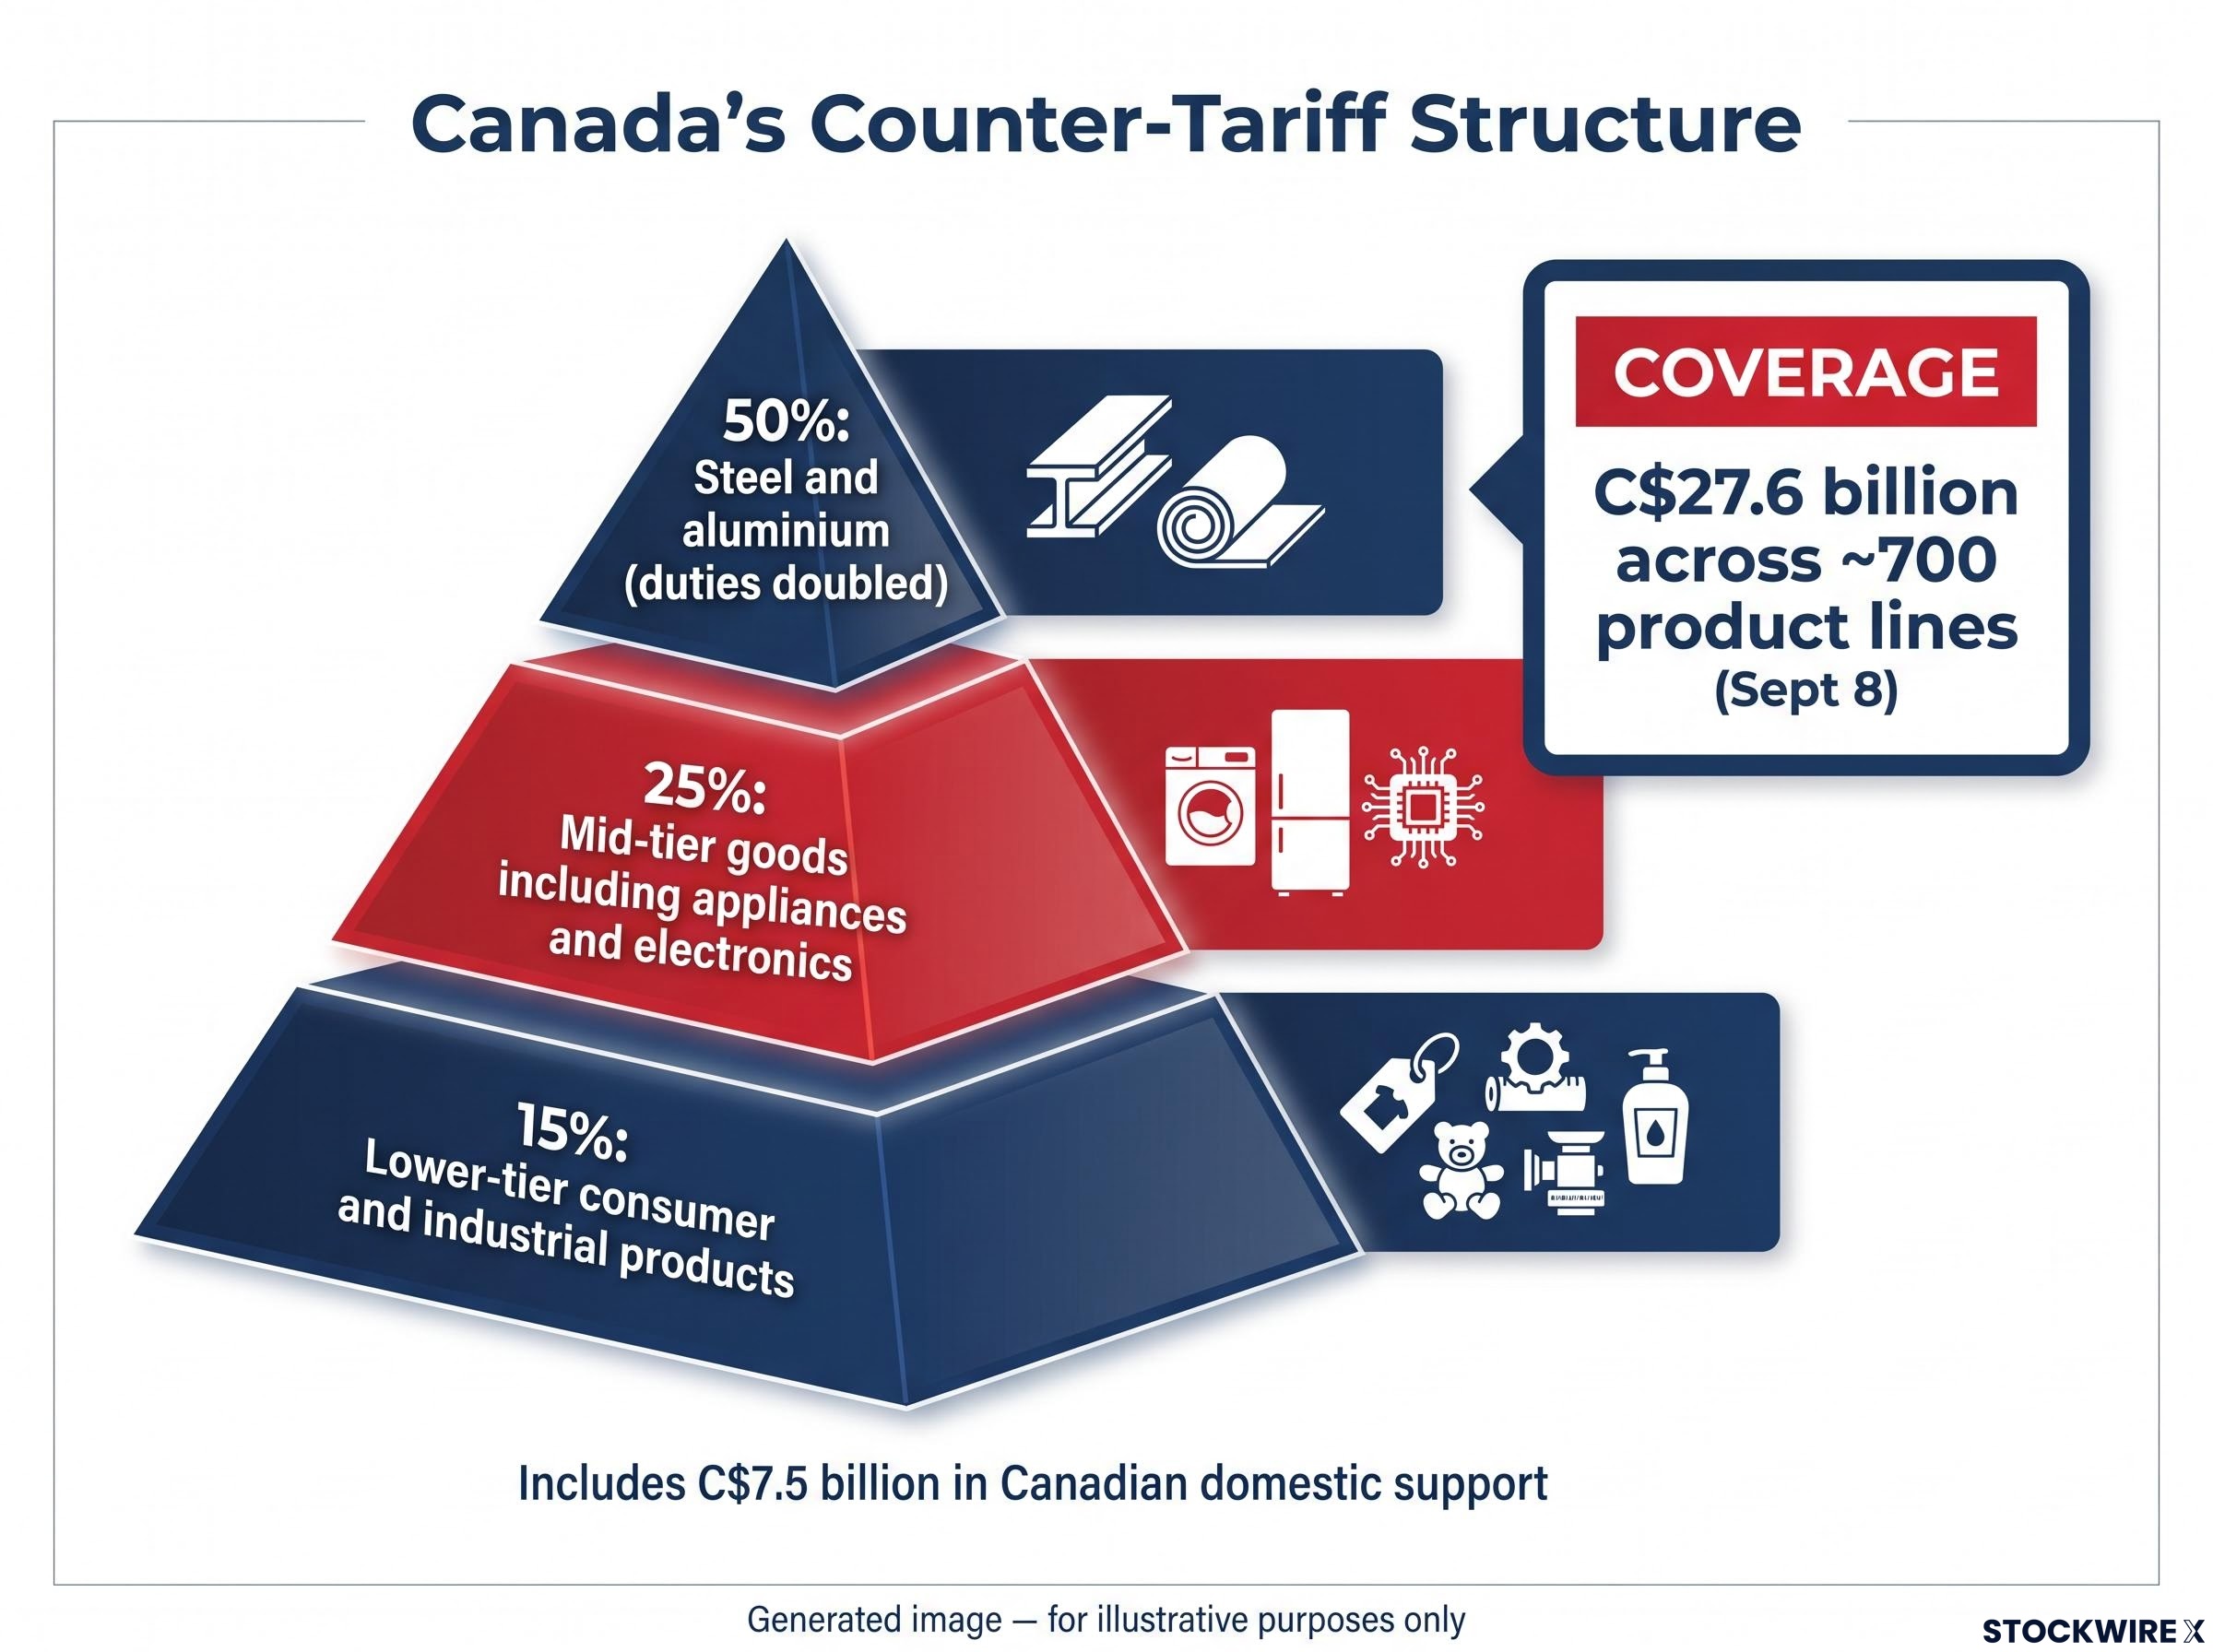
Canada’s retaliatory package applies duties across three distinct tiers, structured to cover a wide range of American goods by category:
- 15% on lower-tier consumer and industrial products
- 25% on mid-tier goods including appliances and electronics
- 50% on steel and aluminium, where duties doubled under the Canadian response
Ottawa specifically chose agricultural and construction equipment as a target category, placing Caterpillar’s core export lines squarely within the scope of the measures. The accompanying C$7.5 billion in Canadian domestic support, allocated to help businesses and workers manage the costs flowing from US tariff exposure, indicates that the retaliatory stance has been structured for durability rather than as a brief negotiating gesture.
Canada’s September 8 counter-tariff announcement confirmed the C$27.6 billion scope, the 700 product lines, and the three-tiered duty structure, with Ottawa framing the accompanying C$7.5 billion domestic support package as a signal that the retaliatory stance is built for durability rather than as a short-term negotiating gesture.
What this means in practical terms: any economic indicator you read before October is telling you about a world that no longer exists. The tariff-era economy begins in the data sometime in October at the earliest, and investors who treat current readings as a reliable baseline will systematically underestimate how much deterioration remains invisible.
When big ASX news breaks, our subscribers know first
How tariffs work through a supply chain before they reach a stock price
There are two distinct transmission mechanisms at work in this tariff round, and confusing them leads to the wrong risk assessment for both companies.
Caterpillar faces direct targeting. Canada’s counter-tariff package explicitly lists agricultural and construction equipment among its covered categories. Canadian buyers of US-origin machinery now face higher import prices under the September 8 schedule. The demand response is binary: defer the purchase or substitute a non-US supplier. Both outcomes reduce Caterpillar’s export volumes into a named market.
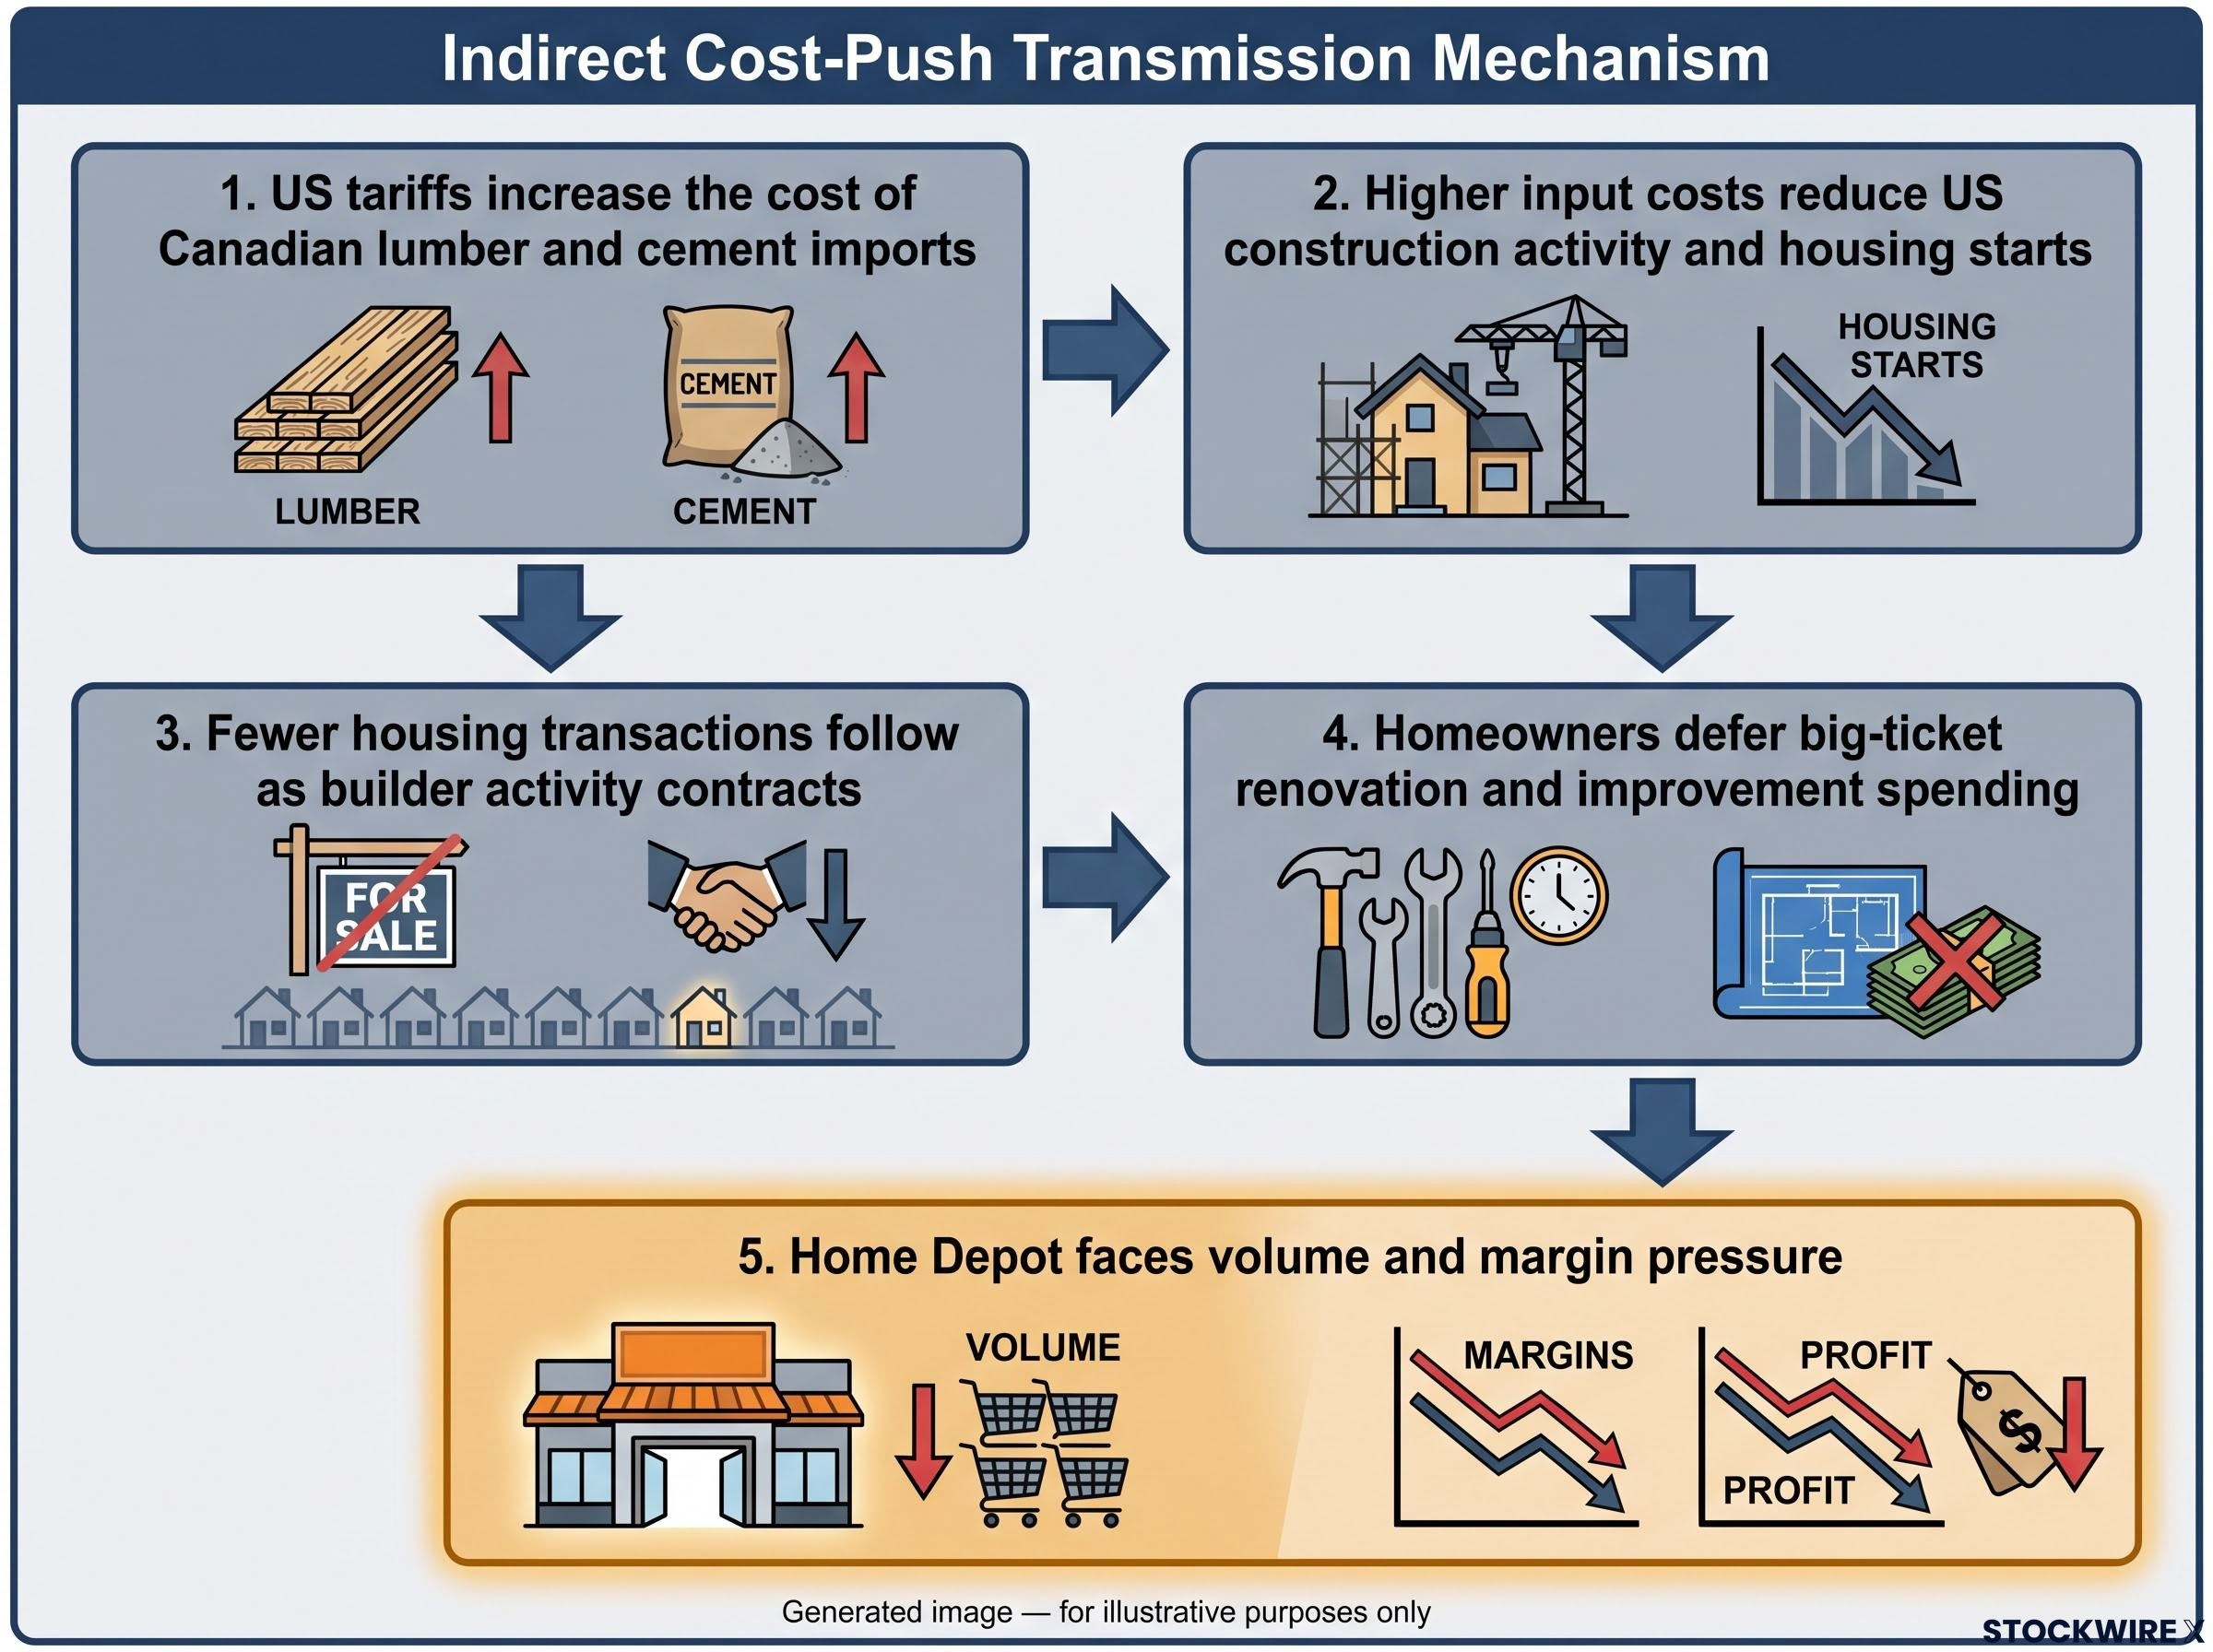
Home Depot’s exposure works differently. It is not directly listed in either tariff schedule. Instead, the pressure arrives through the construction supply chain. Canada is a major supplier of softwood lumber to the US, and US tariffs on Canadian lumber and cement raise homebuilder input costs. The transmission chain runs in a specific sequence:
- US tariffs increase the cost of Canadian lumber and cement imports
- Higher input costs reduce US construction activity and housing starts
- Fewer housing transactions follow as builder activity contracts
- Homeowners defer big-ticket renovation and improvement spending
- Home Depot faces volume and margin pressure on its core revenue categories
The exact scale of Home Depot’s near-term revenue exposure is not directly quantified in available data; this is a structural risk scenario grounded in established supply-chain economics, not a guaranteed earnings outcome.
The Conference Board’s August consumer confidence reading came in at 89.4, down 0.8 points and short of the 90.2 consensus. The shortfall was driven by the expectations component rather than the assessment of current conditions, a pattern that matters for spending behaviour. When households mark down their outlook for the next six months while still rating today as acceptable, the categories most vulnerable are those that can be postponed, which is exactly where Home Depot’s revenue is concentrated.
| Company | Tariff Exposure Type | Primary Risk Channel | Data Signal to Watch |
|---|---|---|---|
| Caterpillar | Direct targeting | Canadian demand reduction for US-origin equipment | Updated company tariff cost guidance |
| Home Depot | Indirect cost-push | Construction input costs → weaker housing → deferred renovation spending | Sequential housing starts and transaction data |
The distinction between direct targeting and indirect cost-push pressure shapes how you should assess each stock’s risk profile. Caterpillar faces a demand shock in a named export market. Home Depot faces a margin and volume squeeze through a channel that does not show up cleanly in its own tariff disclosures. Investors who conflate “not directly targeted by tariffs” with “not exposed to tariffs” will misread Home Depot’s position entirely.
Caterpillar’s escalating tariff bill, and what the numbers actually say
Caterpillar’s tariff cost guidance tells a story of compounding pressure across successive trade rounds. The company has repeatedly revised its estimates upward, and each revision represents a management acknowledgment that the previous figure underestimated the accumulating exposure.
| Year | Guidance Range | Key Driver of Revision |
|---|---|---|
| 2025 | Approximately $1.5-$1.8 billion | Cumulative tariff rounds on imported components and reciprocal measures |
| 2026 | Approximately $2.2-$2.6 billion | Accumulation of new tariff rounds, broadening of targeted categories |
Caterpillar’s 2026 full-year tariff cost guidance: approximately $2.2-$2.6 billion, up from $1.5-$1.8 billion the prior year. Quarterly impacts have been running in the hundreds of millions across prior periods.
The year-on-year revision from $1.5-$1.8 billion to $2.2-$2.6 billion tells you that each successive tariff round has added costs management did not initially anticipate. The trajectory is a more reliable signal than any single analyst estimate, because management has demonstrated a pattern of revising upward as new measures arrive. That current figure should be treated as a floor, not a ceiling.
Corporate earnings as macro signals carry particular weight in a tariff transition because management guidance on cost revisions, like Caterpillar’s repeated upward adjustments to its tariff cost range, often reaches investors weeks before the official economic data that would confirm the same deterioration in aggregate form.
As a price-weighted DJIA component, Caterpillar’s tariff exposure carries partial index-level risk. Higher-priced industrial names carry outsized weight in the Dow’s construction, meaning tariff-driven repricing in Caterpillar does not stay contained as a single-stock event.
The demand-side hit Canada’s counter-tariffs add to the cost burden
The existing cost pressure is only one side of the equation. Canada’s September 8 counter-tariffs introduce a demand-side hit on top of the cost-side burden. Canadian buyers of US-origin construction and farm equipment now face higher import prices under the retaliatory schedule.
Two responses are available to those buyers: defer the purchase until conditions change, or substitute toward non-US suppliers who are not subject to the Canadian duties. Both responses reduce Caterpillar’s export volumes into Canada, and the C$27.6 billion counter-tariff package has not yet been incorporated into Caterpillar’s published guidance range. The $2.2-$2.6 billion figure reflects cost-side exposure from prior rounds; the Canada-specific demand reduction is an additional layer that management will need to quantify.
What investors should actually be watching through October
September and October data releases will be the first to incorporate tariff-era conditions, making them disproportionately significant compared to typical monthly prints. Here are the five watchpoints that matter most, ranked by investor relevance:
- Caterpillar’s updated tariff cost guidance: The most direct corporate-level signal of Canada tariff impact; management’s pattern of upward revision means any new figure carries credibility
- Sequential housing starts and new home sales for August and September: The first readings that will capture tariff-era construction costs; compare against the pre-tariff baseline, not against seasonal norms
- Consumer confidence expectations sub-index: The forward-looking component has already deteriorated to 89.4; further weakness signals deferral of the discretionary spending categories most relevant to Home Depot
- Speed and breadth of Canadian demand reduction for US-origin equipment: How quickly the C$27.6 billion counter-tariff bite registers in export data for agricultural and industrial machinery
- Statements around the September 16 diplomatic discussions (if they occur): Three scenarios are plausible, and none should be treated as a base case:
- Phased rollback with specific product-category timelines
- Further discussion without binding agreement, extending uncertainty
- Breakdown in talks, potentially triggering additional retaliatory measures
Dick’s Sporting Goods shed over 27% of its value within a single trading session, registering what appeared to be the steepest one-day loss in the retailer’s history. Walmart closed the same session down roughly 1%. These are individual data points rather than direct tariff evidence, but they tell you that broader discretionary consumer stress is not a theoretical risk; it is showing up in real-time equity prices.
The next two months of data releases are more consequential than usual precisely because they will be the first readings that actually reflect tariff conditions. Treating them as routine monthly updates means arriving late to the signals that matter most.
Reading the escalation clearly before October changes the picture
The tariff story between the United States and Canada has a specific shape, and understanding it now separates informed positioning from reactive repositioning once October’s data arrives.
Two risk channels are operating simultaneously. Caterpillar faces a direct demand shock in a named export market, compounded by cost-side pressure that has already driven guidance to $2.2-$2.6 billion for 2026. Home Depot faces an indirect cost-push squeeze through a construction supply chain that connects Canadian lumber tariffs to deferred renovation spending, a channel that is invisible in the company’s own tariff disclosures but structurally real.
The bilateral scale anchors the structural framing: US$28 billion in US tariffs against C$27.6 billion in Canadian counter-measures. A housing market that has already contracted roughly 17% over two months provides the pre-tariff baseline from which conditions will deteriorate further once the new cost structure registers in official data.
Trade escalation at this scale is not a single event to be waited out. It is a structural input cost and demand environment that will require ongoing monitoring through at least the end of 2026. The market will price in tariff reality when October data arrives. The question is whether you understand the transmission mechanism before that repricing begins.
The muted equity market reaction to the initial 50% tariff announcement reflects more than a year of announce-delay-revise cycles that have trained investors to discount headline rates until implementation evidence arrives, a dynamic that makes the October data releases more significant precisely because they will provide the first hard implementation evidence markets cannot dismiss.
This article is for informational purposes only and should not be considered financial advice. Investors should conduct their own research and consult with financial professionals before making investment decisions. Forward-looking statements regarding tariff impacts and economic data are subject to change based on policy developments, market conditions, and various risk factors.