How Wesfarmers’ AI Strategy Is Built to Compound Returns
3 hrs ago
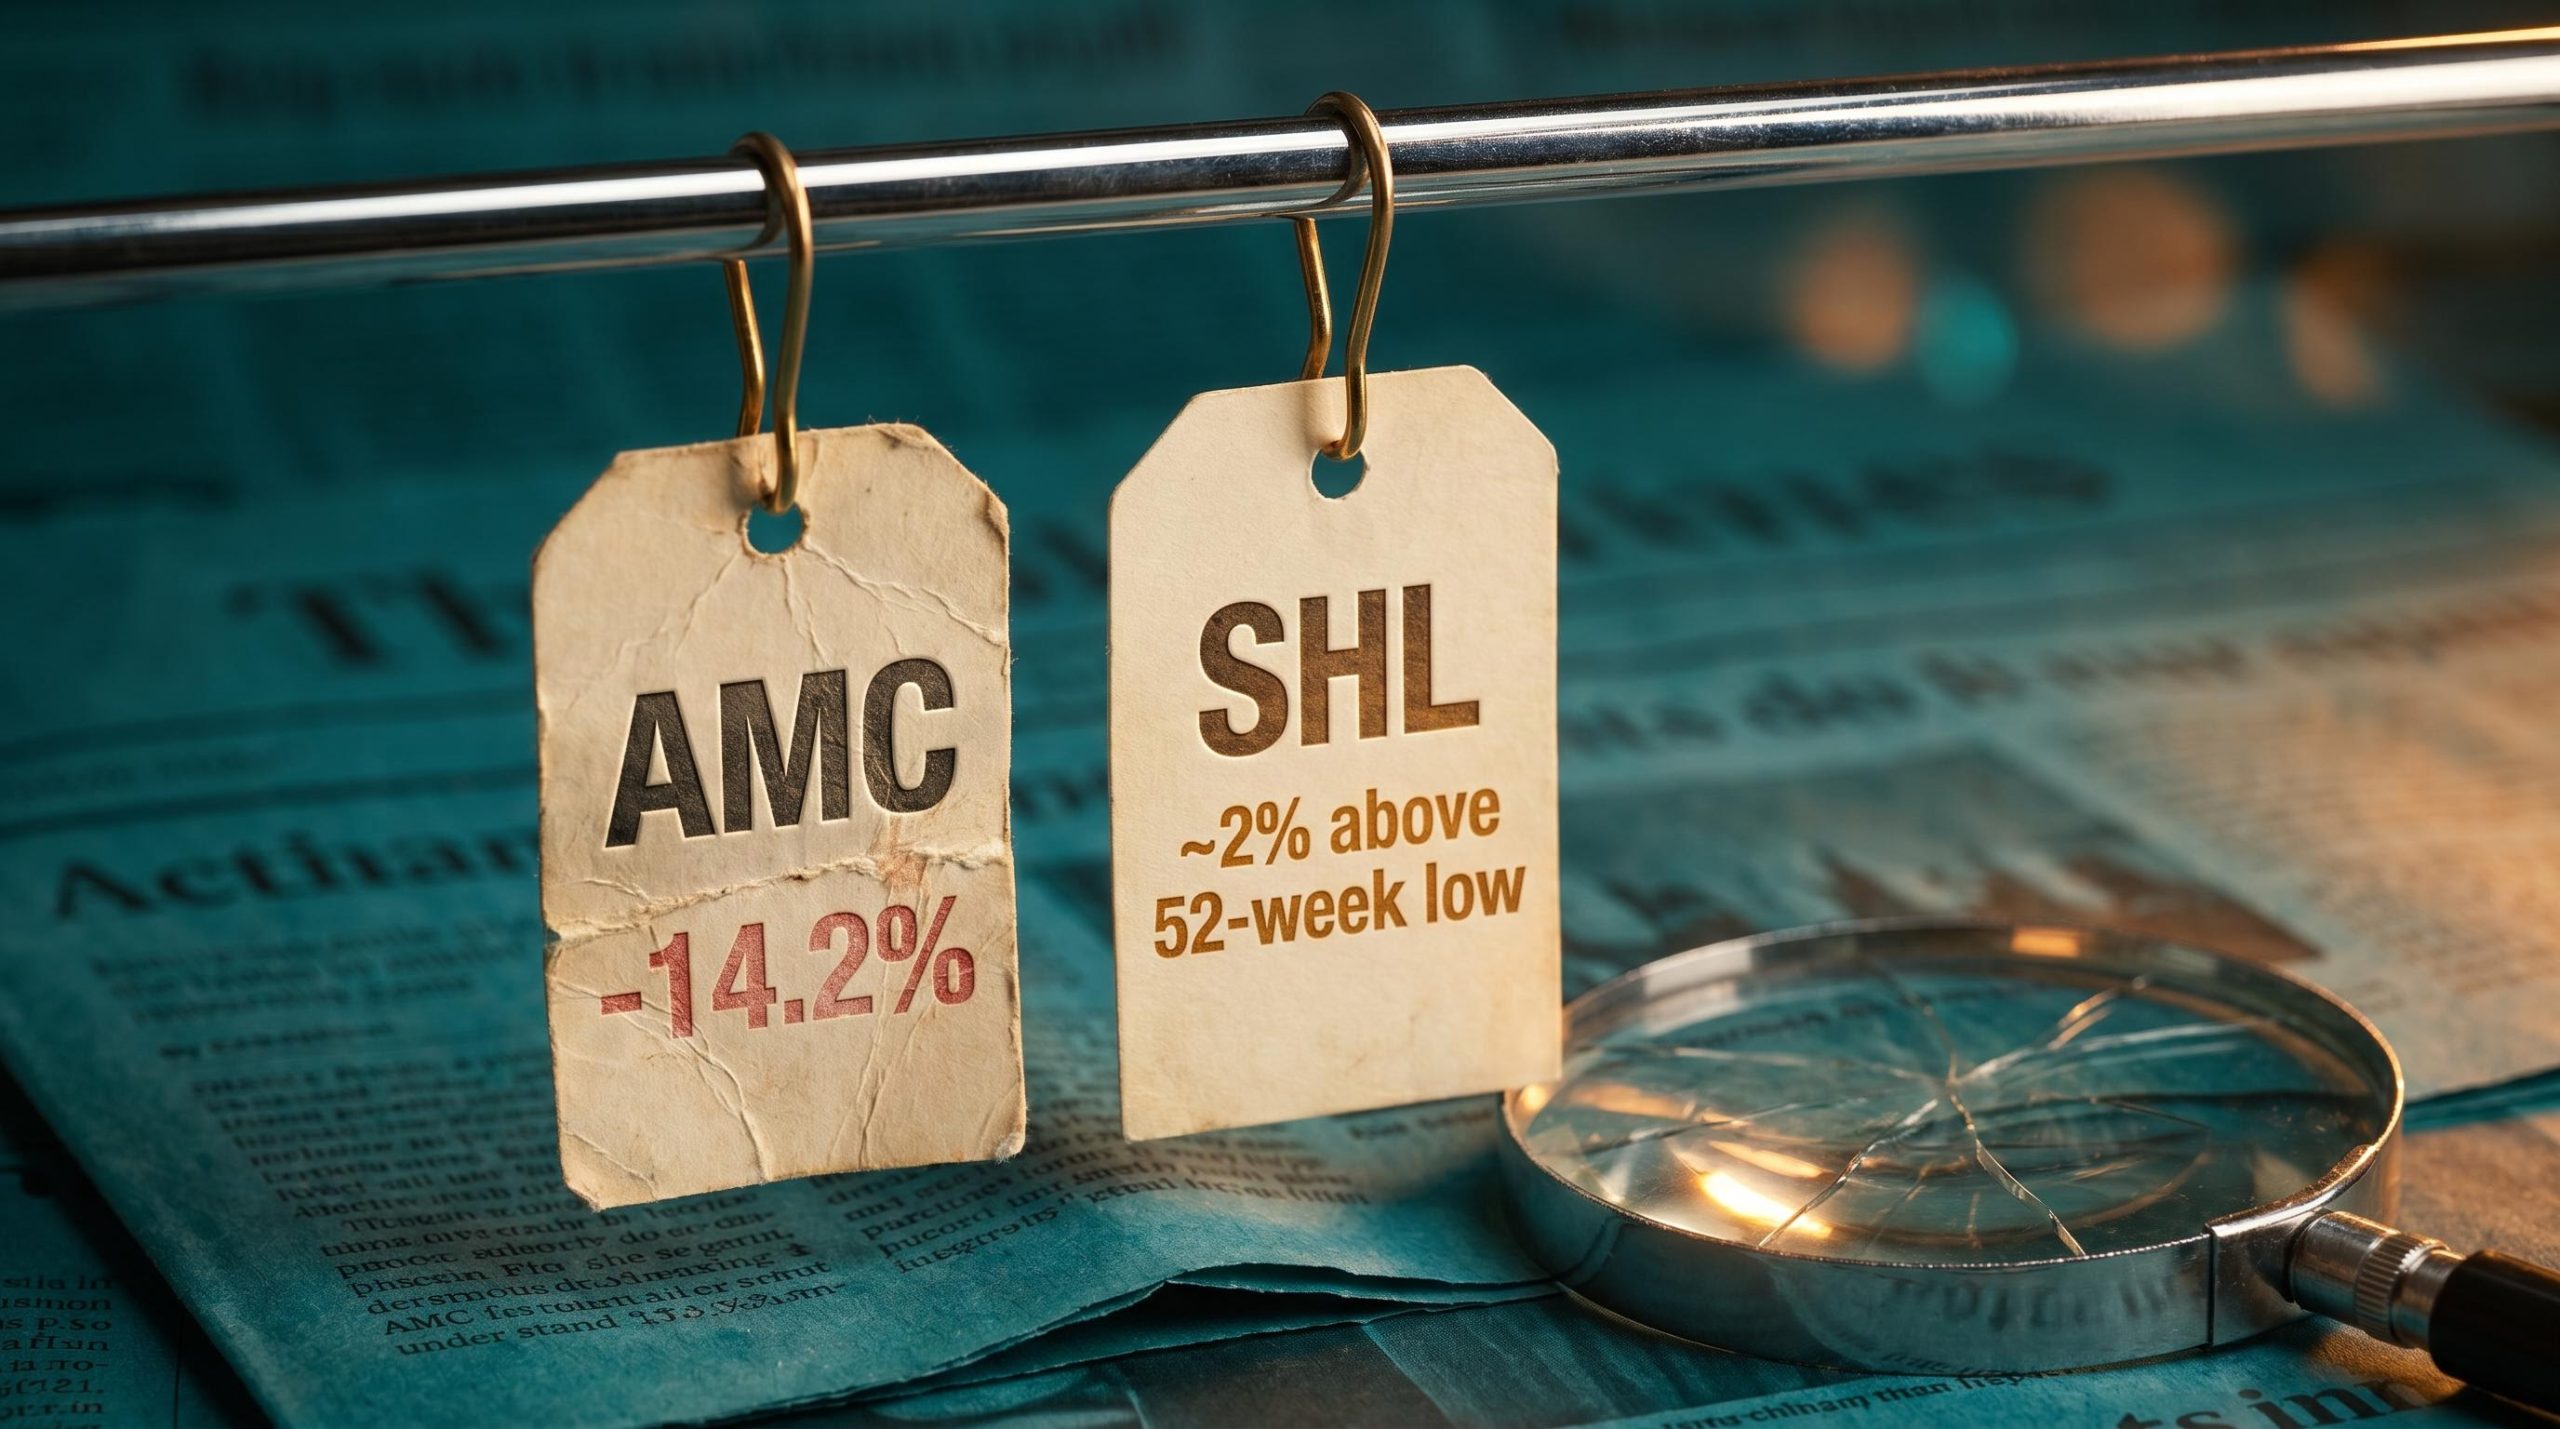
Two of the ASX’s most recognised defensive names are trading well below their own historical valuation averages in May 2026, and the question they raise is one every value-oriented investor eventually faces. Amcor (ASX: AMC) and Sonic Healthcare (ASX: SHL) have each experienced material share price declines, with SHL sitting approximately 2% above its 52-week low and AMC down roughly 14% since the start of 2025. Both carry current valuation multiples meaningfully below their five-year averages. For investors scanning undervalued ASX shares in mid-2026, these two names appear frequently in screens. This analysis examines the specific numbers behind each stock’s apparent discount, explains how to read those metrics in context, and lays out the investment case on both sides so readers can form their own informed view on whether either stock represents genuine value at current prices.
Comparing a stock’s current valuation multiple to its own historical average is a legitimate screening tool. It is not, on its own, a buy signal. The gap between where a stock trades today and where it has traded over the past five years is a starting point for inquiry, and the rest of this analysis treats it as exactly that.
Two metrics anchor this comparison. Dividend yield measures the annual dividend payment as a percentage of the share price; it rises when the price falls and the dividend holds, but also when the dividend is cut less than the price drops. Context determines which is happening. Price-to-sales (P/S) ratio measures the share price relative to revenue per share; as Rask Media’s methodology notes, it is more appropriate for companies where earnings are volatile or suppressed, since revenue tends to be more stable.
“A below-average multiple is a question, not an answer.”
The cyclical versus structural classification is the single most consequential judgment an investor makes before acting on a depressed multiple; a stock cheap because of a temporary volume cycle is a fundamentally different proposition from one cheap because its competitive position is eroding, and conflating the two is the most common source of value-trap losses.
Three limitations apply to simple valuation multiples used this way:
Rigorous valuation also incorporates discounted cash flow (DCF) and Dividend Discount Models, which go beyond the scope of this screen but represent the appropriate next analytical step.
Amcor’s ASX-listed CDIs closed at approximately A$53.34 on 21 May 2026, giving the global packaging group a market capitalisation of approximately A$23.8-25.4 billion. That price represents a decline of approximately 14.2% from the start of 2025, placing the stock firmly in discount territory relative to its recent trading range.
| Metric | Current | Historical reference | Gap direction |
|---|---|---|---|
| Share price change (Jan 2025 to May 2026) | -14.2% | N/A | Down |
| Dividend yield | ~4.8-7.4% (methodology-dependent) | ~4.38% (5-year avg) | Above average |
| Market capitalisation | ~A$23.8-25.4B | N/A | N/A |
| FY26 EPS growth guidance | Flat to low-single-digit (constant currency) | N/A | Modest |
The dividend yield currently sits above the five-year average of approximately 4.38%, according to Rask Media data, though the research identified significant data reliability issues around yield figures. Readers should verify the current yield against live sources before relying on any specific number.
The H1 FY26 result was characterised as “steady, unspectacular” in AFR coverage, and the company reiterated FY26 guidance for flat to low-single-digit constant-currency EPS growth. A Q3 FY26 trading update in May 2026 described volume trends as stabilising, particularly in flexible packaging across North America and Europe.
Three headwinds explain the discount:
The analyst community is genuinely split on what Amcor’s discount means. That disagreement, rather than the discount itself, is the most informative signal for investors weighing this stock.
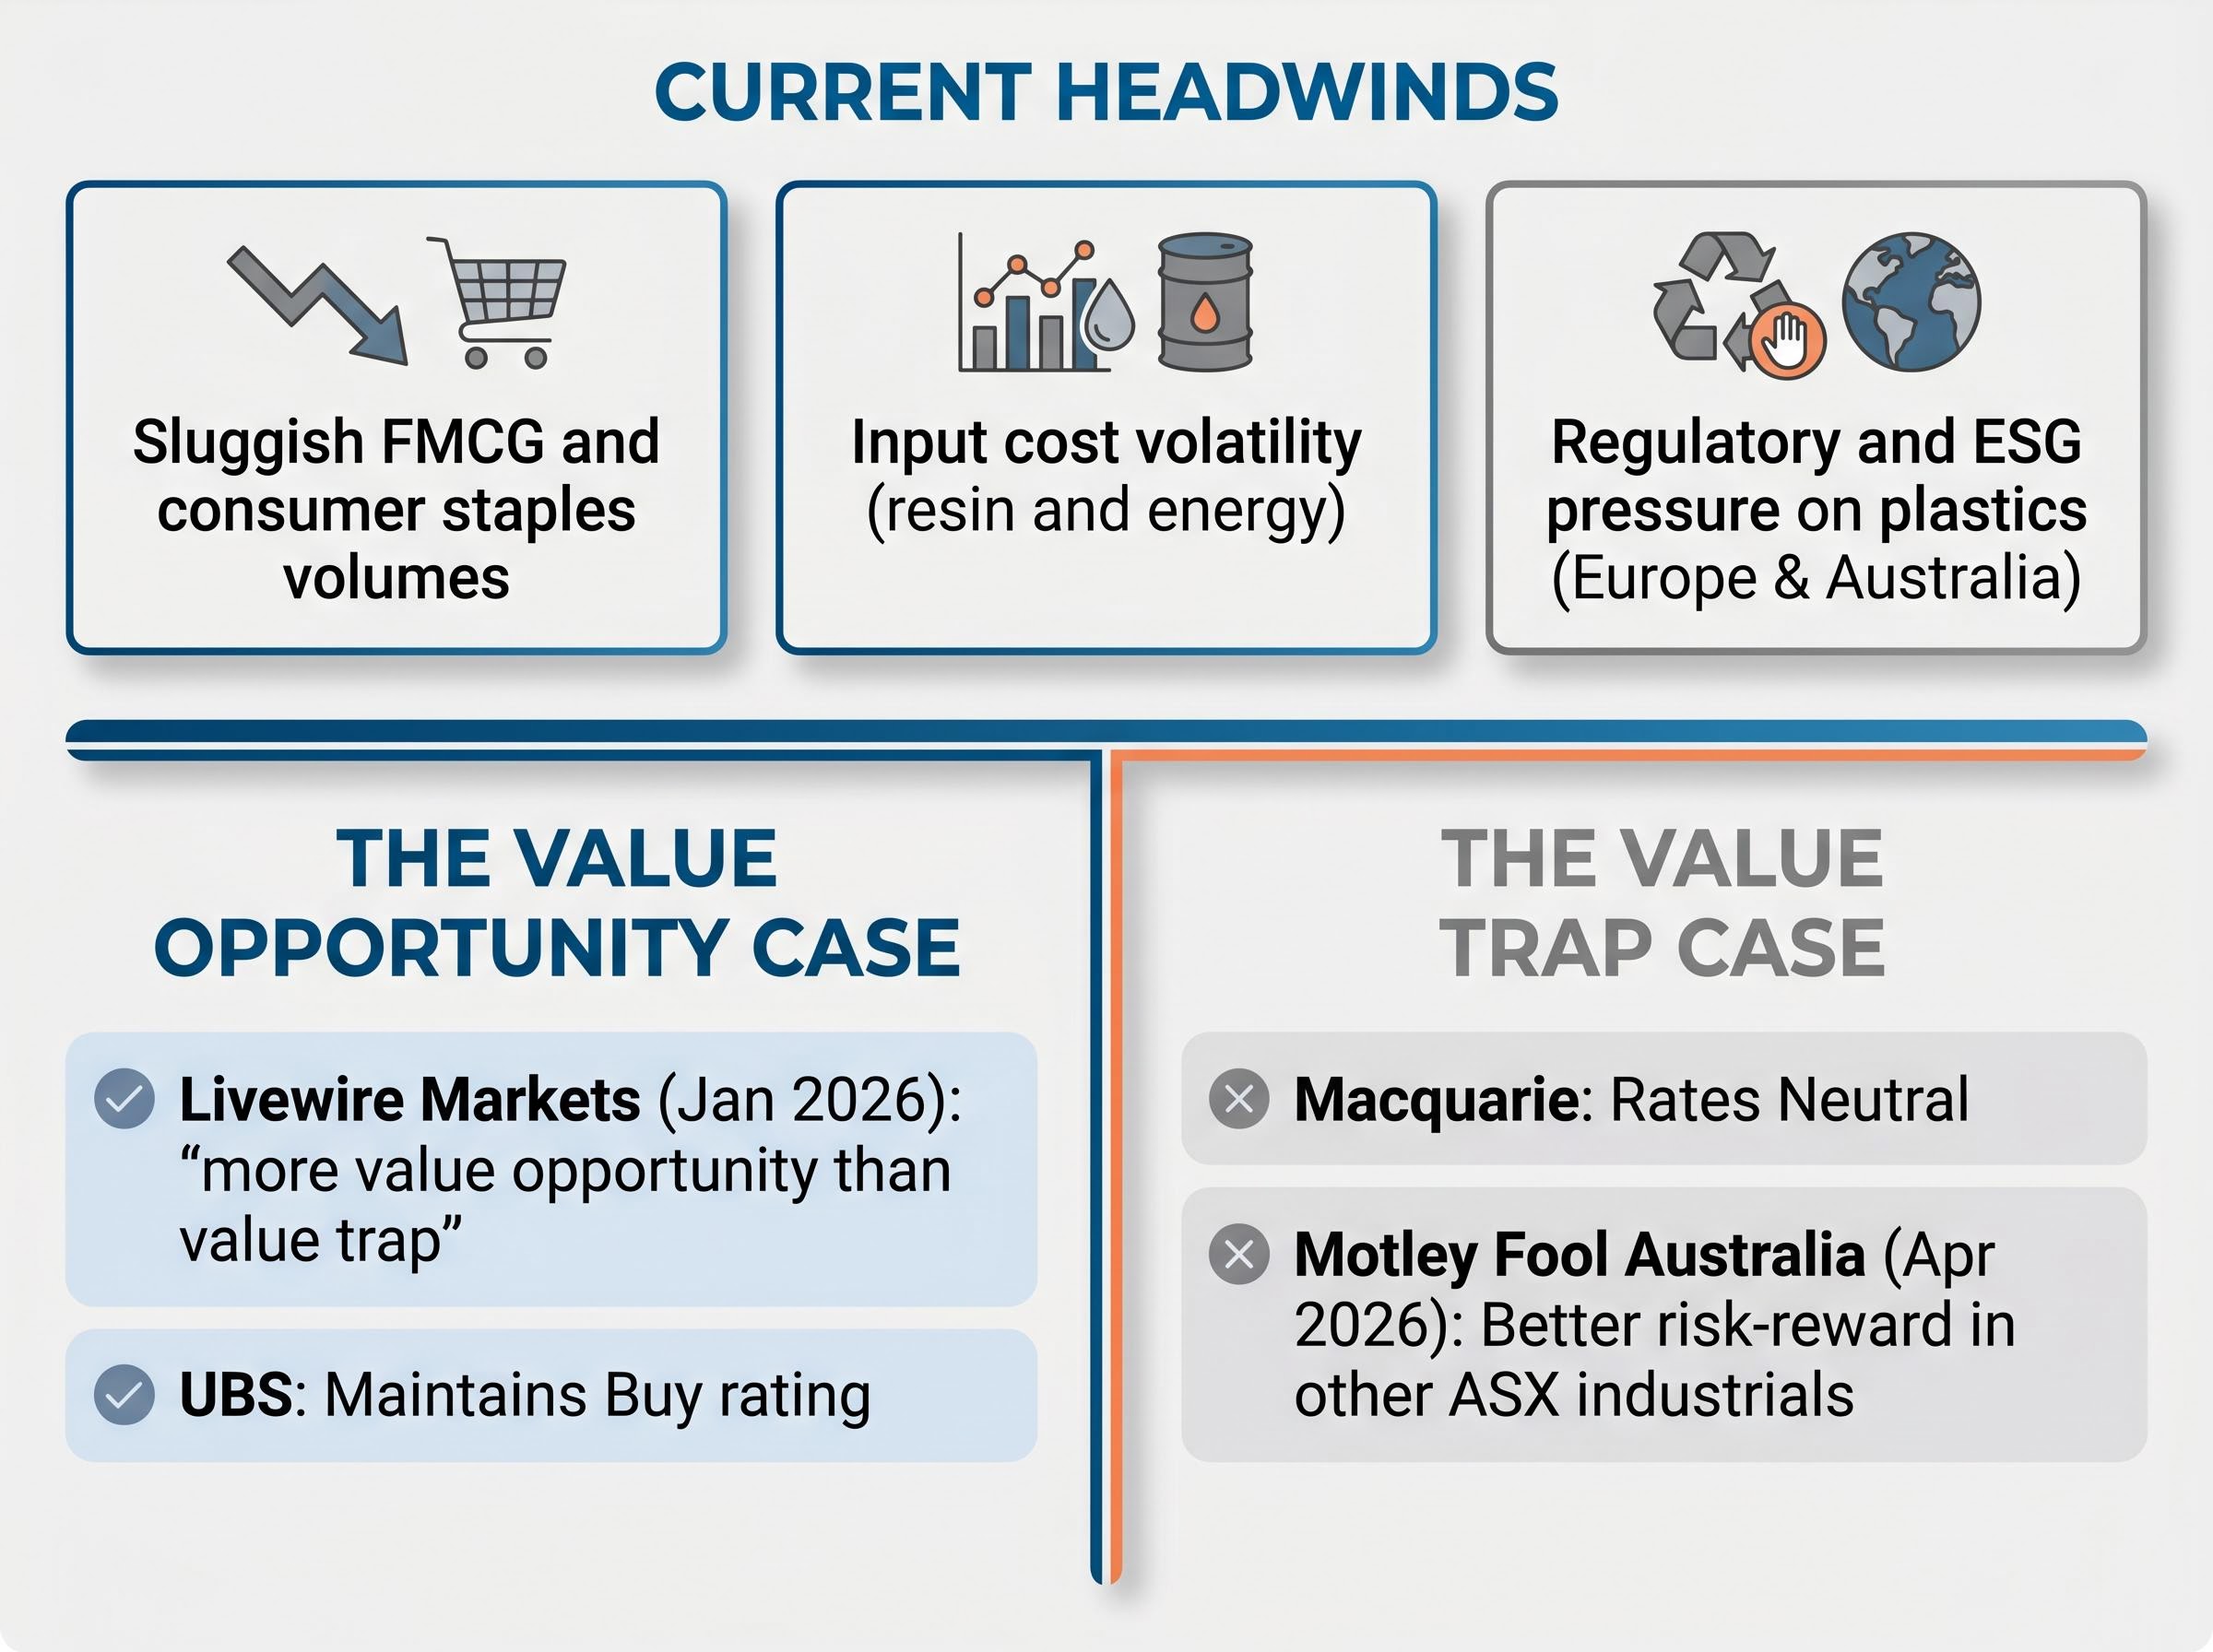
The value-opportunity case:
The value-trap case:
“More value opportunity than value trap.” — Livewire Markets, January 2026
The single most important forward-looking variable is whether volume recovery in FY27 materialises as the company’s guidance implies. That is the crux on which the value-versus-trap debate turns. Investors whose conviction rests on the cyclical recovery thesis should size their positions accordingly; those who suspect the headwinds are structural should recognise that the current discount may be warranted rather than anomalous.
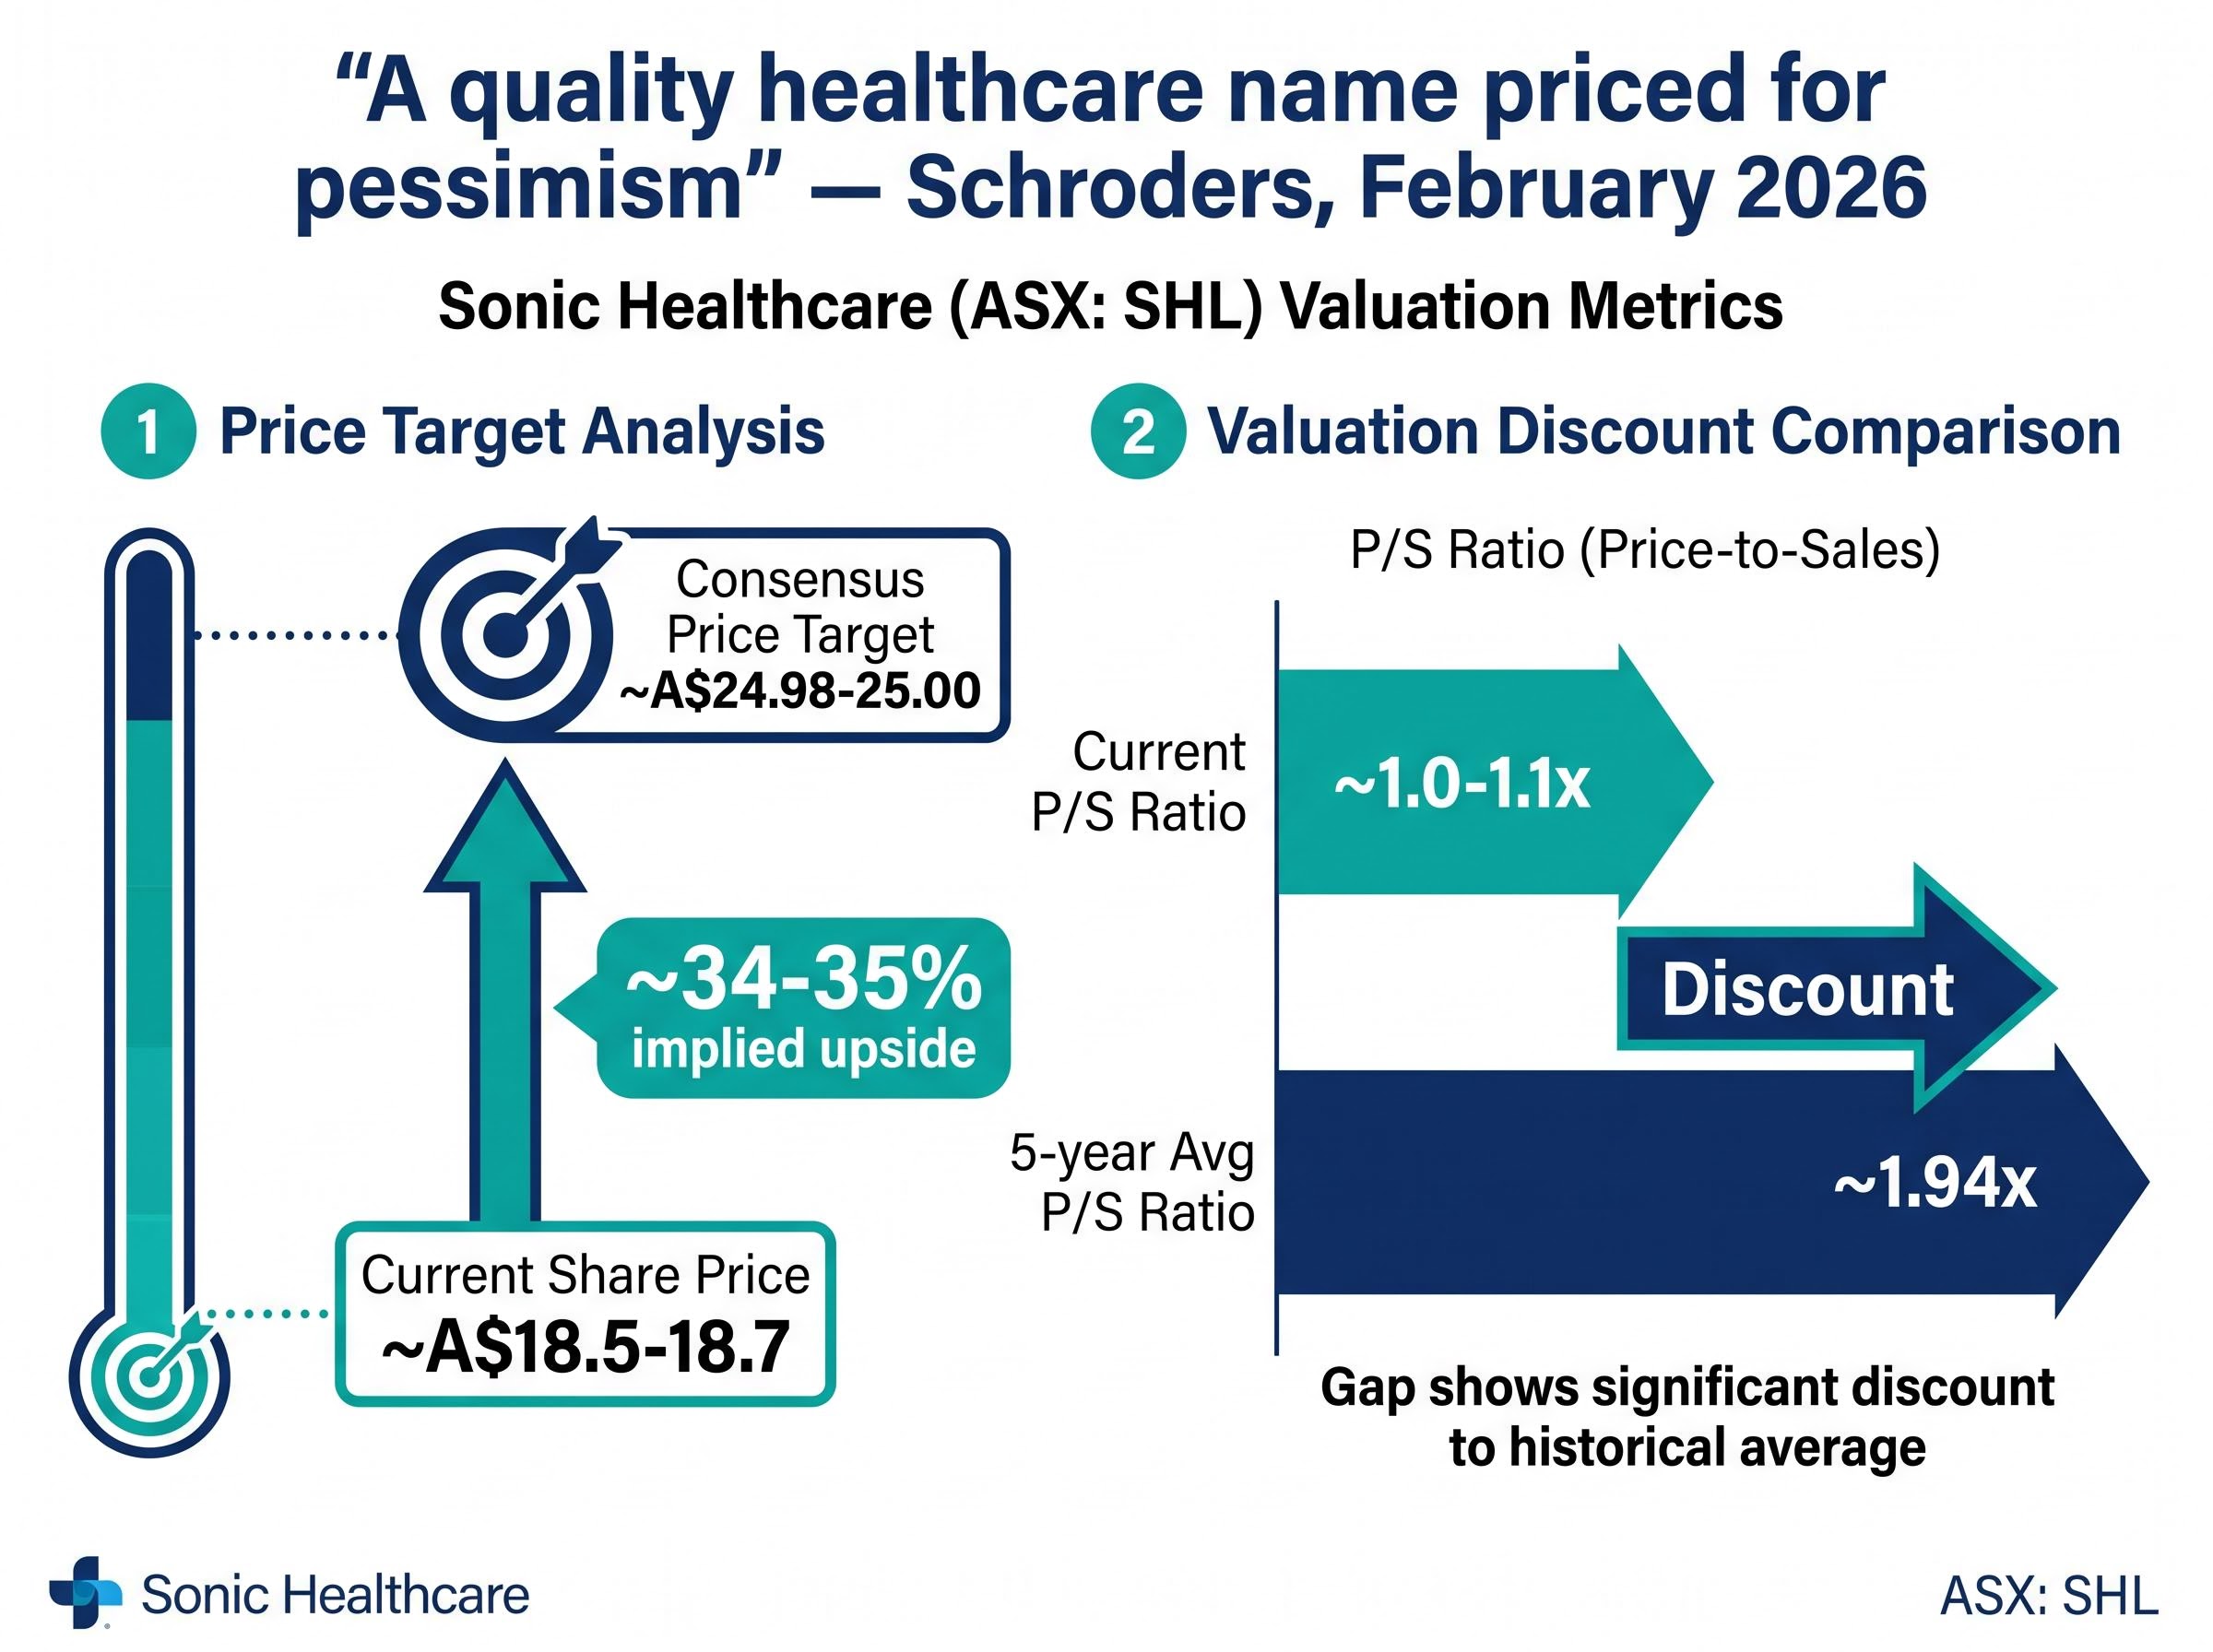
The numbers on Sonic Healthcare tell a sharper story. The current price-to-sales ratio sits at approximately 1.0-1.1x, compared to a five-year historical average of approximately 1.94x. That represents a discount of roughly 45-50% to the stock’s own historical valuation, a gap confirmed directionally across multiple research sources including Rask Media and Intelligent Investor.
P/S compression across ASX healthcare has been severe enough that Cochlear’s price-to-sales ratio fell from approximately 9.18x to 2.82x as of May 2026, illustrating how interest rate-driven de-rating can disconnect share price performance from underlying structural demand drivers without any fundamental deterioration in the business.
| Metric | Current | Historical reference / consensus | Gap / implied upside |
|---|---|---|---|
| Share price (ASX) | ~A$18.5-18.7 | N/A | ~2% above 52-week low |
| P/S ratio | ~1.0-1.1x | ~1.94x (5-year avg) | ~45-50% below average |
| Consensus price target | N/A | ~A$24.98-25.00 | ~34-35% implied upside |
| Position vs 52-week low | ~2% above | N/A | Near bottom of range |
The consensus analyst price target of approximately A$24.98-25.00 implies roughly 34-35% upside from the current price of approximately A$18.5-18.7, though consensus targets carry their own assumptions and are not guarantees. Schroders’ February 2026 review described SHL as “a quality healthcare name priced for pessimism.”
The mechanical driver of this depressed multiple is straightforward. High-margin COVID testing revenue has rolled off sharply since 2023, compressing both headline revenue growth and margins even as the core pathology and diagnostics business has grown at mid-single-digit rates. H1 FY26 results showed core pathology revenue growing at positive mid-single digits, while management guided to low-to-mid-single-digit base business revenue growth for the full year.
Management and most analysts project COVID testing revenue to be negligible by FY27. That means FY27 earnings comparisons will reflect a clean base for the first time since the pandemic, removing the mechanical headwind that has depressed headline growth figures.
Livewire’s May 2026 coverage and broker summaries framed “the COVID drag is finite” as the core investment thesis, recommending investors focus on normalised earnings metrics rather than reported headline growth. Two material ongoing risks could delay or reduce the earnings normalisation: wage inflation across laboratory and healthcare professional staff, and Australian Medicare reimbursement policy changes that could compress pathology margins.
For readers wanting to understand the macro environment surrounding Sonic Healthcare’s discount in greater depth, our deep-dive into the five forces driving ASX healthcare’s selloff examines how RBA rate decisions, AUD movements, corporate governance events, and geopolitical cost pressures have combined to create sector-wide valuation destruction, including analysis of which healthcare business models have proven most resilient to these compounding headwinds.
Viewed side by side, the two discounts tell different stories about the quality of cheapness.
The quality of the reason for cheapness matters as much as the size of the discount.
Sonic’s discount is predominantly driven by a finite, identifiable, and largely priced-in event: the COVID revenue roll-off. Once that revenue line becomes negligible, the multiple has a clear path toward re-rating. Amcor’s discount reflects a more contested mix of cyclical and potentially structural pressures, including plastics regulation, FMCG volume recovery uncertainty, and leverage, where reasonable analysts disagree on duration and severity.
| Dimension | Amcor (AMC) | Sonic Healthcare (SHL) |
|---|---|---|
| Nature of headwind | Mixed: cyclical and potentially structural | Predominantly cyclical (COVID unwind) |
| Analyst consensus direction | Split (Buy vs Neutral) | Consistently framed as opportunity |
| Balance sheet framing | Leverage noted as concern | Balance sheet strength cited as mitigant |
| P/S discount to history confirmed | Not confirmed from public sources | Confirmed directionally (~45-50%) |
| Earnings trajectory (FY26-FY27) | Flat to low-single-digit growth | Gradual normalisation expected |
Analyst consensus is meaningfully more uniform on Sonic as an opportunity. Motley Fool described SHL in March 2026 as “a quality stock temporarily out of favour,” while Amcor was described by Macquarie as screening “optically cheap but lacking near-term catalysts.” Both companies face wage inflation and regulatory complexity, but their exposure profiles differ in measurability and duration.
Simple multiples and analyst consensus targets are starting points. The research underpinning this analysis identified significant data reliability issues with some market figures in circulation, and readers should verify all price, yield, and target data against live ASX sources and investor relations materials before making any investment decision.
The recommended verification sources are Amcor investor relations at amcor.com, Sonic Healthcare investor relations at sonichealthcare.com/investors, and current ASX announcements at asx.com.au. As Rask Media’s methodology notes, DCF and Dividend Discount Models represent the appropriate next step beyond simple multiple screens.
For investors wanting to move beyond yield comparisons to a more rigorous income-based valuation framework, our full explainer on the Dividend Discount Model for ASX income stocks covers how the Gordon Growth Model formula works in practice, which ASX sectors are structurally suited to it including banks, REITs, and utilities, and how franking credits materially alter effective after-tax yield calculations for Australian investors.
ASX continuous disclosure obligations under Listing Rules 3.1, 3.1A, and 3.1B govern when companies like Amcor and Sonic Healthcare must release market-sensitive information, meaning upcoming FY26 full-year results and any material guidance changes will be publicly available through ASX announcements as soon as they are released to the market.
For Amcor, the FY27 volume guidance at the FY26 full-year result (expected August 2026) and any commentary on cost-reduction programme milestones will determine whether the cyclical recovery thesis gains traction or the value-trap concern intensifies.
For Sonic Healthcare, the FY26 full-year result (expected August-September 2026) will be the first clean read on whether the COVID drag is genuinely dissipating and whether core margins are recovering toward historical levels.
Both companies’ results will be interpreted against a macro backdrop of Australian interest rate settings and global consumer demand conditions, both of which remain uncertain at the time of publication.
This article is for informational purposes only and should not be considered financial advice. Investors should conduct their own research and consult with financial professionals before making investment decisions. Past performance does not guarantee future results. Financial projections are subject to market conditions and various risk factors.
Both Amcor and Sonic Healthcare are trading below their historical valuation averages, but the investment logic behind each discount is materially different in quality and certainty. Sonic’s thesis rests on a finite, identifiable, and largely consensus-supported normalisation event. Amcor’s rests on a more contested combination of cyclical recovery and structural risk management where credible analysts hold opposing views.
Investors should use this analysis as an entry point for deeper individual research rather than a trigger for action. Both stocks warrant assessment against individual income requirements, risk tolerance, and portfolio context. Rask Media’s deeper research resources and both companies’ most recent ASX results announcements and investor day materials offer the next layer of specificity that a screening analysis, by design, cannot provide.
When an ASX share trades below its historical valuation average, it means the current price-to-sales or dividend yield multiple is lower than the stock's own average over a prior period, typically five years. This is a screening signal that warrants further investigation, not an automatic buy signal, as the discount may reflect genuine temporary headwinds or a permanent deterioration in the business.
Sonic Healthcare is trading near its 52-week low primarily because high-margin COVID testing revenue has rolled off sharply since 2023, compressing headline revenue growth and margins even though the core pathology and diagnostics business has continued to grow at mid-single-digit rates. Most analysts expect the COVID drag to become negligible by FY27, which would allow earnings comparisons to reflect a clean base for the first time since the pandemic.
The main risks for Amcor investors include sluggish FMCG and consumer staples volumes due to ongoing destocking, input cost volatility from resin and energy prices, and increasing regulatory and ESG pressure on plastics in Europe and Australia. Analyst opinion is genuinely split, with some framing the discount as a cyclical opportunity and others warning of value-trap risk if cost savings or volume recovery underdeliver.
The price-to-sales ratio compares a company's share price to its revenue per share, making it particularly useful for companies where earnings are volatile or temporarily suppressed, since revenue tends to be more stable. Comparing the current P/S ratio to a stock's own five-year historical average can highlight potential discounts, but the ratio should be assessed alongside the reasons for the gap rather than used as a standalone buy signal.
For Amcor, the FY26 full-year result expected in August 2026 will be the critical data point, particularly FY27 volume guidance and any update on cost-reduction programme milestones. For Sonic Healthcare, the FY26 full-year result expected in August-September 2026 will be the first clean read on whether the COVID revenue drag is genuinely dissipating and whether core pathology margins are recovering toward historical levels.