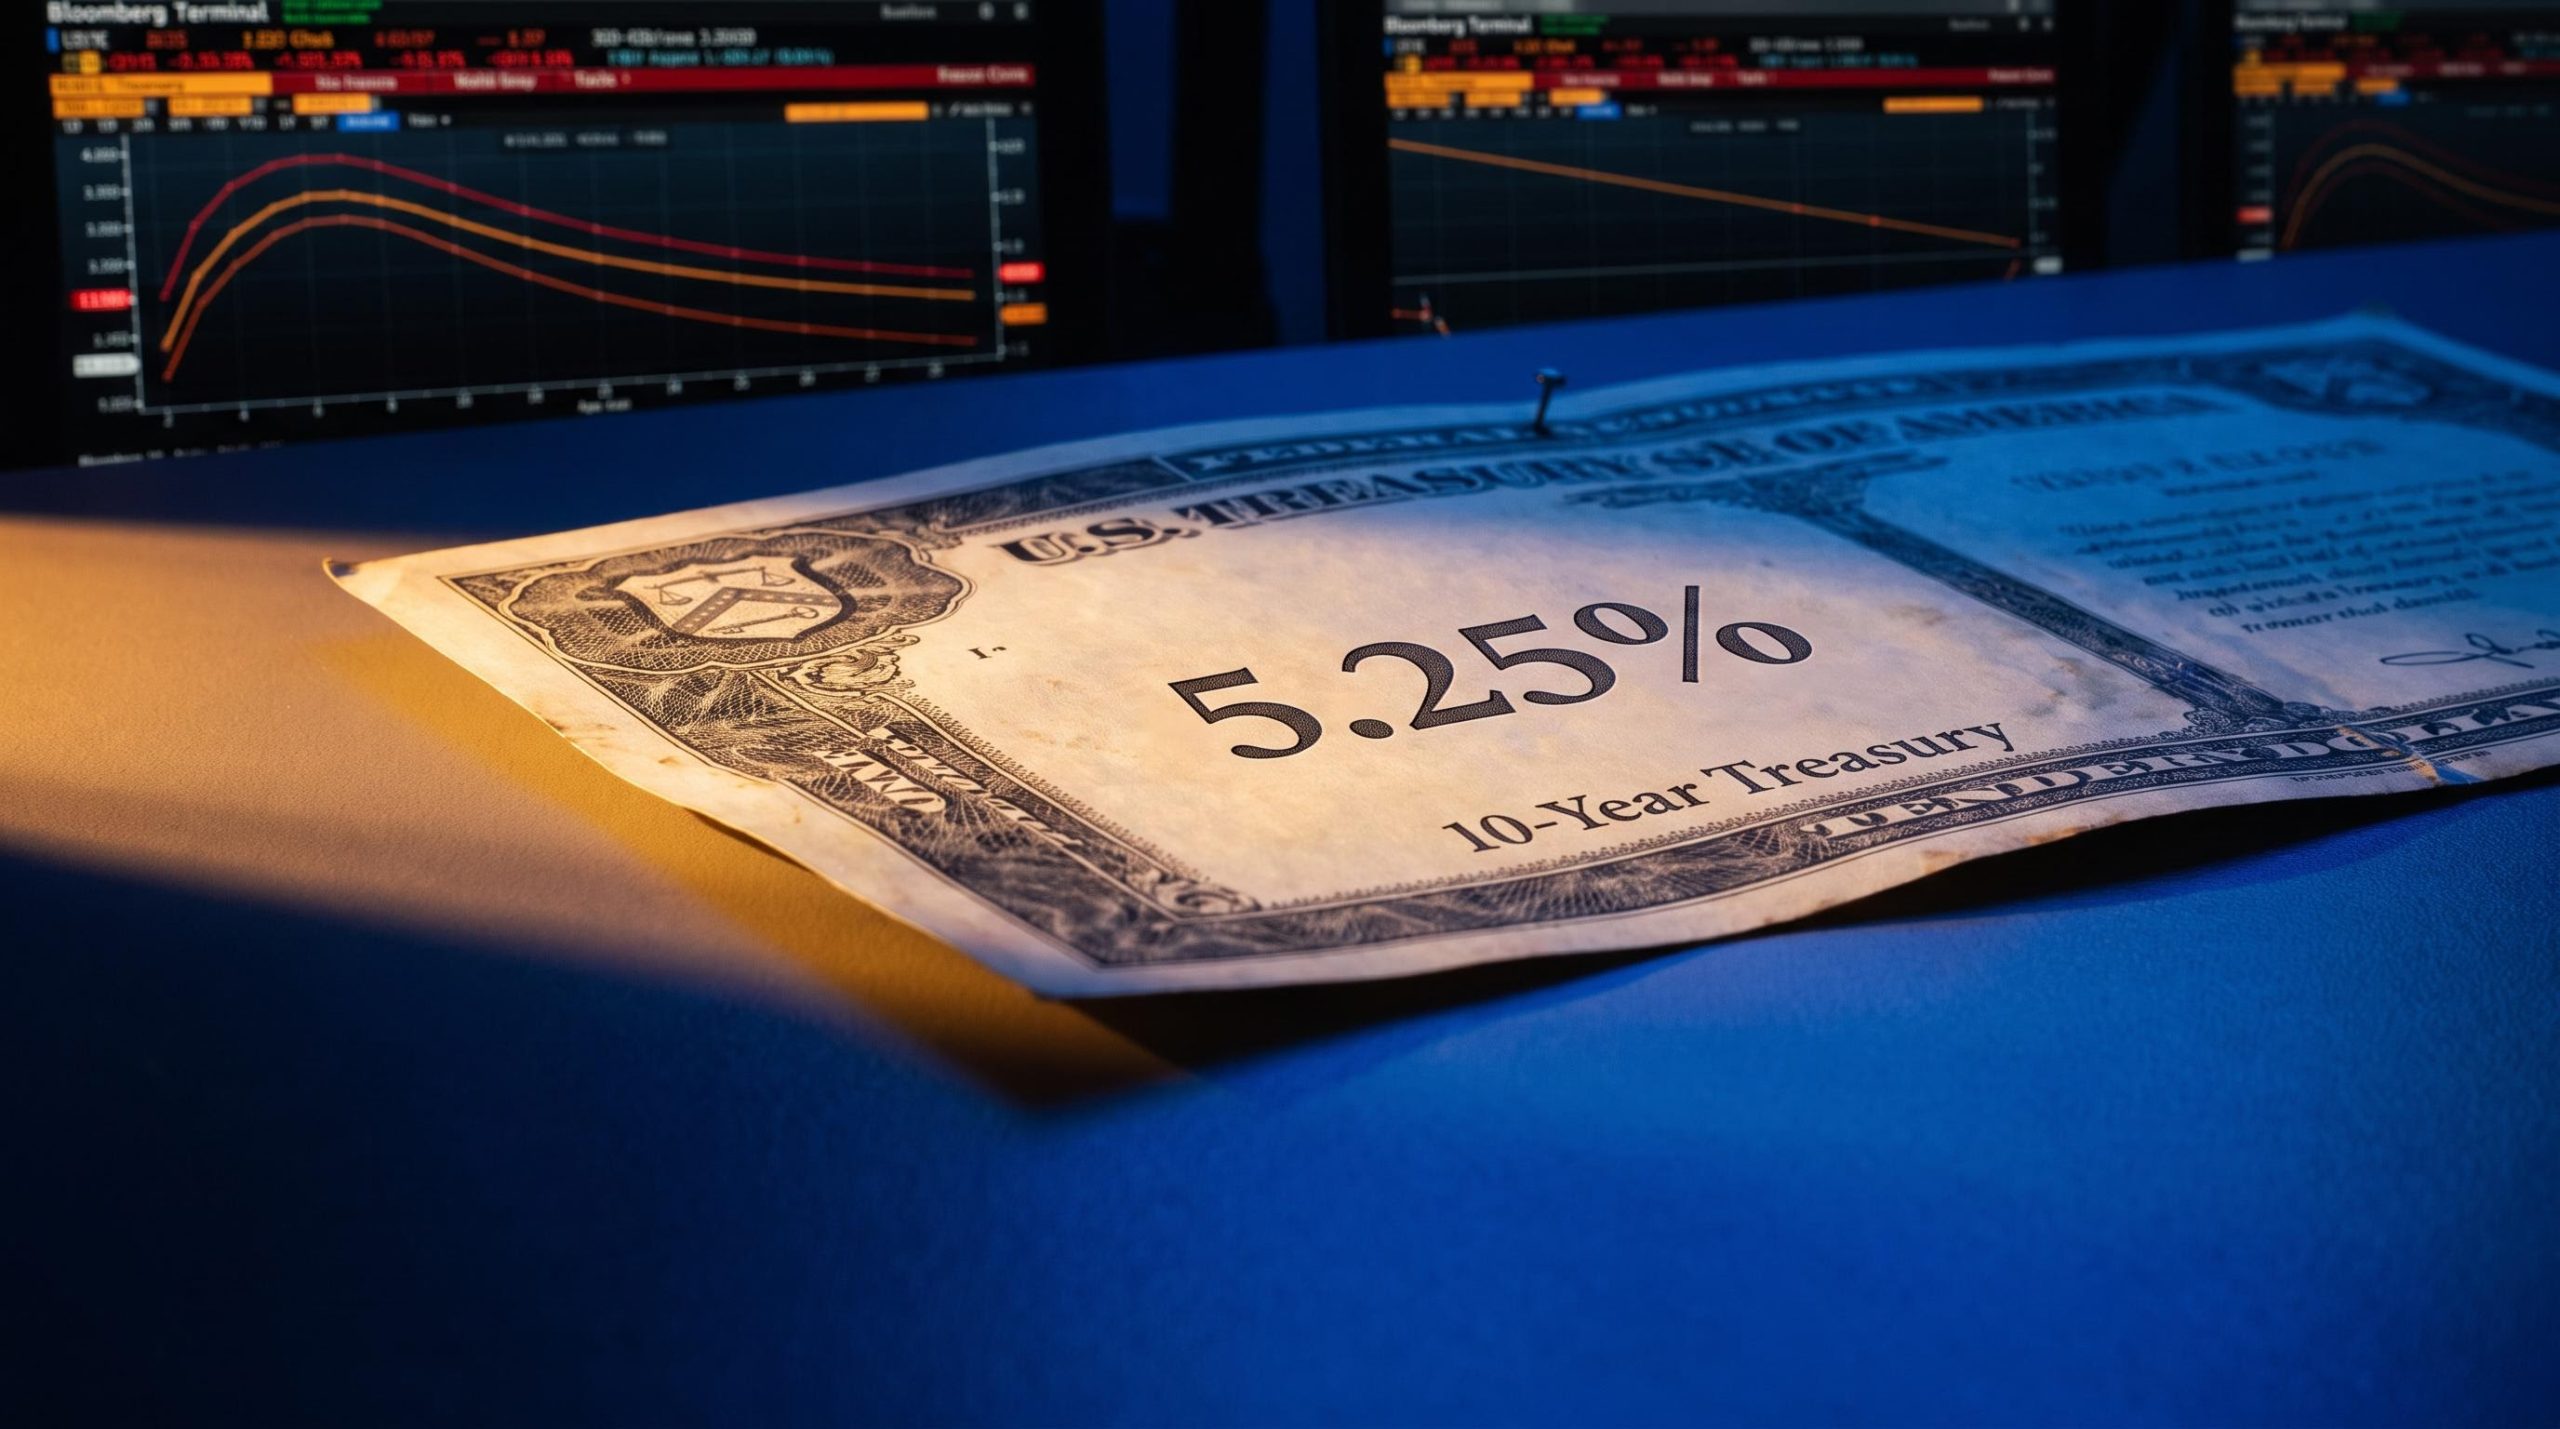
The 10-year Treasury yield sits at 5.25%, its highest level since July 2007. That single number is now the gating variable for every equity portfolio in the United States, and Goldman Sachs is telling clients the calm in stocks cannot hold without relief from the bond market.
What makes this moment distinctive is not the height of yields alone. It is that equity volatility has stayed subdued while volatility inside the rates market has surged, a decoupling that Goldman strategists describe as unstable by its very nature.
Add triple-digit oil to the picture, with Brent crude trading near $105-$106 per barrel after the U.S. rejected an Iranian ceasefire proposal, and the pressure on risk appetite becomes a dual squeeze rather than a single story.
This analysis gives you a structured way to understand why bond market conditions have become the primary constraint on equity gains right now, how Goldman Sachs is positioning around that view, and which specific variables signal whether the pressure is easing or getting worse.
Why the 10-year yield crossing 5% changes the calculus for equity investors
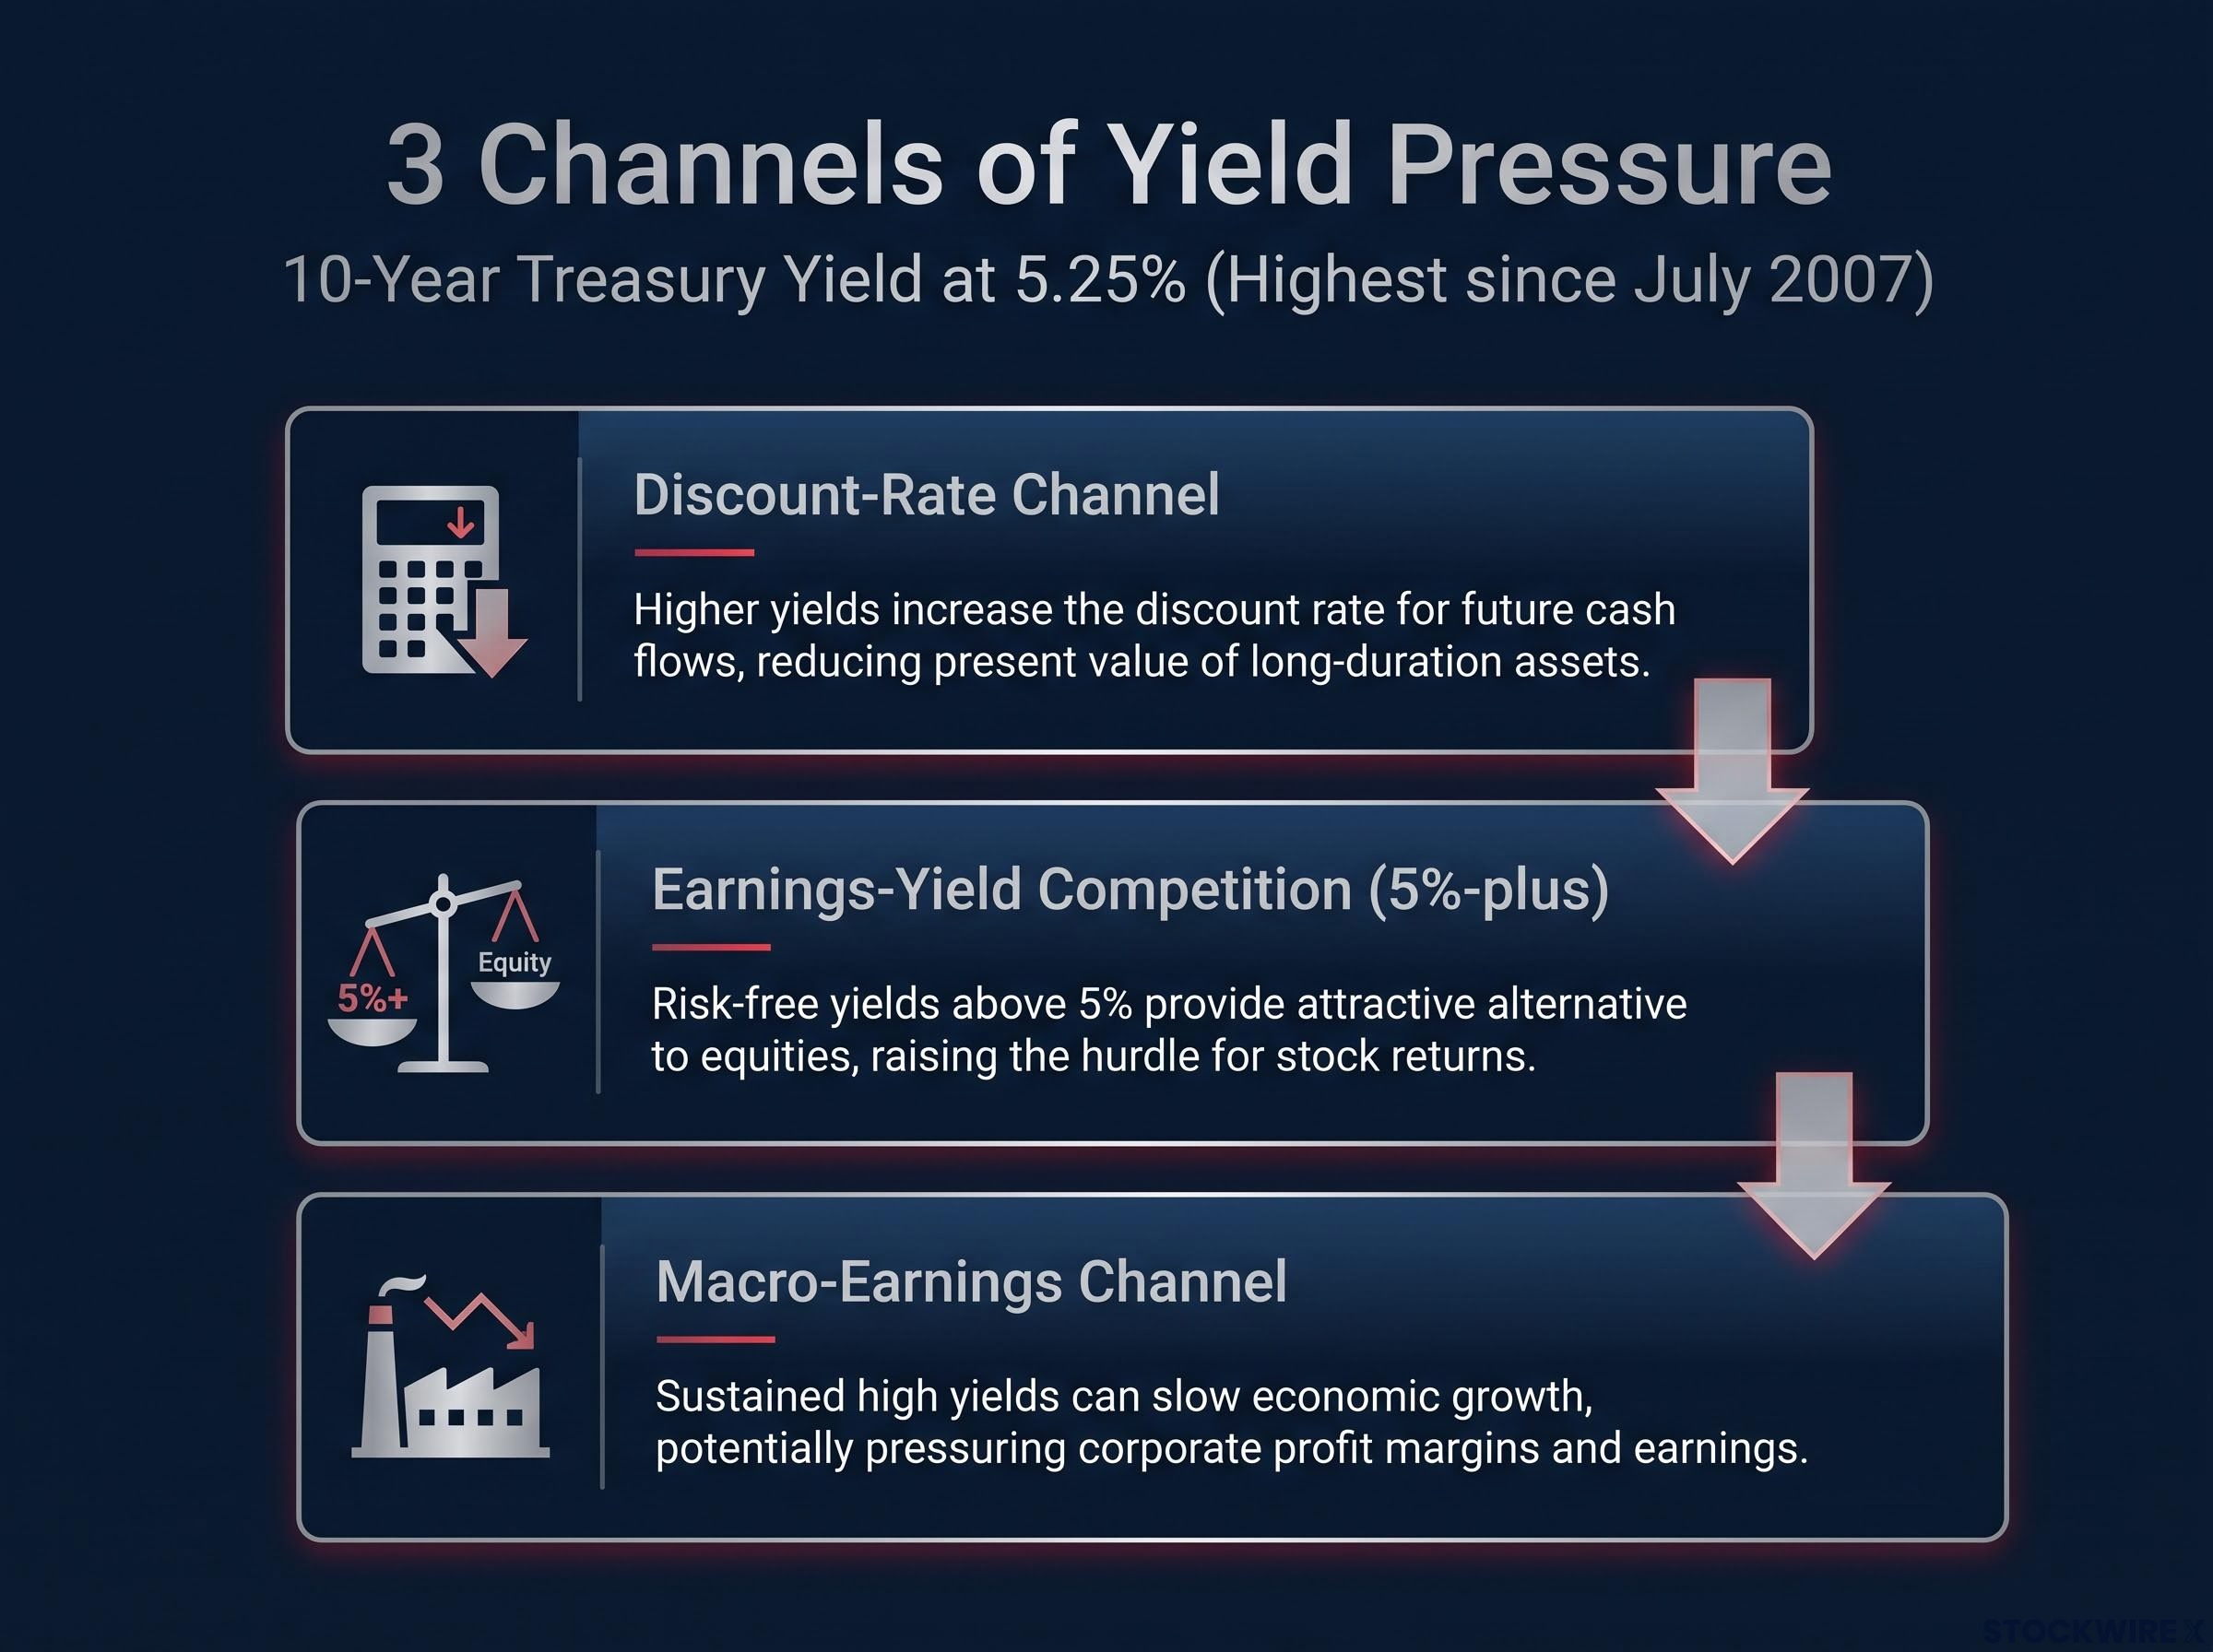
The pressure that high yields put on stocks is not one risk. It is three, and they compound. When the 10-year climbs to 5.25%, the effect moves through equity portfolios in a chain that tightens with each link.
The first channel is the most mechanical. Stocks are valued as the present value of expected future cash flows, and that calculation depends on a discount rate tied to the risk-free yield. When Treasury yields rise, the discount rate rises with them, and the present value of those future cash flows falls. That compresses price-to-earnings multiples automatically, before a single earnings report is filed.
The discount-rate channel is the most mechanical of the three transmission routes: as the 10-year climbs, the risk-free rate embedded in every equity valuation model rises with it, compressing price-to-earnings multiples automatically even when underlying earnings remain unchanged.
The second channel is competition. At 5% or more, government bonds offer returns that rival what investors expect from equities, without equity risk. The gap between the equity earnings yield and the bond yield narrows, and institutional money starts rotating out of stocks toward Treasuries to lock in the higher risk-free return.
The three transmission channels, in order of how quickly they bite:
- Discount-rate channel: Higher risk-free rates cut the present value of future cash flows, compressing valuation multiples.
- Earnings-yield competition channel: Treasuries at 5%-plus draw institutional money away from equities toward risk-free returns.
- Macro-earnings channel: Higher yields raise borrowing costs across the economy, eventually pressuring revenues and margins.
Reuters framed 5% as a traditional pain point for equity holders.
Reuters analysis characterised the 5% level on the 10-year as a “pain threshold” at which investors begin to question their equity allocations, warning that a yield above 5% “could ripple through the U.S. economy and threaten the bull market in stocks by denting the relative appeal of U.S. equities.”
Not everyone agrees the breach is decisive. Some strategists now argue the real stress point sits closer to 6%, as repeated exposure to 5% strips the level of its shock value. That debate matters, because it separates a level that markets can absorb from one that actively forces reallocation.
When higher yields become a macro headwind, not just a valuation story
The third channel is slower but arguably the most damaging. Higher Treasury yields feed directly into corporate refinancing costs and mortgage rates, tightening financial conditions across the real economy.
That transmission curbs corporate investment, slows housing activity, and eventually pressures the revenues and margins that anchor equity valuations. September 2026 commentary tied the yield surge to persistent inflation pressures and the prospect of further Federal Reserve hikes, a combination that raises the cost of doing business while demand softens.
Credit stress signals from the Federal Reserve’s July 2026 SLOOS and from distressed debt exchange data are already registering at the tighter end of their range since 2005, a dynamic that connects directly to the macro-earnings channel: tighter lending standards curb the corporate investment and consumer spending that ultimately anchors revenue growth.
For you, the practical read is this: even if the valuation channels prove manageable because earnings hold up, the macro channel can still bite through weaker demand and higher debt-servicing costs. Treating “rising rates” as a single monolithic threat misses where the real exposure in your portfolio actually sits.
When big ASX news breaks, our subscribers know first
How Goldman Sachs is reading the risk environment right now
Goldman’s positioning is not a scattered set of calls. It is a coherent response to a specific diagnosis: risk appetite has been declining since summer 2026, and the bond market is the reason.
Goldman Sachs analyst Christian Mueller-Glissmann, reporting via Investing.com on 29 September 2026, pointed to three forces dragging on the firm’s risk appetite gauge: a strengthening U.S. dollar, modestly widening credit spreads, and a sharp climb in real interest rates. The indicator held flat in the most recent week despite broader market pressure, but the trend since summer has been down.
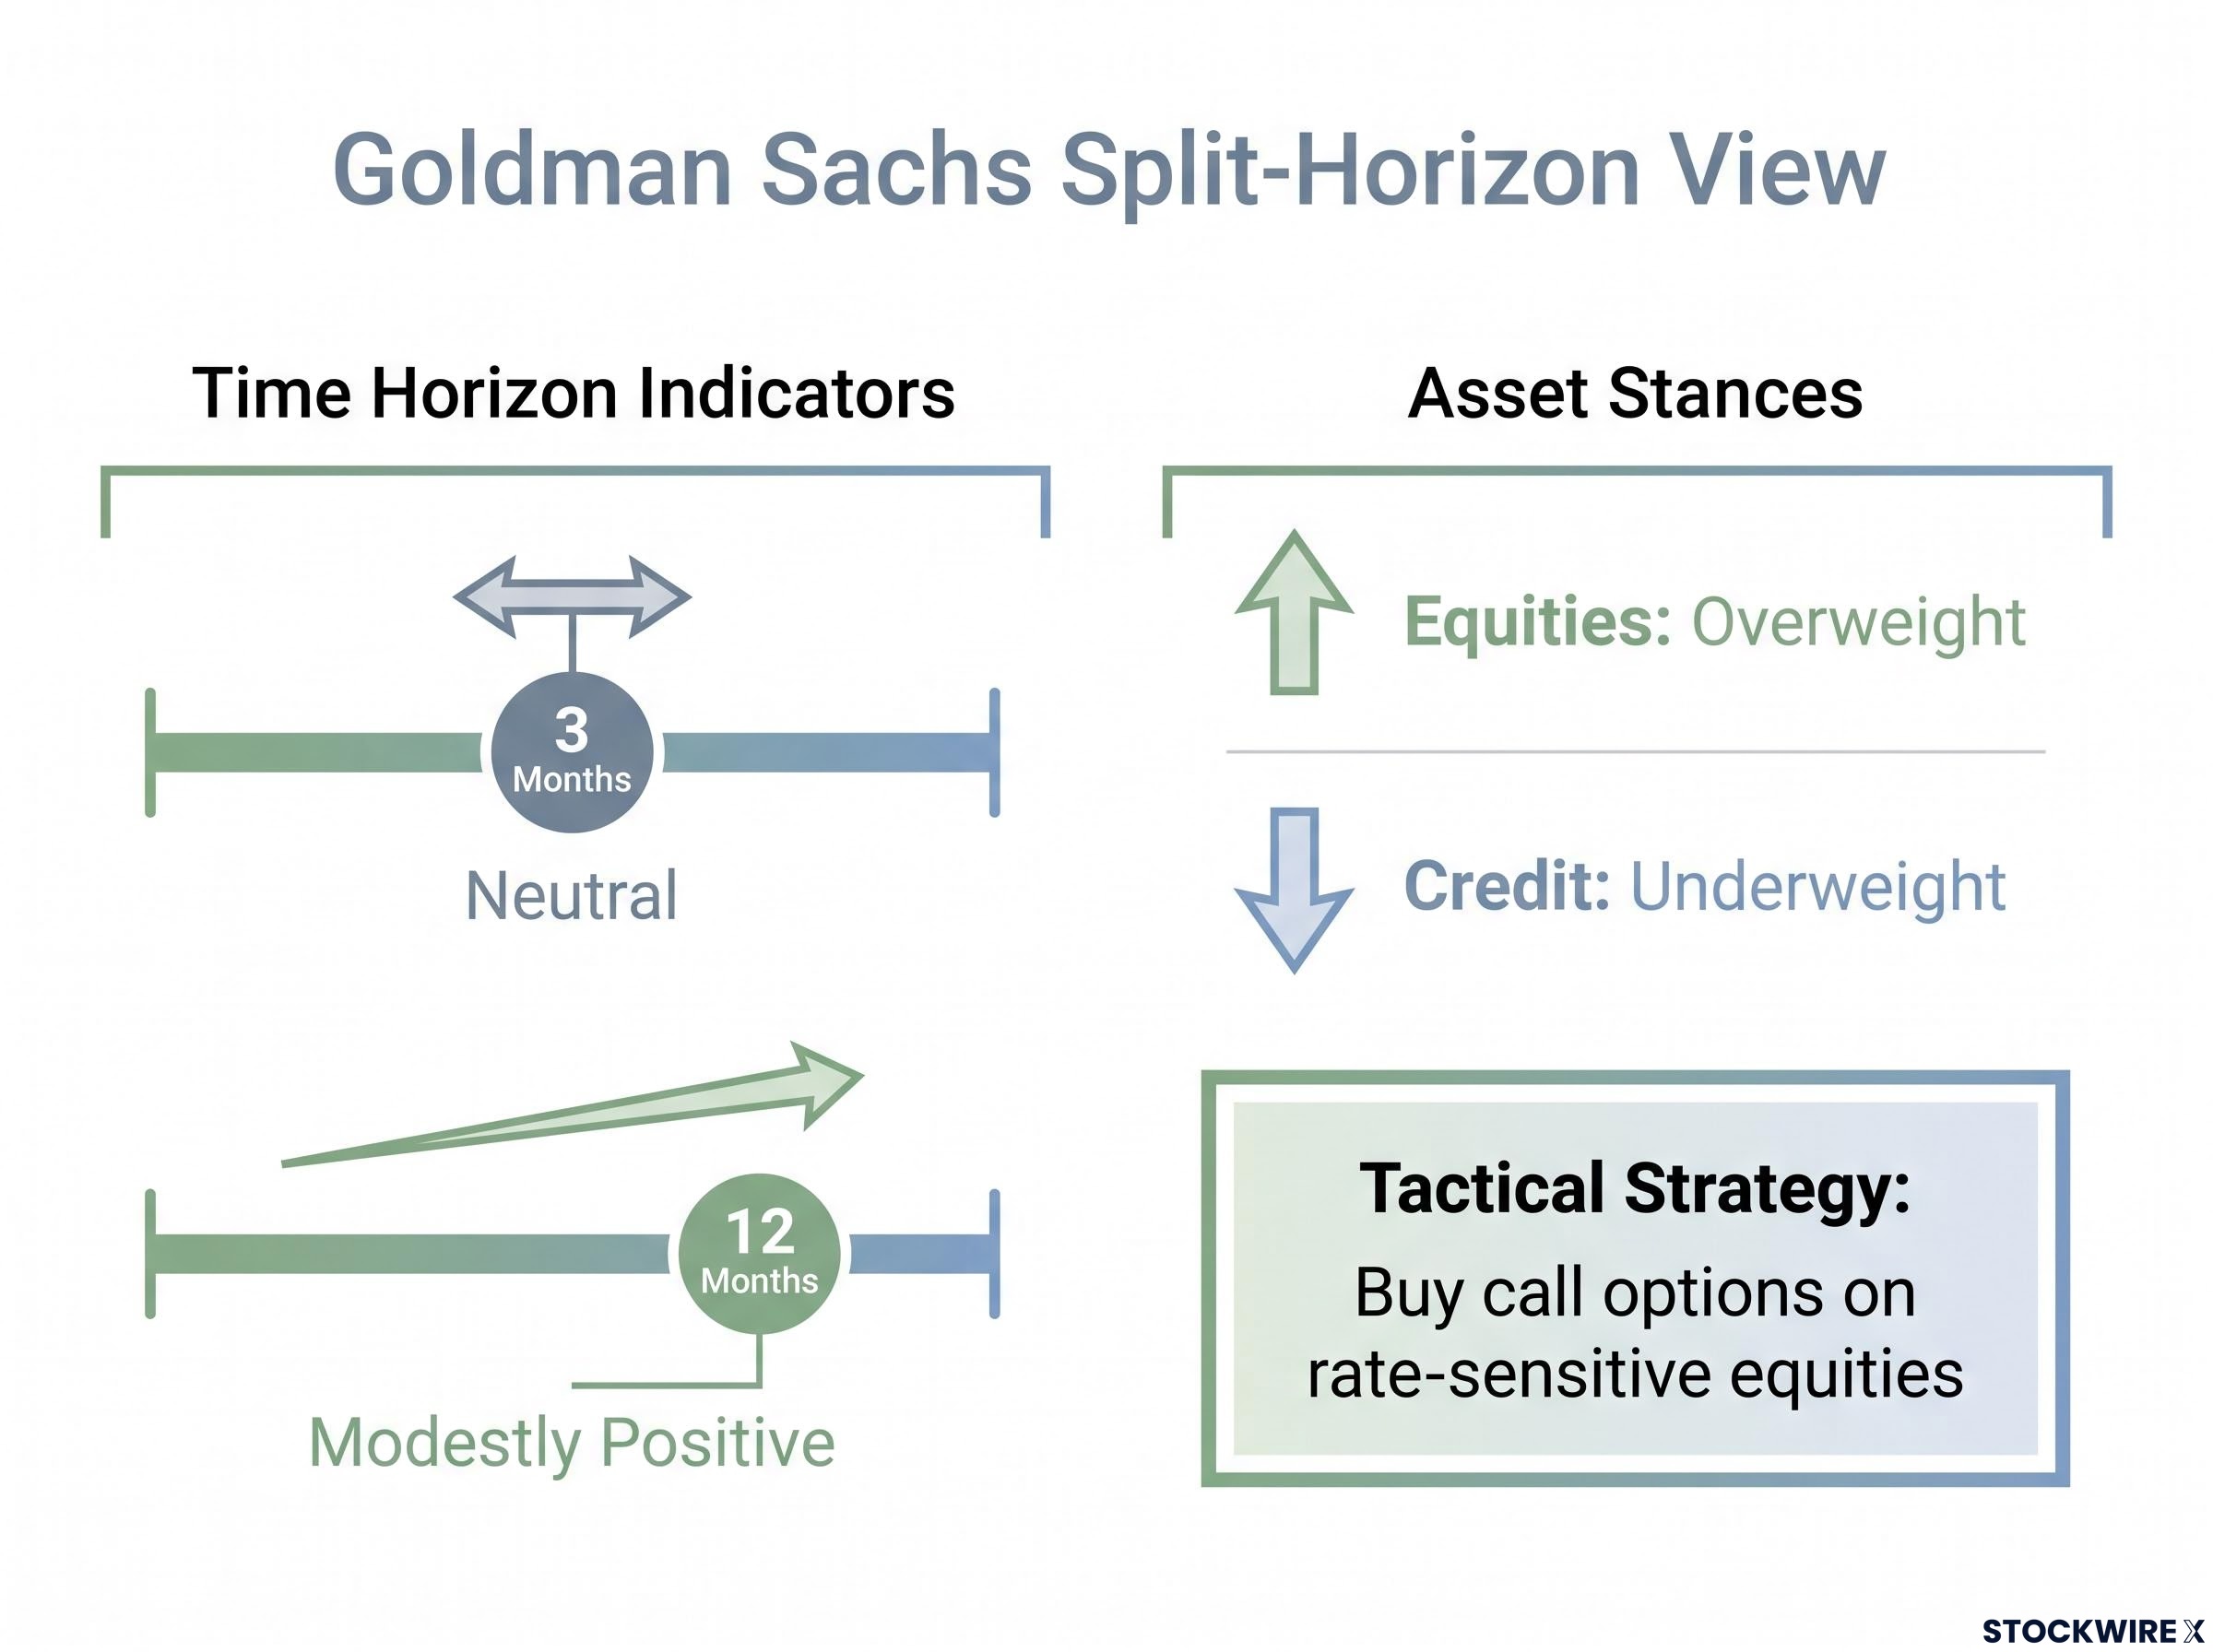
That diagnosis produces a split-horizon view. Goldman is neutral over the next three months but leans modestly positive over 12 months. The gap between those two stances is the whole story: the firm sees upside eventually, but not enough near-term conviction to reach for full exposure now.
Here is how that view translates into live positioning:
| Asset class | Stance | Rationale linked to the bond thesis |
|---|---|---|
| Equities | Overweight | Constructive over 12 months, positioned for gains if bond yields ease |
| Credit | Underweight | Widening credit spreads and elevated real rates make the risk-reward unattractive |
The tactical overlay is the tell. Rather than adding outright equity exposure at current levels, Goldman recommends buying call options on rate-sensitive equities, a way to profit from a potential decline in yields while capping downside if the pressure persists.
Goldman Sachs positioned a reduction in bond yields as the most direct route to further equity appreciation, according to Mueller-Glissmann via Investing.com.
The inflationary backdrop keeps that thesis in focus. Brent crude near $105-$106 per barrel, driven by the U.S. rejection of an Iranian seven-day ceasefire proposal, feeds the same inflation worry that keeps yields elevated.
What the call-options choice tells you is significant. Even a desk that is constructive on stocks over a year is buying optionality rather than committing capital outright. That is a clear signal about how thin near-term confidence has become, and a framework you can adapt to your own time horizon: express a constructive view while keeping downside defined.
The volatility divergence that strategists say cannot last
Here is the anomaly worth sitting with. Equity volatility has stayed calm while volatility inside the rates market has climbed sharply. Two asset classes tied to the same macro picture are behaving as if they disagree about how dangerous the environment is.
Goldman’s Mueller-Glissmann flagged this decoupling as unusual. The rates market, measured by indices such as the MOVE index (a gauge of expected volatility in Treasury prices), is churning because traders keep re-pricing the Federal Reserve’s path amid inflation and policy uncertainty. Equities, meanwhile, are anchored by earnings visibility, corporate buybacks, and steady institutional rebalancing, which dampens index swings even when yields lurch.
MOVE index dynamics have tracked the rates volatility surge closely, with the gauge posting its steepest weekly rise since the Liberation Day tariff shock of April 2025 even as the VIX remained anchored near historic lows, a divergence that structural forces such as dealer gamma positioning and 0DTE option flows help explain but do not make any less unstable.
In plain terms, macro uncertainty is high while micro fundamentals look stable. That combination can hold for a while, but strategists argue it is inherently temporary. Something has to give.
What to watch to know which path is playing out
The divergence resolves down one of two roads, and cross-asset teams give both roughly equal weight:
- Path 1, benign resolution: Inflation trends decisively lower, the Fed signals a more predictable rate corridor, and implied volatility in rates falls back toward historical norms. Rates volatility drops to meet subdued equity volatility, and the gap closes without a selloff.
- Path 2, disruptive resolution: Higher yields eventually bite into growth and profits through refinancing stress, weaker demand, or a credit accident. Equity volatility jumps to catch up with rates, typically via a correction or a forced policy pivot.
The catalysts that decide the outcome are specific and scheduled. Fed communication, meaning press conferences, dot plots, and FOMC minutes, sits at the top of the list, followed by CPI releases and labour market data. Each either validates the current rate path and calms volatility, or forces a re-pricing that spills into stocks.
The practical implication for you is uncomfortable but useful. The current calm in equity volatility is not evidence that stocks are strong. It is a borrowed condition that will resolve one way or the other, and the direction determines whether your portfolio’s next major move is up or down. Reading low volatility as a green light is exactly the mistake this setup punishes.
What history says about bond-driven equity headwinds, and why this time has a twist
The pattern repeats often enough to build a base case. Bond stress becomes the dominant drag on equities when yield moves are sharp, surprising, and driven by policy or inflation shocks. It resolves when central bank communication clears up and yields stabilise.
| Episode | Yield driver | Equity impact | Resolution catalyst |
|---|---|---|---|
| 1994 Bond Massacre | Rapid, surprise Fed hikes | Valuations and risk appetite hit | Clearer policy path, yields stabilised |
| 2013 Taper Tantrum | Fed signals QE taper | Global risk assets wobbled | Fed clarified gradual approach |
| Late 2018 rate scare | Hikes plus balance-sheet runoff | Sharp Q4 2018 selloff | Dovish Fed pivot in early 2019 |
| 2022-2023 rate shock | Inflation-driven fast hikes | Historic drawdown in stocks and bonds | Inflation rolled over, rate peak priced |
The common thread across all four is the resolution: clearer central bank messaging, a perceived ceiling on policy rates, and stabilising yields and credit spreads. Once those arrive, equity investors refocus on earnings rather than discount-rate shocks. Notably, in 2022-2023 stocks recovered before rate cuts actually landed, as soon as markets priced a policy peak.
There is a genuine counter-argument, though, and it is what gives this cycle its twist. When higher yields reflect strong real growth rather than pure inflation, equities can advance despite valuation compression. Commentators in 2026 noted that part of the yield rise is being fuelled by buoyant U.S. growth and debt-financed corporate AI capital expenditure, supporting yields from the demand side rather than the inflation side.
Post-QE yield normalisation provides important historical context for the counter-argument: bid-to-cover ratios at or above ten-year averages across major sovereign debt markets as of mid-2026 contradict the narrative of institutional abandonment, suggesting the current 5%-plus level may represent a reversion to pre-financial-crisis norms rather than a structural break.
That distinction matters because the key variable is trajectory, not level. Reuters observed that 5% yields are beginning to “lose their shock value” as investors adjust, which suggests markets can adapt to a sustained high level once it stops surprising them.
Sector positioning is where this plays out in practice:
- Rate beneficiaries: value stocks, financials, and energy producers, which can benefit from higher rates and inflation.
- Most exposed: long-duration growth names and heavily indebted companies, whose valuations and refinancing costs are most sensitive to yields.
The read for you is that the moment to be most defensive is when yield moves are still accelerating and surprising, not necessarily once a high level has settled in. A yield that is high but stable lets you refocus on earnings, which is precisely when sector differentiation starts to matter more than blanket macro defence.
What the bond pressure clears, and what it does not
Goldman’s central thesis comes down to one conditional statement: easing in the bond market is the primary prerequisite for sustained equity gains. That is a demanding condition, but it is not a catastrophic one.
The dual-horizon stance proves the point. Goldman is neutral over three months and modestly positive over 12, expressed live through an overweight on equities and an underweight on credit. The firm is not withdrawing from stocks. The call-options overlay acknowledges genuine upside while managing near-term downside, which is a watch-and-position posture, not a risk-off retreat.
The amplifying factor to keep in view is the climb in real interest rates, which magnifies the drag from a stronger dollar and wider credit spreads. And this is not purely a Treasury story: European sovereign bonds have underperformed U.S. counterparts under energy supply and fiscal pressures, a reminder that the bond stress is global.
Your monitoring framework comes down to a short list of indicators:
- 10-year yield trajectory: whether the move is stabilising or still accelerating.
- Fed communication calendar: dot plots, press conferences, and FOMC minutes.
- CPI releases: the inflation trend that governs the rate path.
- Credit spreads: widening signals stress, narrowing signals relief.
- Equity volatility indices: a jump here would mark Path 2 arriving.
Goldman’s 12-month positive lean tells you this is a situation to watch and position for, not one to flee. The outcome genuinely depends on data not yet released, and investors who understand these variables are the ones best placed to move decisively when the numbers turn.
This article is for informational purposes only and should not be considered financial advice. Investors should conduct their own research and consult with financial professionals before making investment decisions.
Past performance does not guarantee future results, and the forward-looking positioning described here is subject to market conditions and various risk factors.