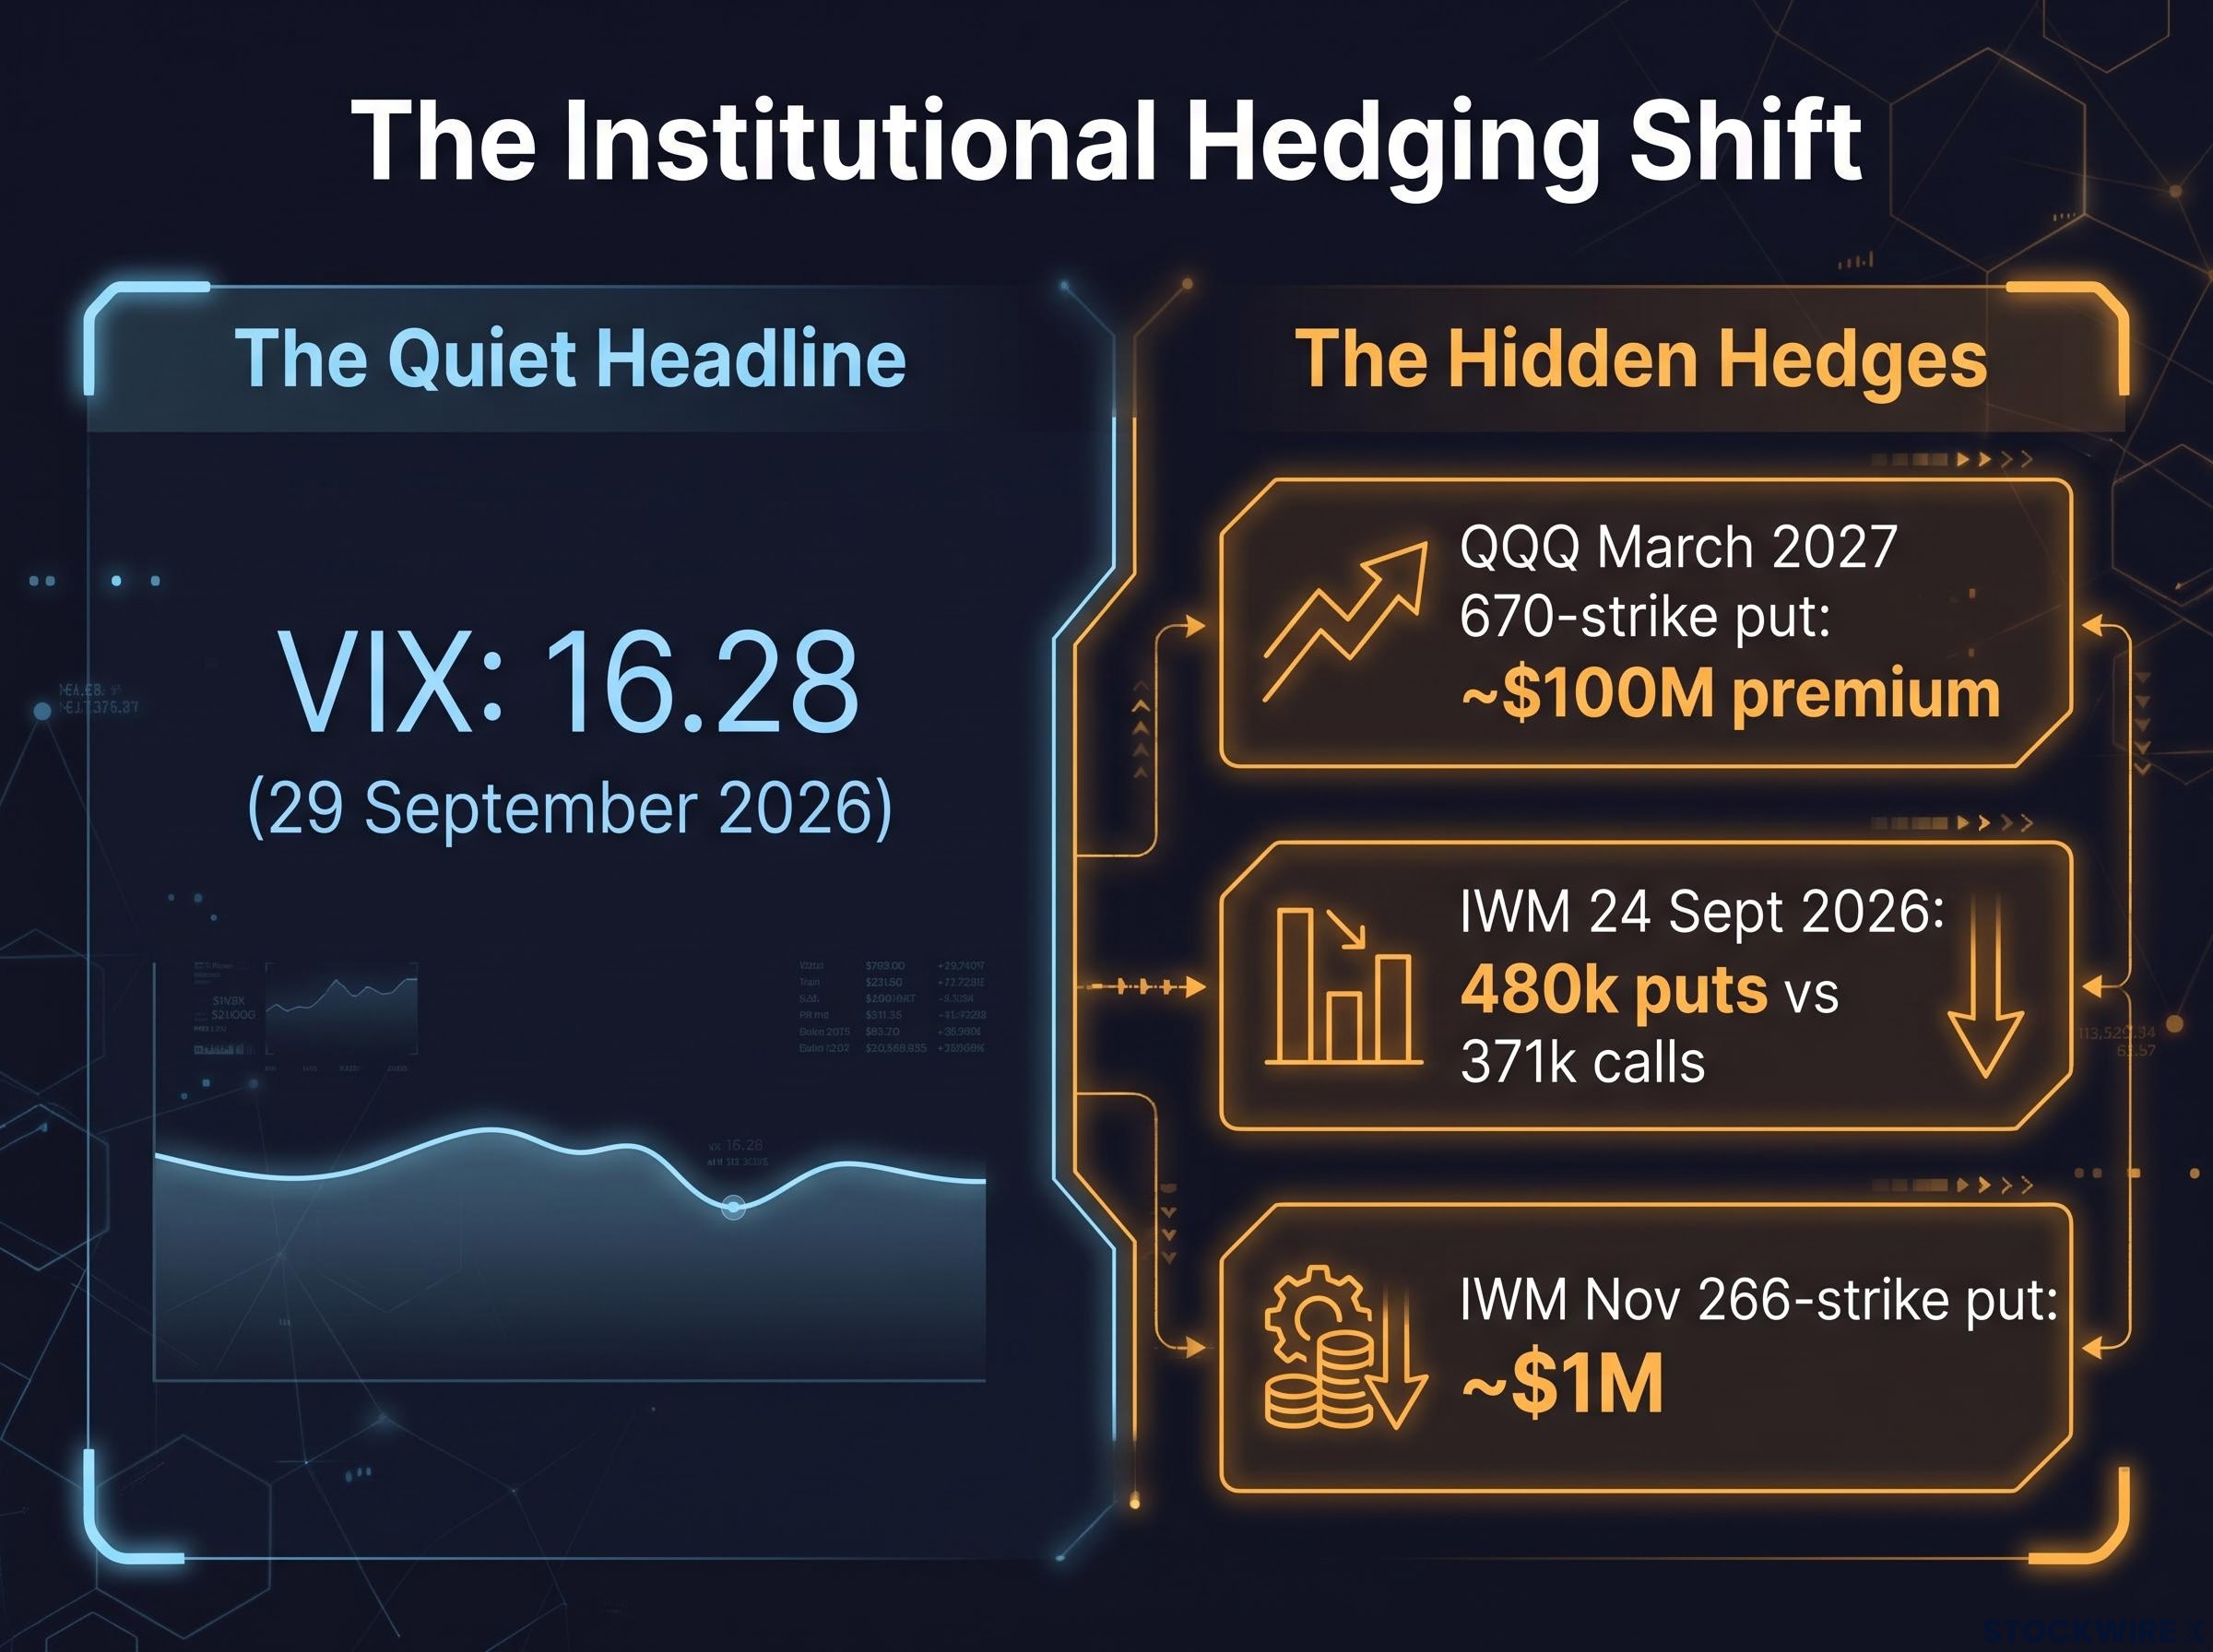
The VIX is sitting at 16.28 as of 29 September 2026. Weekly options on the S&P 500 are pricing daily moves of roughly 1%, and realised volatility has been running in the high single digits. On the surface, everything looks calm.
Underneath the surface, someone just committed about $100 million to NASDAQ puts expiring in March 2027.
That gap between the quiet headline number and what large institutions are actually doing with their money is the story here. From late 2025 into mid-2026, the dominant pattern at the index level was aggressive put-selling and almost no appetite for hedging. That pattern now appears to be reversing in the QQQ and the Russell 2000, and the way that reversal works has consequences that reach well beyond the firms placing the trades.
Here is what this shift in institutional downside protection tells you about how the next serious market decline could unfold differently from the gentle pullbacks of recent months, and the specific signals in the options market worth watching before it does.
What the big put trades are actually telling you
Start with the trade that stands out. According to SpotGamma’s flow database, a firm spent approximately $100 million in premium buying QQQ March 670-strike put options, flagged as a new opening position rather than an adjustment to something existing.
Two features make this read as a deliberate hedge rather than a quick speculative punt. The size is institutional, and the expiry stretches into March 2027, months away. Short-term speculators do not typically buy protection that far out. Buyside firms hedging a book do.
One large order on its own is noise. The pattern around it is the signal.
| Instrument | Trade | Premium | Timeframe | Source |
|---|---|---|---|---|
| QQQ 670-strike put | New opening long, buyside | ~$100M | March 2027 expiry | SpotGamma |
| IWM (session aggregate) | 480k puts vs 371k calls | ~$100M to puts | 24 September 2026 | PrimeXBT / Cboe LiveVol |
| IWM 266-strike put | Smaller opening position | ~$1M | November expiry | SpotGamma |
Why IWM is absorbing the heaviest hedging demand
The small-cap Russell 2000 ETF has become the main vehicle for this hedging wave. On 24 September 2026, PrimeXBT data drawn from Cboe LiveVol showed traders likely bought 480,000 IWM puts versus 371,000 calls, pushing total open put interest to just under 7 million contracts.
Of roughly $322 million in IWM premium traded that day, SpotGamma analytics attribute about $100 million to put buying and $50 million to calls. A separate, smaller IWM November 266-strike put worth around $1 million was flagged as another example of the same theme.
The rationale is rate sensitivity. Small-cap companies carry more floating-rate debt and lean harder on access to credit markets, so when bond yields spike and funding conditions tighten, they feel it first. PrimeXBT tied the surge in IWM put demand directly to a bond liquidation hitting small caps that session.
Between 30% and 38% of Russell 2000 constituent debt carries a floating-rate structure compared to roughly 7% for the S&P 500, which means IWM put buyers are hedging a specific earnings-erosion channel that plays out over a 12-24 month horizon as existing debt refinances at today’s higher coupons.
Here is what makes this different from ordinary put activity. Index-level put buying hedges systemic risk; single-stock put buying hedges one company. SpotGamma notes that in major large-cap technology names, traders are still net sellers of puts, not buyers. When professionals concentrate their protection in small-cap and NASDAQ index puts rather than SPY or individual stocks, it tells you they are bracing for a broad rate-driven or valuation-driven shock, not trouble at a single firm.
When big ASX news breaks, our subscribers know first
How volatility and skew data reveal what the market is quietly pricing in
Read the volatility surface at face value and it says relax. The VIX has been camped in the mid-teens. Realised volatility, meaning how much the market has actually moved, has been running lower still.
Look closer and a more interesting picture emerges. Implied volatility, which is what options prices predict, has been sitting modestly above realised volatility. Hedges are not cheap, but they are not punishingly expensive either.
| Date | VIX | Realised vol (20-day) | Implied-realised spread |
|---|---|---|---|
| 25 September 2026 | 15.67 | 10.66% | ~5 points |
| 18 September 2026 | 15.44 | 9.6% | ~6 points |
| 24 August 2026 | 17.5 | 1-month spread | 3.4% (80th pct) |
The Saxo Bank Options Brief series through September captured this steady spread of around 5-6 points, describing the backdrop as a low-volatility regime where equity vol stayed cheap even as bond yields jumped.
The variable the headline VIX misses entirely is skew. Skew measures how much more expensive downside puts are than upside calls, and it tells you how badly the market wants crash protection. According to SpotGamma, NASDAQ put-wing pricing has been near the lower end of its 90-day range.
That is the crux. Cheap skew means large institutions can buy substantial downside protection at historically reasonable cost.
The regime has been shifting. Eurex’s August 2026 recap noted skew “continued to flatten” during the equity rally, with rising stock prices pushing the cost of protection down further. Then, in its 25 August 2026 Insight, Cboe documented the turn: SPX options started pricing more downside risk, with skew steepening as fear of missing out gave way to caution and hedging demand returned.
Susquehanna described the earlier volatility reset as “substantial,” but cautioned that cross-asset and geopolitical risks remained active, with two-month implied volatility only reverting toward pre-Iran-war levels. (CNBC, 17 August 2026)
Put the two pieces together and you get a specific, telling combination. Skew is cheap and institutional put demand is rising. That tells you professionals are adding protection precisely when it costs the least, and before the broader market has started paying attention. Relying on the single VIX number alone would leave you blind to it.
The mechanics of how index put buying can accelerate a selloff
To see why this matters, put yourself in the position of the dealer on the other side of these trades. When a buyside firm buys index puts, a liquidity provider usually ends up short those same puts.
A short-put position is short delta and short gamma. In plain terms, the dealer loses money as the index falls, and the losses get worse at an accelerating rate the further it drops. To stay balanced, the dealer sells futures or ETF shares as the market declines.
Dealer gamma hedging creates a mechanical bid under index prices during calm regimes, with roughly $80 billion in gross SPX gamma from structured product issuance pinning the index and suppressing implied volatility even as individual stocks experience wide daily swings.
That is where the feedback loop begins.
- A large firm buys index puts, and dealers end up short those puts.
- The index starts to fall.
- Dealers sell more underlying futures or ETFs to stay hedged against their growing negative exposure.
- That extra selling deepens the decline.
- Realised volatility rises, dragging implied volatility up with it, which increases the deltas on the puts.
- Higher deltas force dealers to sell still more, and the loop tightens on itself.
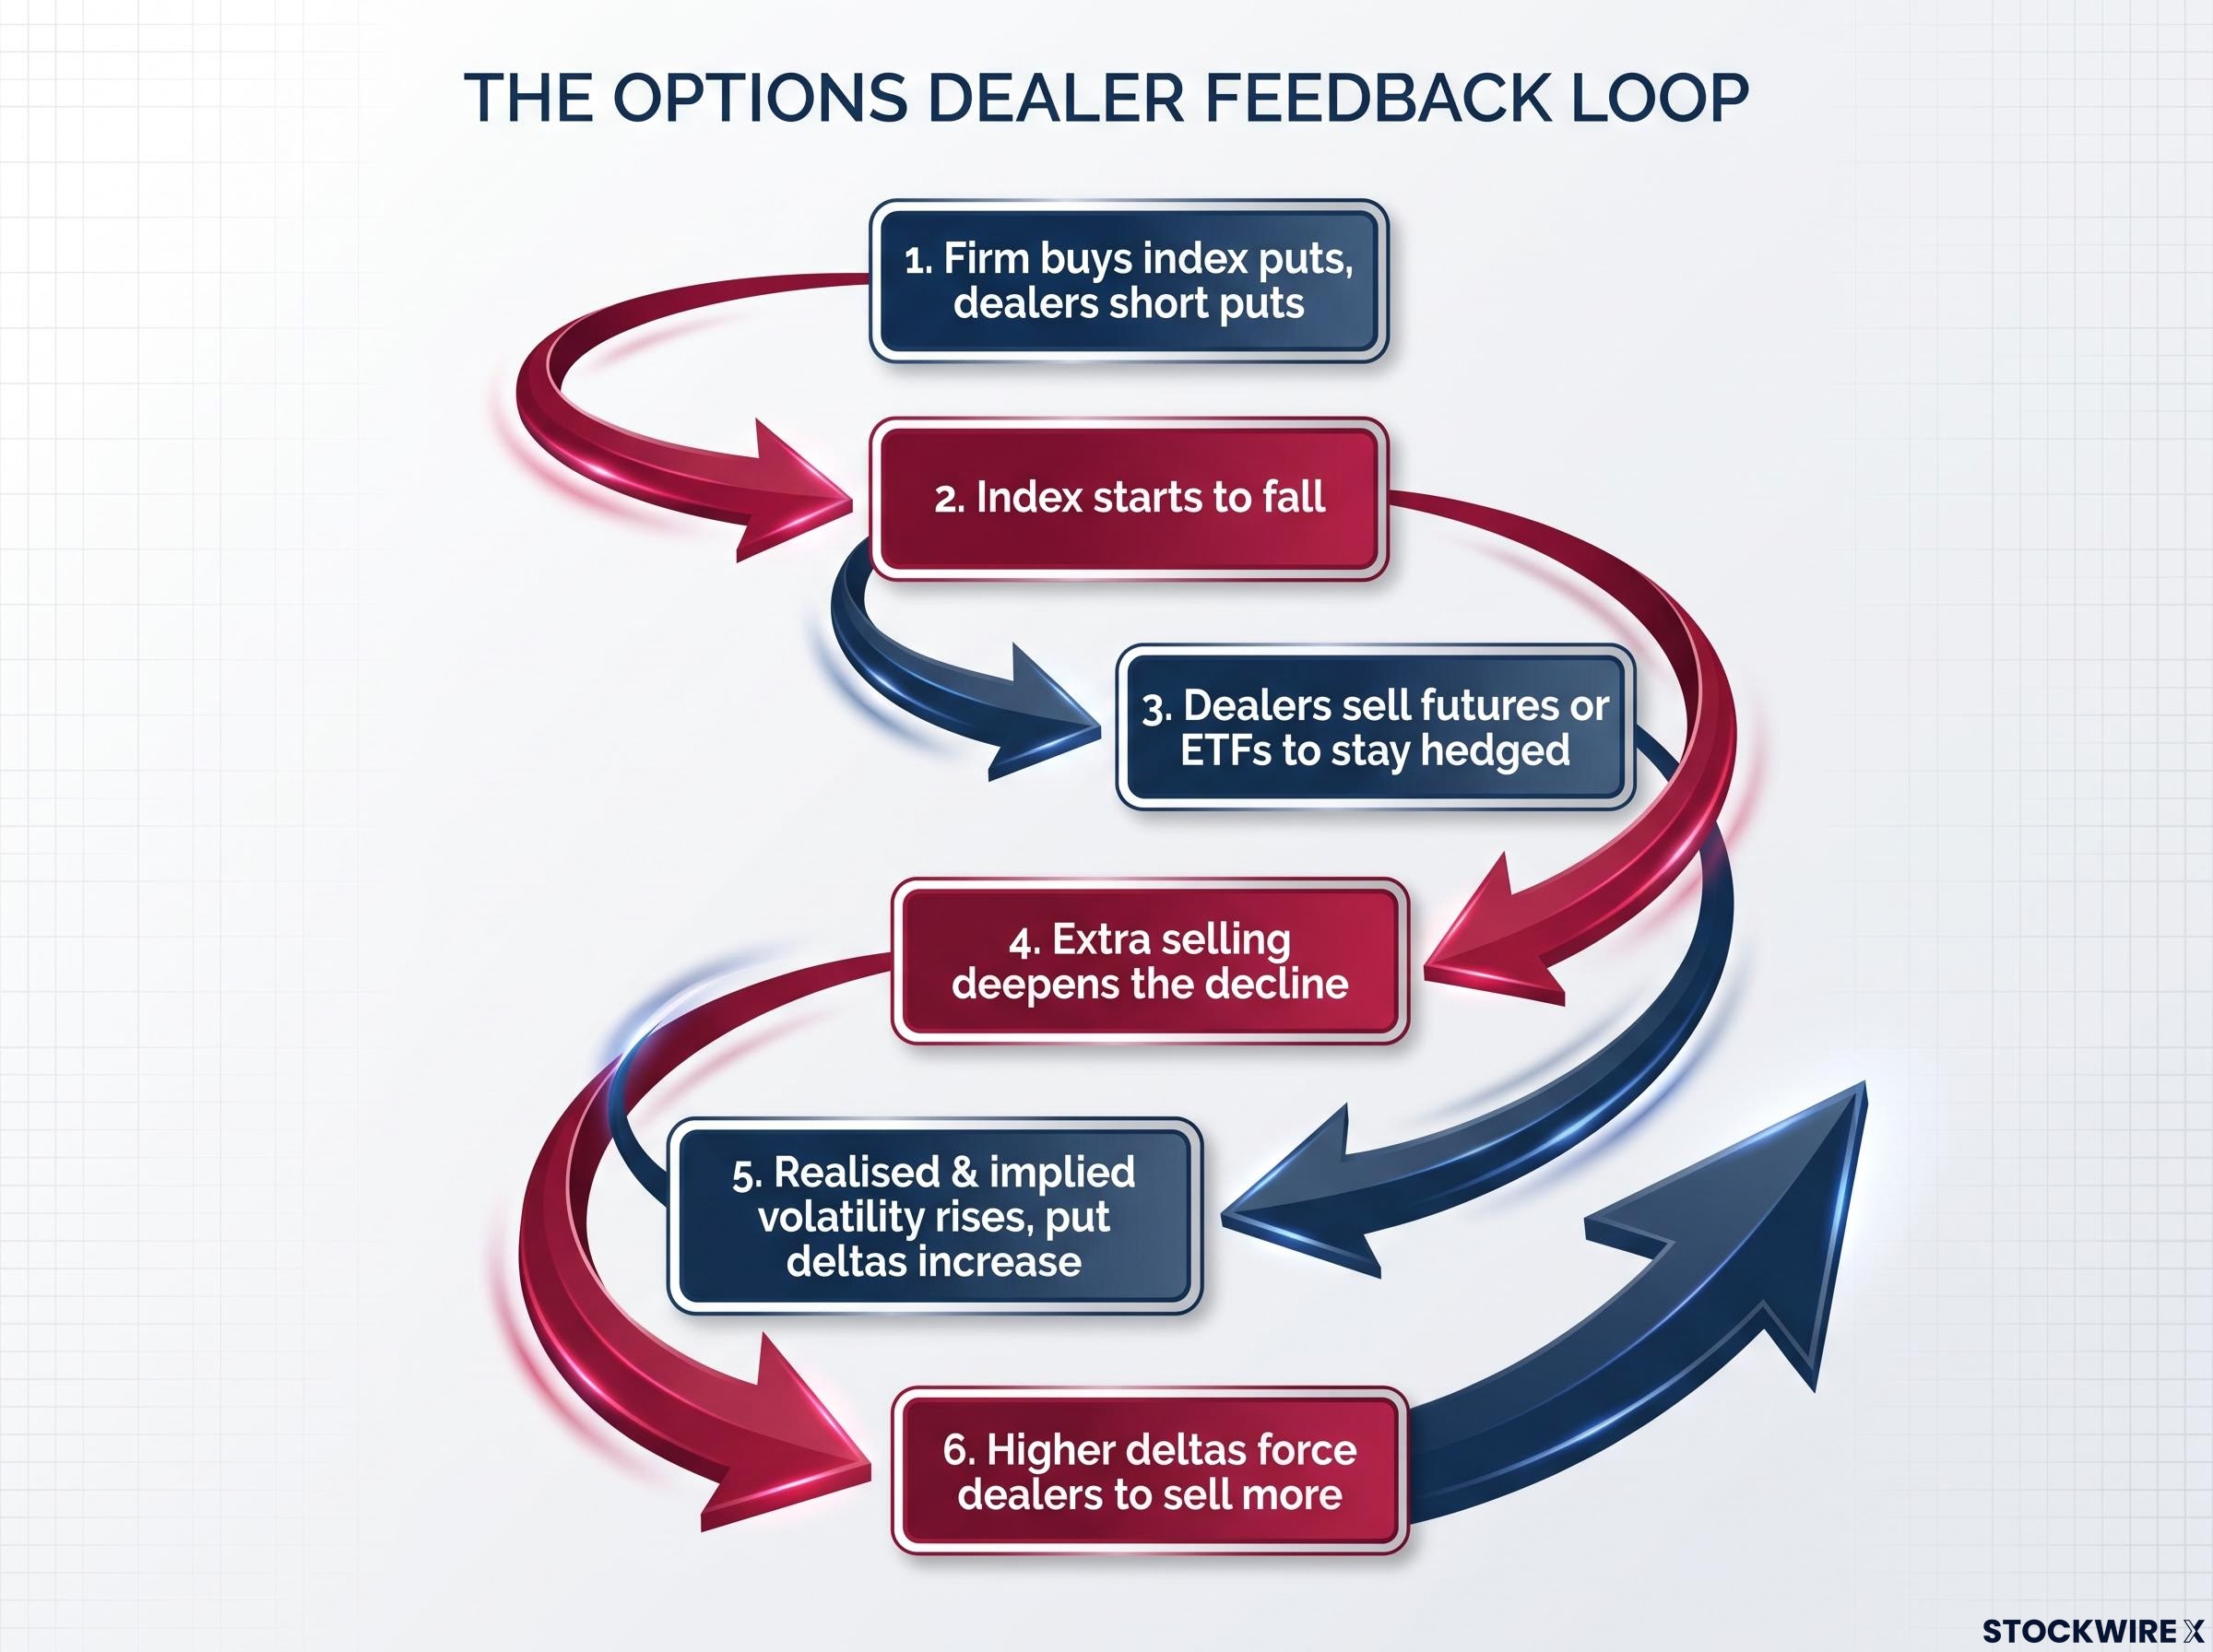
SpotGamma and Tasty Trade describe exactly this dynamic: when index put buying increases and dealers accumulate short stock or short futures hedges, a downward move in equity prices can accelerate more rapidly. Cboe’s 25 August 2026 Insight offered supporting evidence, documenting two volatility events only four months apart in which VIX spikes outsized the underlying SPX sell-offs, spot-vol beta surged, and realised volatility ran higher on down days than up days.
Dealer delta-neutral hedging research published in late 2025 developed a theoretical framework linking micro-level option hedging to macro-level volatility amplification, modelling the self-reinforcing dynamics that emerge when market-makers accumulate short gamma exposure and are forced to sell underlying assets into declining markets.
Here is the takeaway. The move from single-stock put-selling to index-level put-buying is not merely a positioning change. It is a structural change in how the options market will behave mechanically during the next serious selloff, and that alters the risk calculus even for investors who never touch an option.
Why this does not automatically predict a crash
The picture is not one-directional, and it is worth being honest about the caveats.
The net effect depends on the full dealer book, not one flow in isolation. If dealers are net long gamma, often because of heavy retail put-selling or call-selling programmes, their hedging works the opposite way, buying dips and selling rallies to stabilise the market. SpotGamma notes that persistent single-stock put selling has kept dealer flows oriented toward buying dips in major individual names, which is a stabilising force.
Options flow is also only part of the machinery. Volatility-targeting funds, trend-following CTAs, and risk-parity strategies can amplify or dampen a selloff on their own, regardless of what dealers are doing.
There is also a genuine gap in the research. No sources document historical episodes where the shift from put-selling to put-buying reliably preceded a specific dislocation. Treat this as a directional indicator worth monitoring, then, not a precise timing signal.
What the low-volatility surface may be obscuring about real downside risk
Most investors treat a low VIX as an all-clear. It is worth taking that assumption apart, because it rests on a misunderstanding of what the number actually measures.
What the VIX does and does not measure
According to a Cboe explainer from 22 July 2026, the VIX is a forward-looking measure of expected volatility over the next 30 days, derived from live S&P 500 option prices. It is not a backward-looking read of what the market has already done.
That 30-day window is where the interpretive danger lives. A low VIX does not mean markets have been calm; it means options traders expect modest swings over the coming month.
Two legitimate readings of the current level exist side by side. The justified-calm reading says realised volatility has genuinely been subdued, so a VIX near 16 is not irrationally low. EBC’s 17 August 2026 analysis captured this, with the VIX at 14.25 sitting barely a point above 30-day realised volatility of 13.3%.
Approximately $1.5 trillion in short-volatility exposure from systematic strategies and structured product issuers is mechanically suppressing the headline VIX reading, meaning the number reflects manufactured calm rather than genuinely reduced risk in the underlying market.
The under-hedging reading tells a different story. Real Investment Advice reported that on 9 July 2026, 20-day realised volatility nearly doubled from under 9% to the mid-teens while the VIX sat at 17 and briefly printed below realised volatility, a rare inversion outside stress periods. Northern Trust’s Q4 2025 commentary is the sharpest example: the S&P 500 finished 2025 with realised volatility at an 80th-percentile 18.6% even as the VIX closed at 14.95, down 43% from its November 2025 peak.
The signals worth monitoring as institutional hedging demand builds
The reason institutions buy longer-dated index puts is that they are hedging risks the VIX cannot see. A 30-day gauge says nothing about threats that sit further out on the calendar.
Those threats fall into categories the headline number was never built to capture:
- AI and technology valuation instability, with Northern Trust citing conflicting AI narratives as a reason volatility may stay structurally elevated
- Geopolitical shocks, along the lines of the Iran-war episode that Susquehanna flagged as still live
- Rate-driven credit stress in small caps, the exact risk the IWM put buying is designed to hedge
- US political uncertainty, cited by Northern Trust as a supportive backdrop for continued volatility
Northern Trust’s Q4 2025 commentary argued that conflicting AI narratives and US political uncertainty create a supportive backdrop for continued volatility into 2026, a direct counterpoint to the surface calm.
If you want early warning, a handful of public inputs are worth tracking: NASDAQ and Russell 2000 put/call volume ratios, skew levels relative to their 90-day ranges, the implied-realised spread, and large opening put positions flagged by options flow tools. Treat these as early-warning inputs, not trading triggers.
The combination is the point. A VIX near 16 running modestly above realised volatility is not a red flag by itself. But when institutions are simultaneously buying months-long index puts at cheap skew, the pairing suggests professionals see tail risks a 30-day measure was never designed to detect.
This article is for informational purposes only and should not be considered financial advice. Investors should conduct their own research and consult with financial professionals before making investment decisions.
What this shift means before the next volatility event arrives
Pull the three threads together and a coherent mental model emerges.
- The signal: index-level put buying in QQQ and IWM, concentrated where systemic rate and valuation risk sits
- The mechanism: dealer hedging dynamics that can accelerate a decline once it begins
- The context: cheap skew and a VIX that simply does not capture multi-month tail risk
For your own portfolio, the practical implication is not to trade on any of this. It is to recalibrate how quickly a moderate decline could turn into a sharper one, and why the next pullback might not behave like the gentle dips of 2025 and mid-2026.
Cboe’s documentation of two volatility events only four months apart, in which VIX spikes outsized the underlying sell-offs and realised volatility ran higher on down days than up days, suggests the market’s character on the downside may already be changing.
The timing is itself the signal. The QQQ March put expiry stretches into 2027, placing the institutional concern on a multi-quarter horizon. Large institutions are buying that protection now, while skew is still cheap and the VIX sits near 16, which tells you the professionals who move these markets have already judged that hedging today beats waiting. That is worth understanding before the next move happens.
For investors wanting to act on the institutional hedging shift rather than simply observe it, our dedicated guide to building a bearish options overlay covers how Super Bear structures and bearish butterflies can deliver index-level downside protection for a net credit at entry.
Past performance does not guarantee future results. These statements are speculative and subject to change based on market developments.