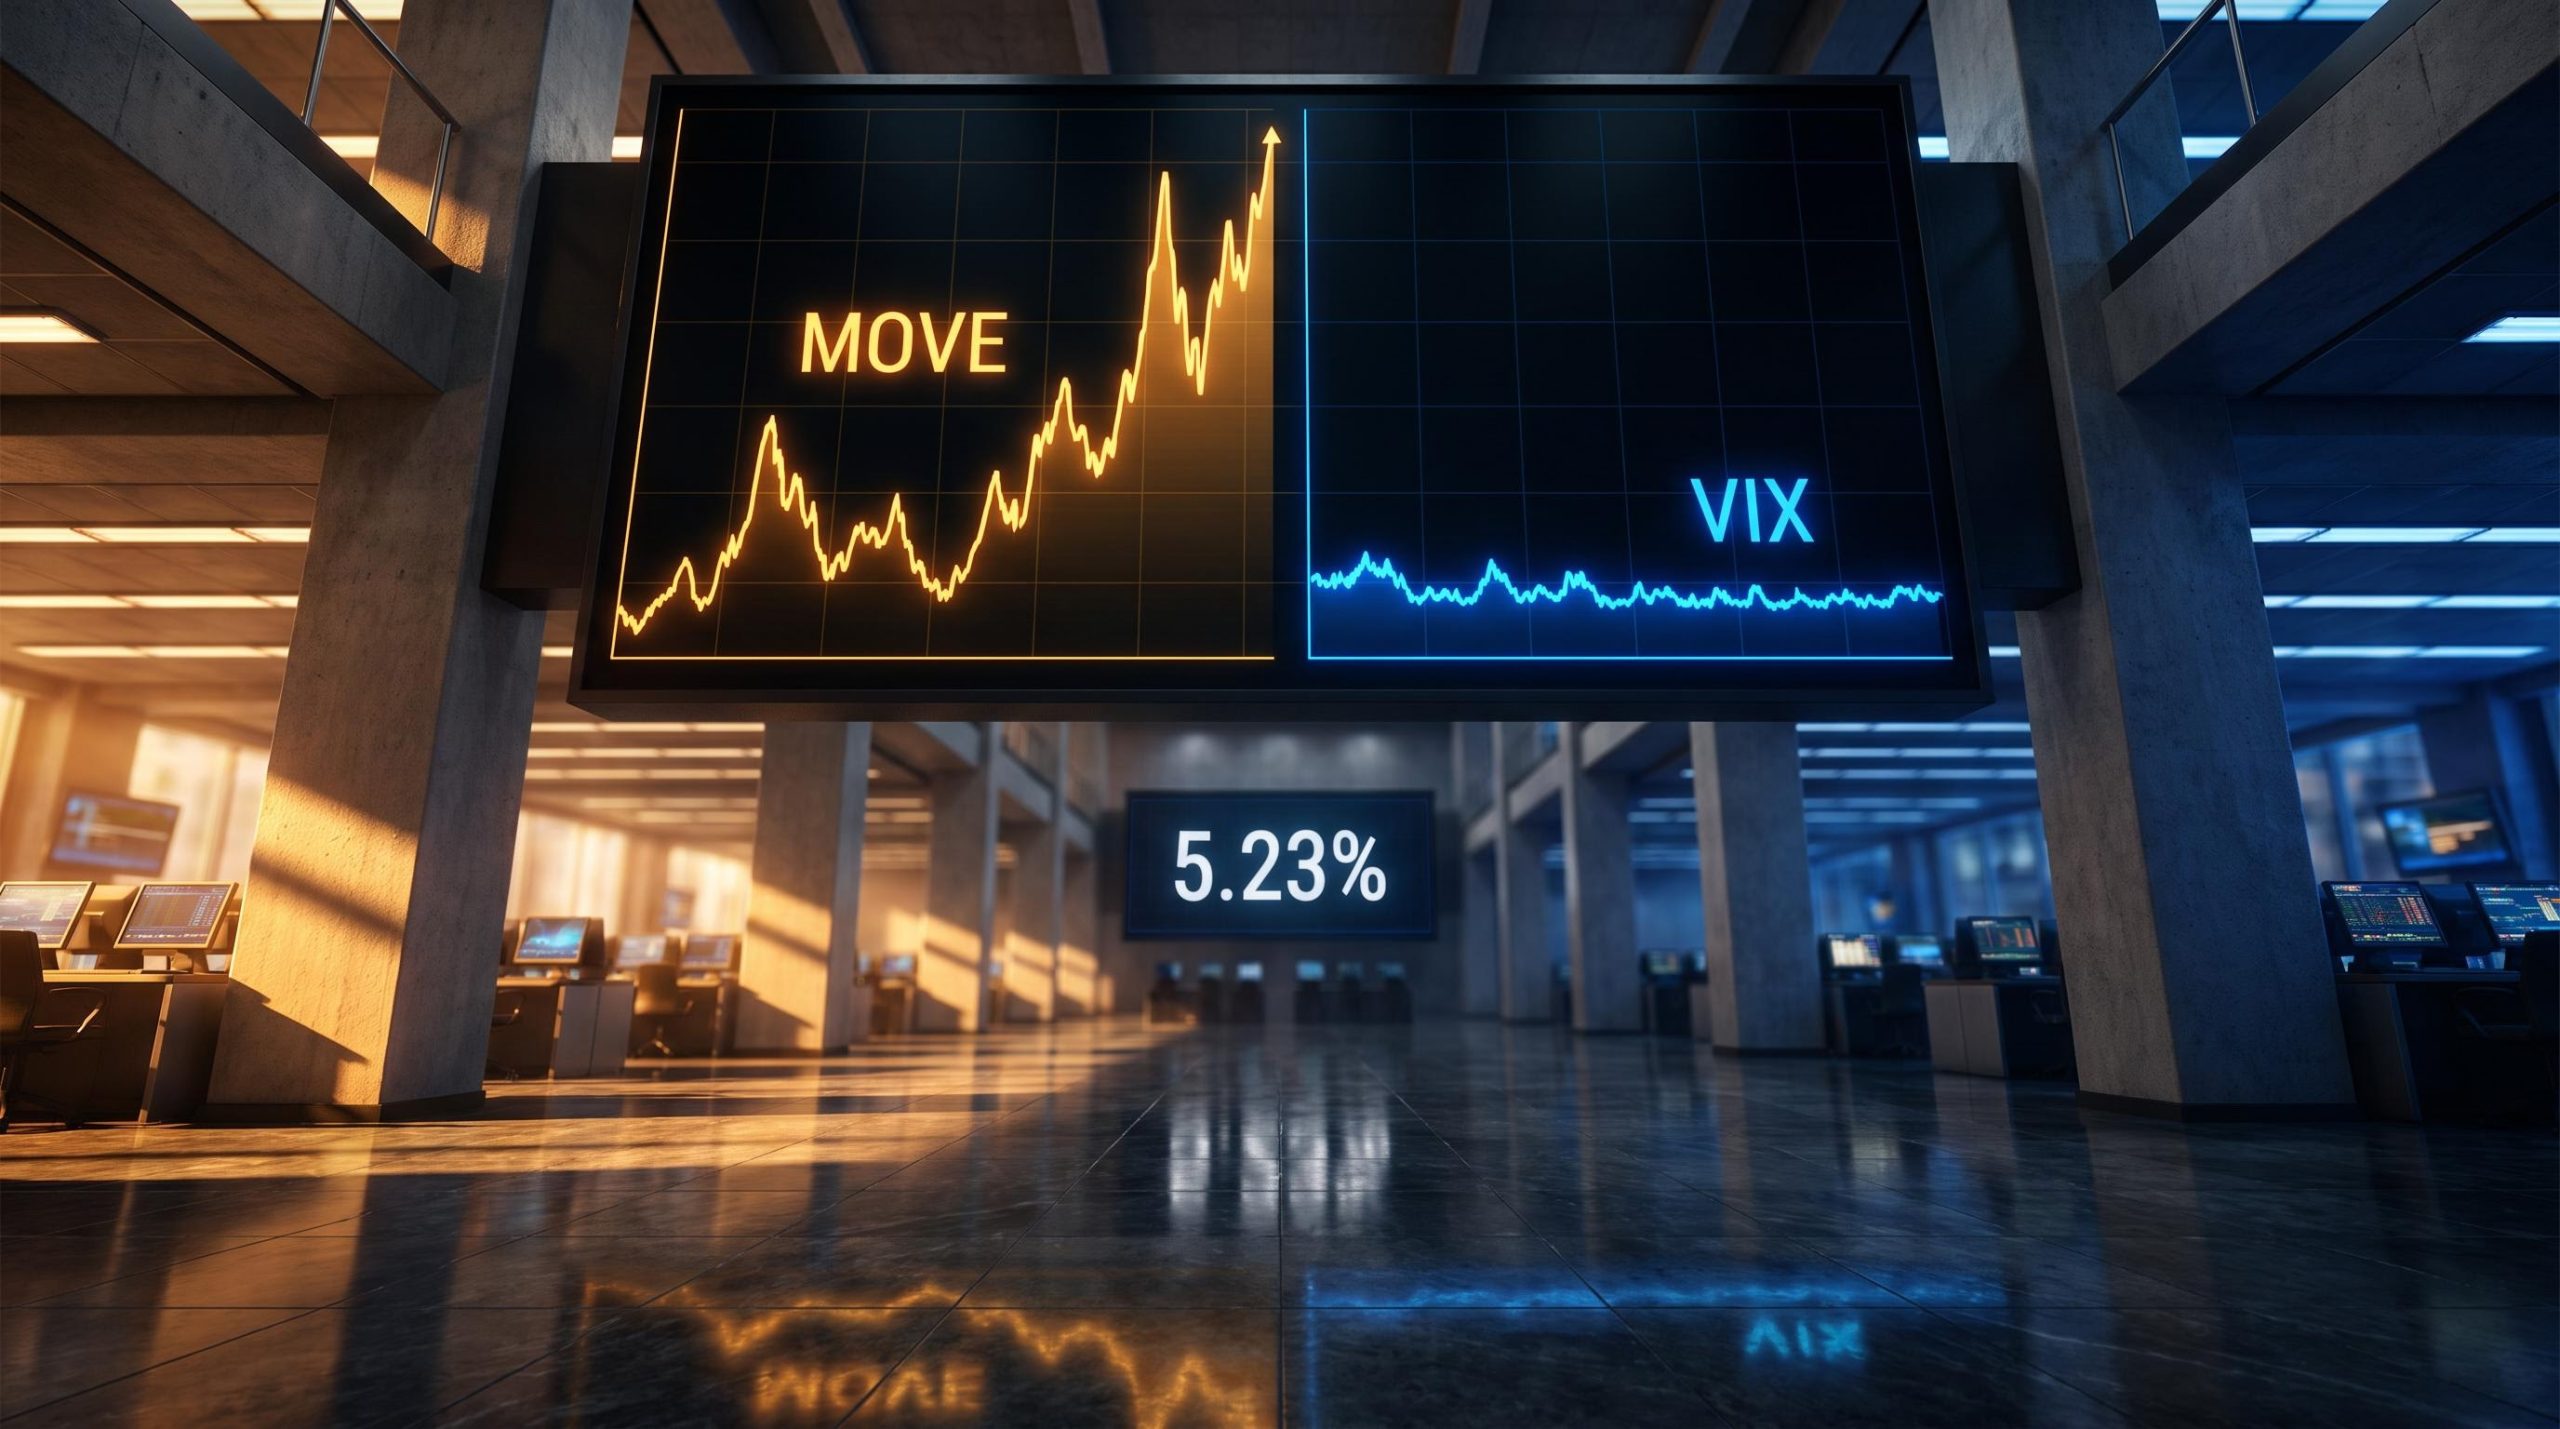
The 10-year Treasury yield touched 5.23% this week, its highest reading since 2007. The ICE BofA MOVE index just recorded its largest weekly jump since the Liberation Day tariff shock of April 2025. Treasury auctions are producing bid tails that have not been seen in roughly a decade.
The VIX, meanwhile, has barely moved. Equities are sitting around 1% below all-time highs.
This is not a minor statistical quirk. When the bond market prices in significant stress and the equity market prices in relative calm, either one of them is wrong or something structural is muffling the signal in one of them.
The gap between the MOVE index and the VIX is now wide enough that anyone using volatility measures to gauge portfolio risk may be reading only half the picture. This bond equity disconnect leaves a specific question hanging: which market is telling the truth?
Here is what the divergence actually means for how you think about risk right now, and the specific variables to watch if the calm breaks.
What the MOVE index and the VIX are actually measuring right now
Pull up both indices on a screen this week and they tell contradictory stories. The MOVE index is climbing hard. The VIX is flat. To understand why that matters, you have to understand that the two are measuring completely different things.
The MOVE index is often called the “VIX of bonds.” It tracks implied yield volatility derived from options on 2-, 5-, 10-, and 30-year U.S. Treasuries. It captures how much uncertainty the rates market is pricing into future interest-rate moves.
The VIX does something narrower. It measures 30-day implied volatility on S&P 500 index options, and nothing else. It is an equity-market gauge with a fixed one-month horizon.
These are not interchangeable readings. According to Charles Schwab’s 2026 explainer on the MOVE index, the correlation between the two has been estimated to reach only 60-70% at its peak, which means they can, and regularly do, point in opposite directions.
VIX regime shifts do not follow a consistent pattern across decades; research covering the period since 2017 identifies three structurally distinct periods in which the same spot reading carried opposite predictive implications, a finding that directly challenges any static interpretation of the current sub-16 reading.
| Attribute | MOVE Index | VIX |
|---|---|---|
| What it measures | Implied yield volatility | Implied equity volatility |
| Underlying instrument | Options on 2-, 5-, 10-, 30-year Treasuries | S&P 500 index options |
| Time horizon | Rates-market weighted | 30 days |
| Current signal | Rising sharply | Subdued, near lows |
The timing edge belongs to bonds.
Charles Schwab’s 2026 research notes that the MOVE index “can sometimes signal market turbulence before the VIX does,” making it a potential early warning the equity gauge does not yet reflect.
This week’s readings in context
The specifics sharpen the puzzle. Reuters reported that on 25 September 2026 the benchmark 10-year yield reached an intraday high of 5.2297% before closing at 5.158%, the highest level since 2007. Over the same week, the MOVE index jumped roughly 30%, its steepest weekly rise since the tariff turmoil of April 2025.
At the same time, equity volatility stayed asleep. Options analyst Brent Kachuba noted that 0DTE straddle pricing, the cost of same-day-expiry S&P 500 options, was sitting near its lowest level of the prior year.
Despite the bond-market stress, equities held roughly 1% below all-time highs. That the rates market is flashing its sharpest stress spike in months while equity options remain anchored near historic lows tells you the two markets are pricing fundamentally different scenarios. One of them will eventually have to adjust.
When big ASX news breaks, our subscribers know first
Three structural reasons the VIX has not followed MOVE higher
A calm VIX in this environment is not proof that the equity market is relaxed. It is partly the mechanical output of specific market-structure forces, and those forces can be named.
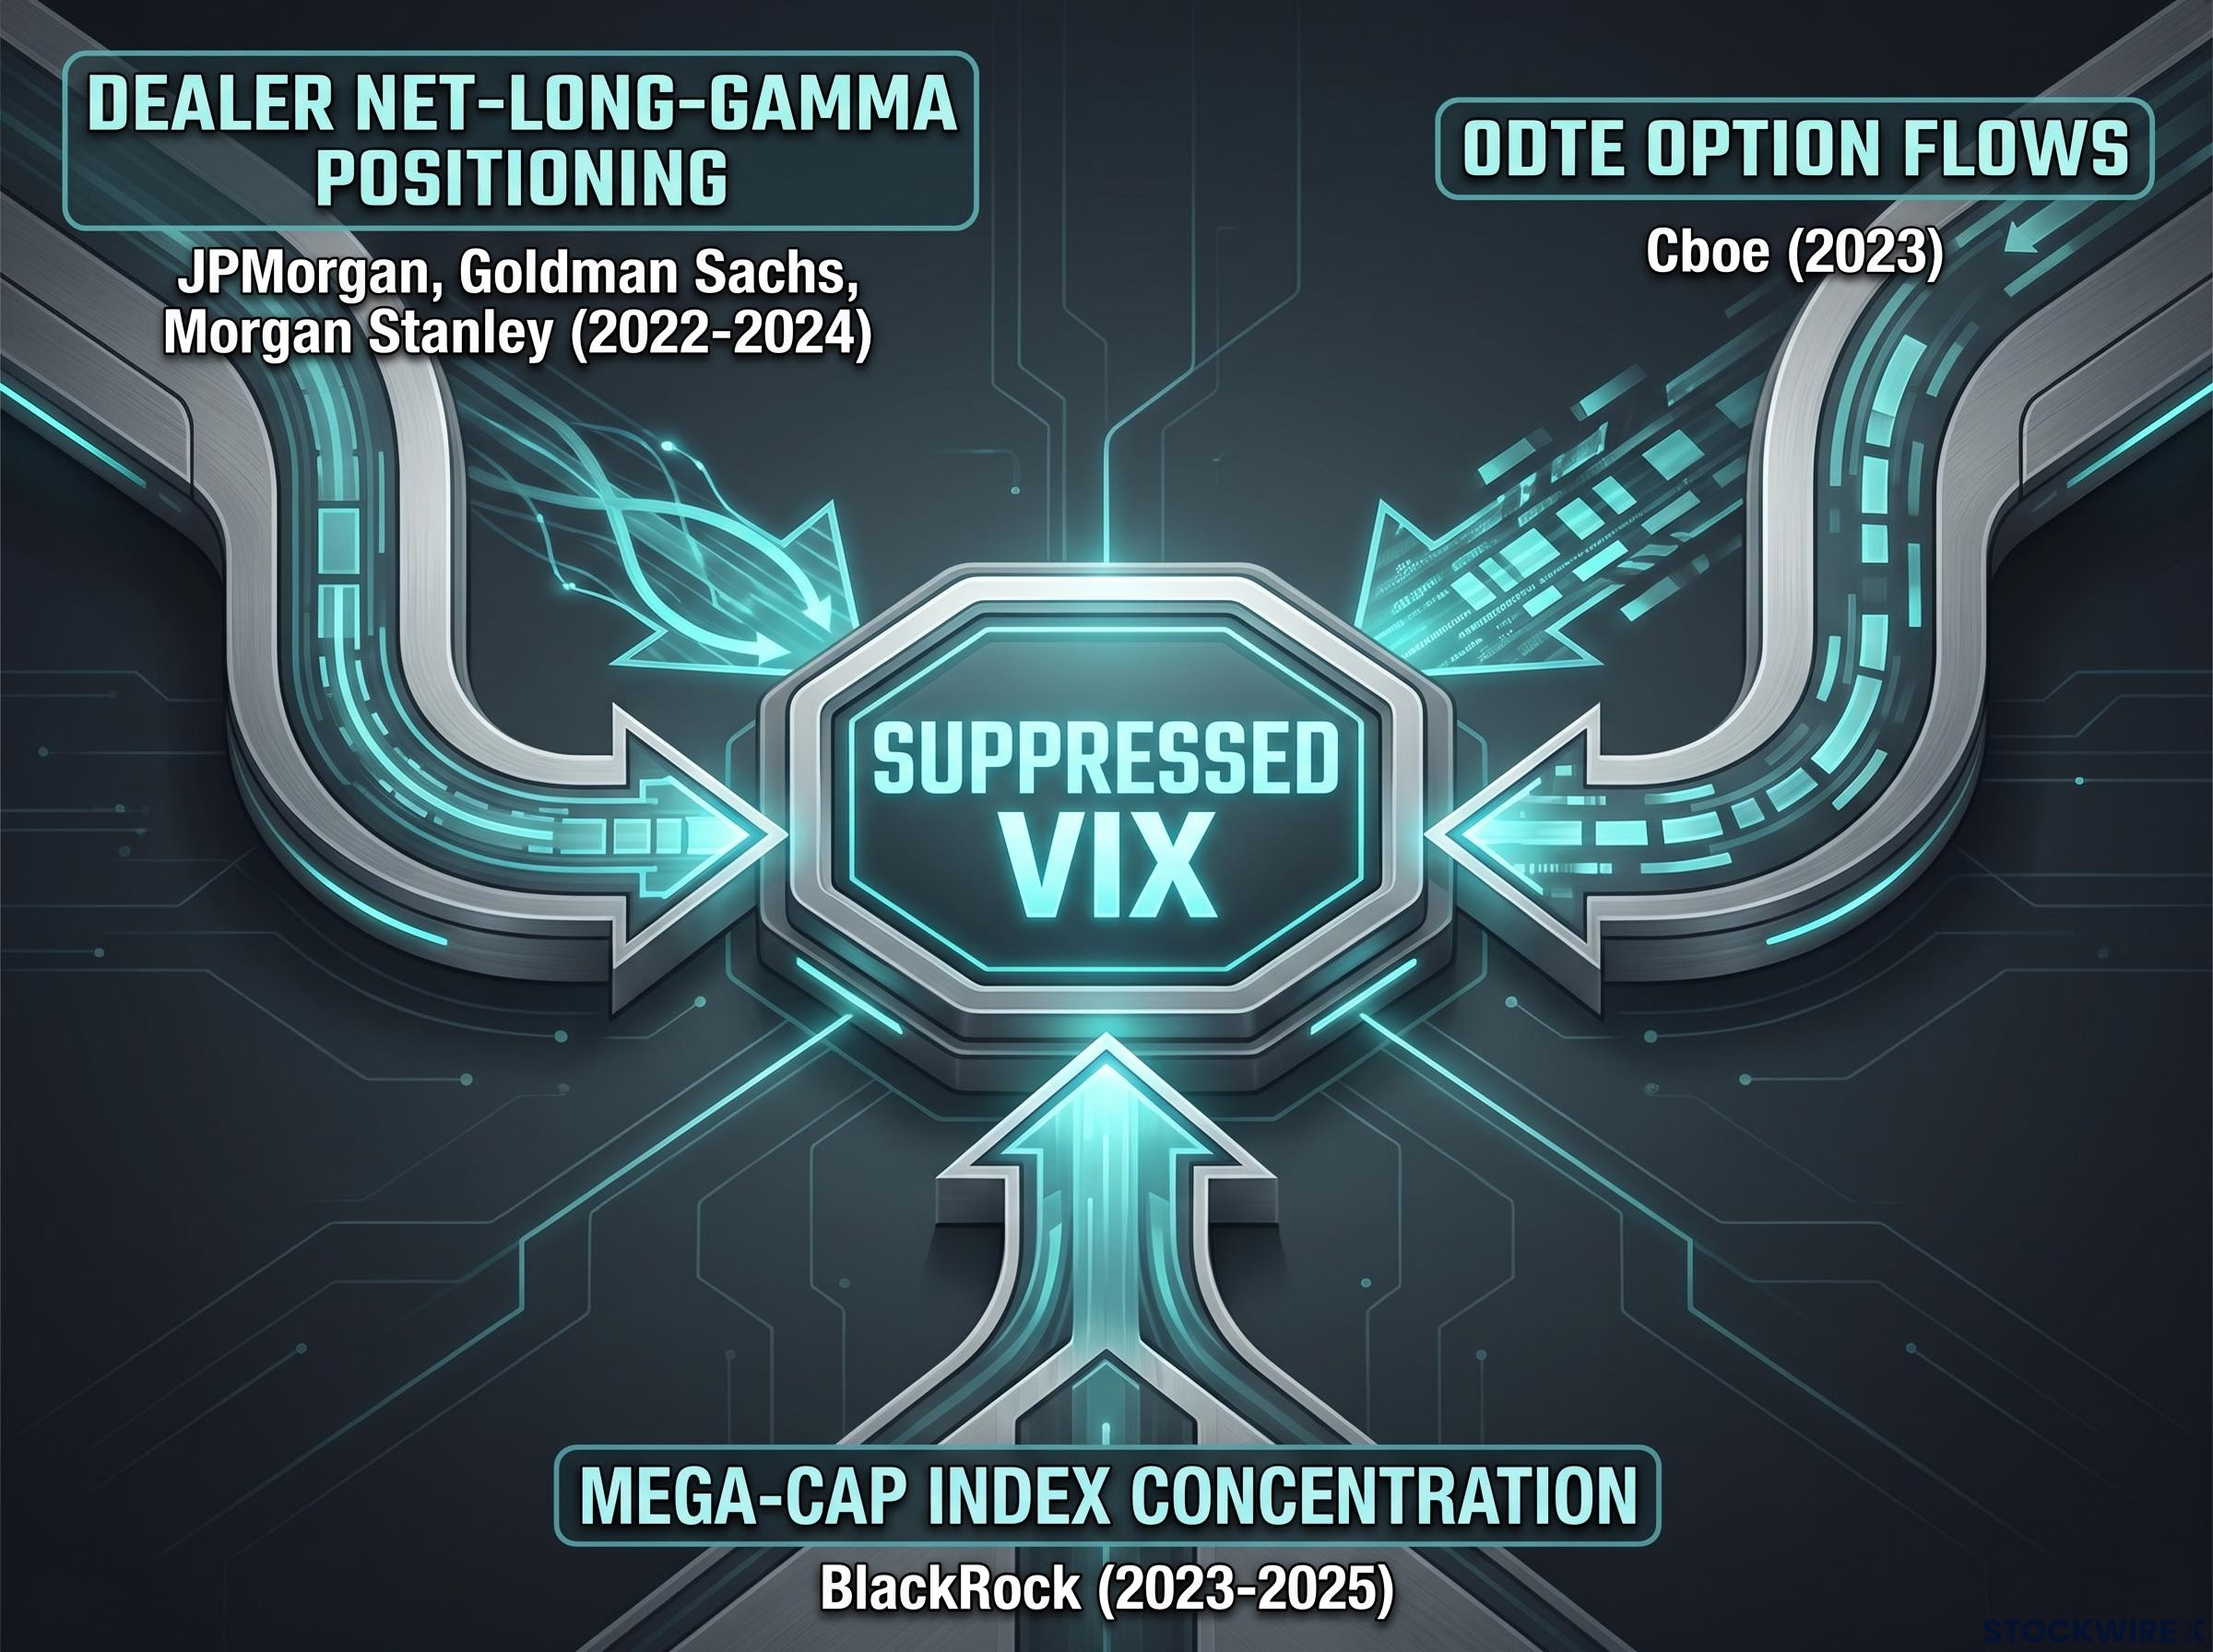
- Dealer net-long-gamma positioning. Research attributed to JPMorgan, Goldman Sachs, and Morgan Stanley between 2022 and 2024 argues that when options dealers are net long gamma, their hedging works against price movement. They buy into dips and sell into rallies, which mechanically compresses intraday swings. That compression keeps realised volatility low, and a low realised volatility keeps 30-day implied volatility, the VIX, pinned down.
- 0DTE option flows. Cboe research and institutional notes since 2023 highlight that same-day-expiry contracts now make up a growing share of S&P 500 options volume. These highly path-dependent trades can absorb short-term shocks within a single session, but the 30-day VIX horizon simply does not capture them. The practical result is that intraday stress can run hot while the headline index stays cold.
- Mega-cap index concentration. Asset-management commentary from BlackRock and others between 2023 and 2025 stresses that U.S. indices are heavily weighted toward large, cash-rich technology names whose balance sheets have proven relatively resilient to rate moves. When these giants hold steady, index-level volatility stays muted even if smaller, rate-sensitive stocks are repricing more violently.
Kachuba has documented a telling side effect of all this: across roughly the prior year, the S&P 500 has tended to grind lower gradually and then spike sharply higher, the inverse of the usual fall-fast, recover-slow rhythm. That pattern is consistent with a market whose downside is being mechanically dampened.
The concentration effect and what it hides
The concentration point deserves its own attention because it hides the most risk. The S&P 500’s heavy weighting in a handful of mega-caps means the headline VIX can stay low even while dispersion across the broader market runs high.
That gap matters directly to your positioning. If you hold small-cap or rate-sensitive exposure, the index VIX is not measuring your risk; it is measuring the stability of names you may barely own.
None of these three mechanisms is random. Together they mean a placid VIX is partly a structural artefact, and structural artefacts can reverse or fail suddenly, leaving portfolios exposed at exactly the wrong moment.
Approximately $1.5 trillion in short-volatility exposure from systematic strategies and structured product issuers is suppressing the headline VIX reading, a figure that contextualises exactly why a sub-16 spot reading is not confirmation that risk has been priced away.
What previous MOVE-VIX divergences reveal about how this ends
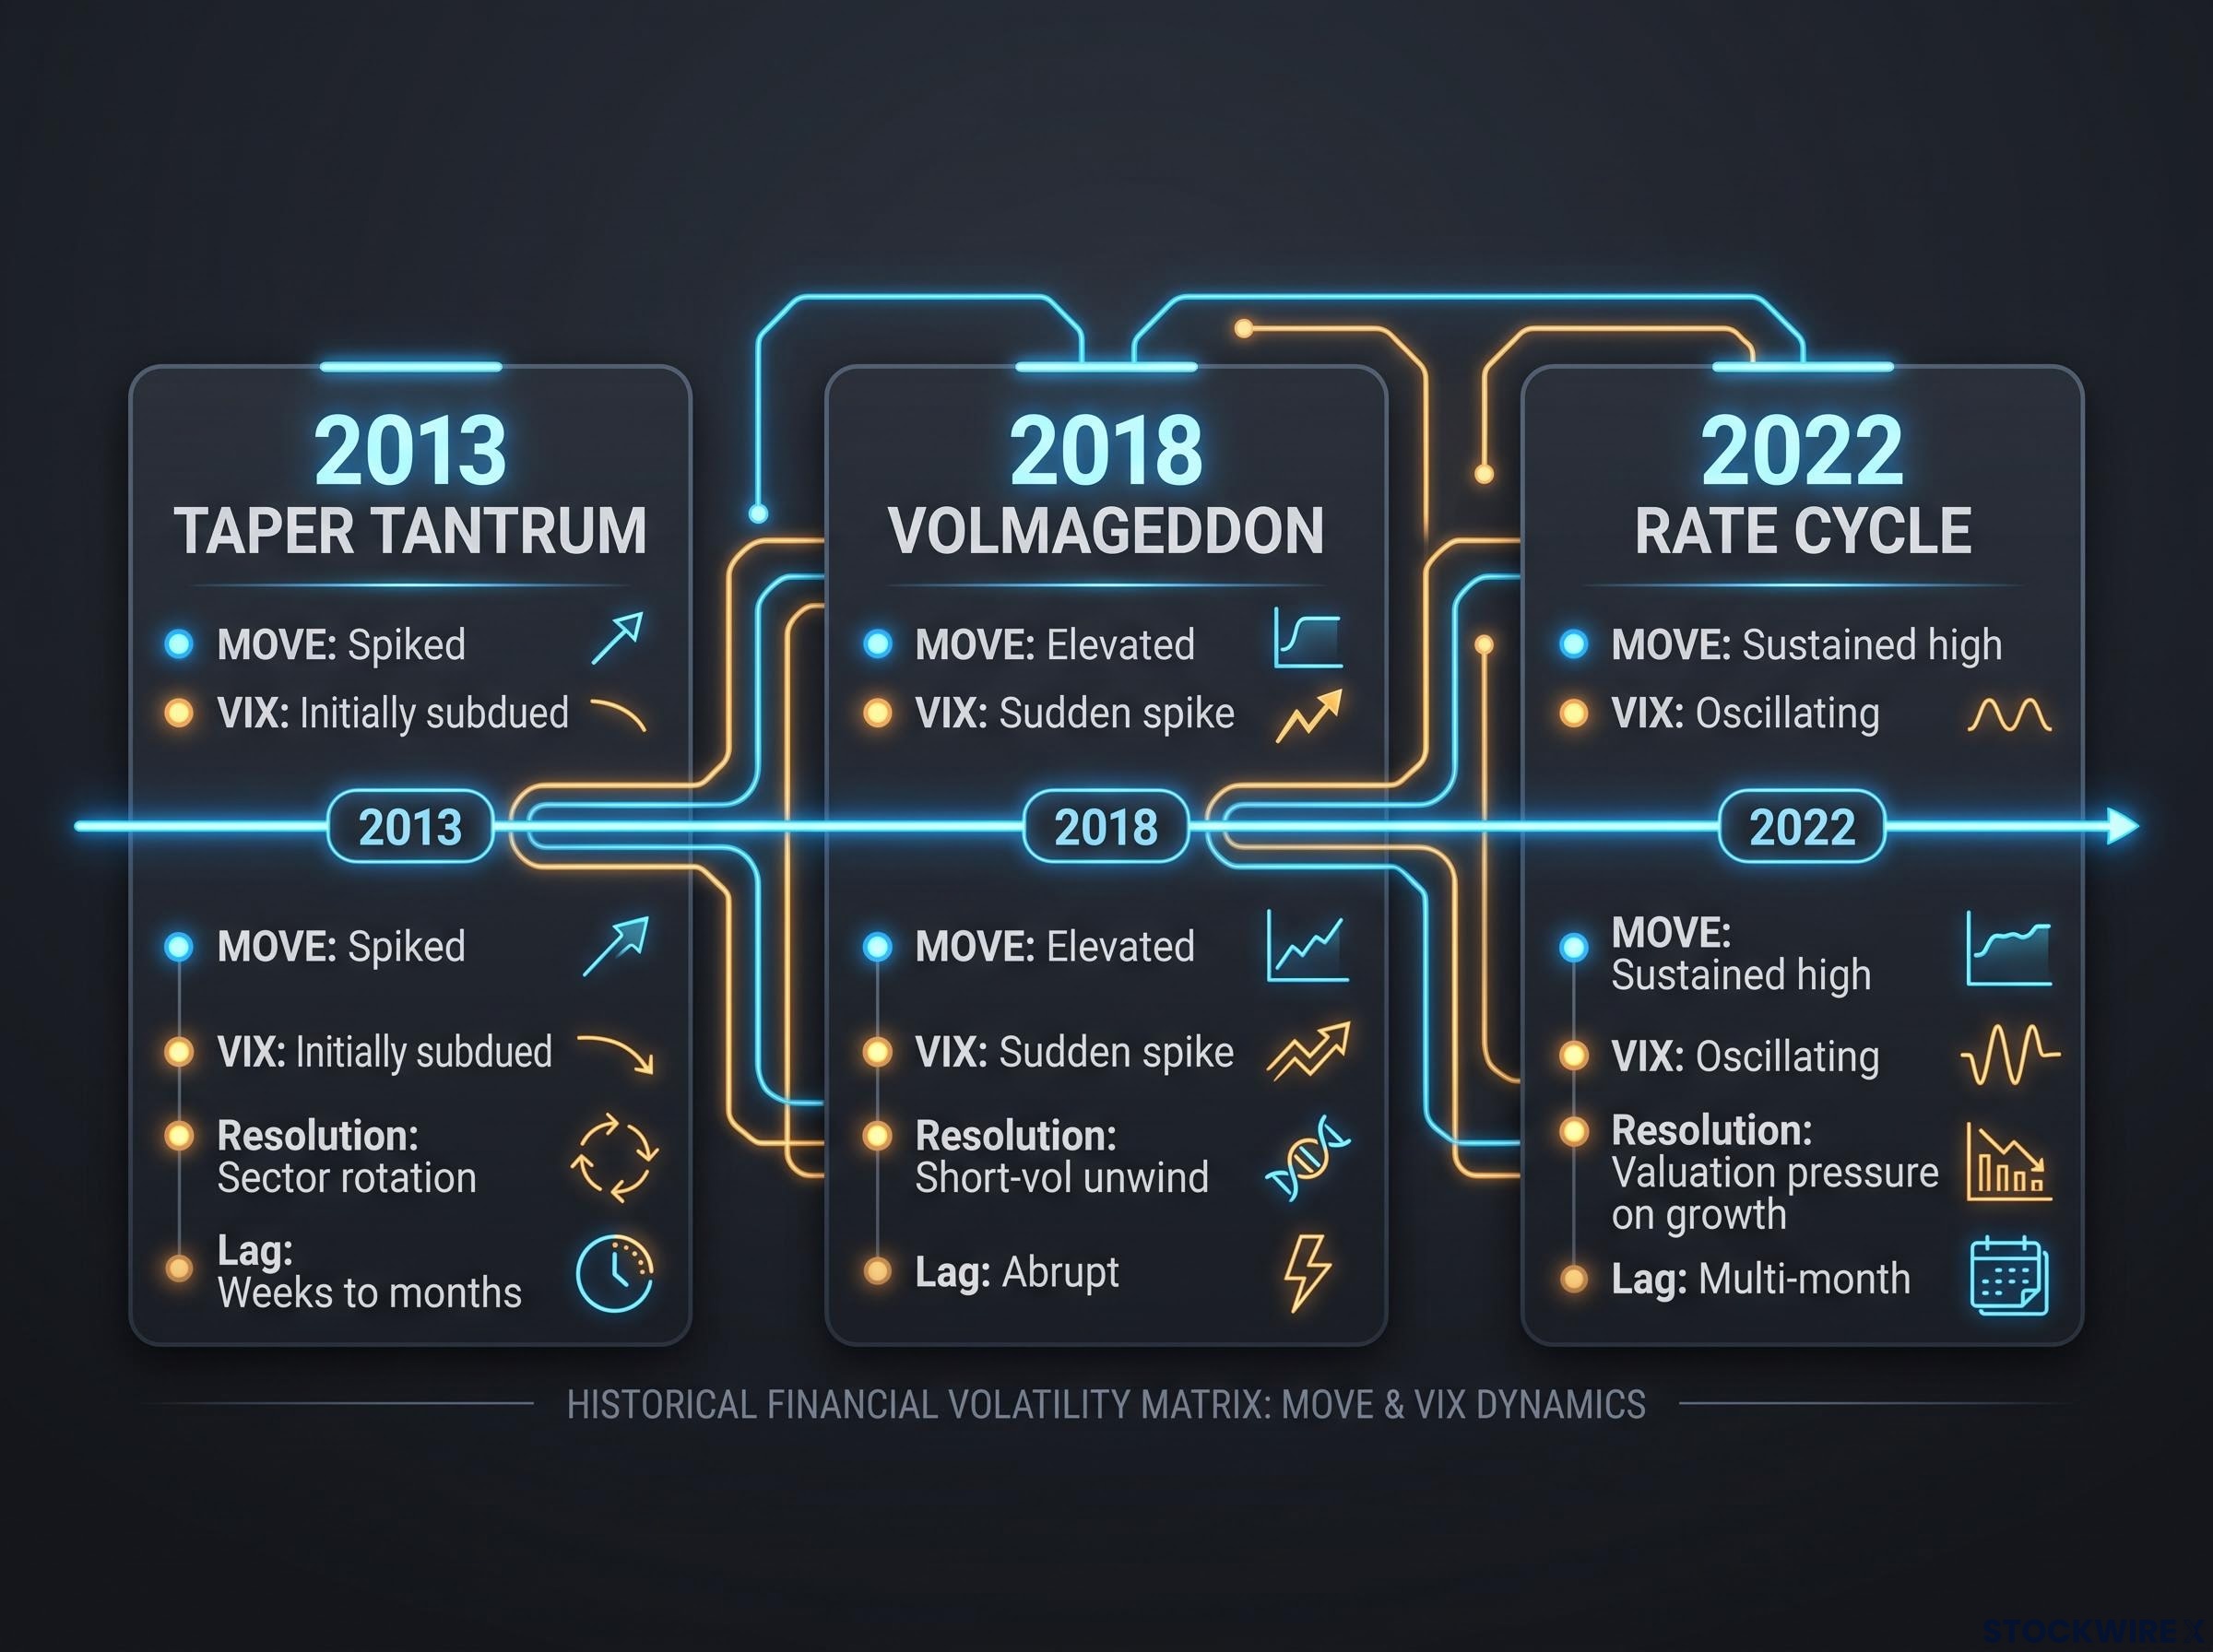
Divergences like this one are not new, and the historical record is less a set of isolated anecdotes than a recurring logic. Three episodes map onto the current setup.
The 2013 Taper Tantrum came first. When the Federal Reserve hinted at winding back its bond buying, Treasury yields and bond volatility spiked while equities initially held firm. The stress eventually leaked into stocks with a lag, driving choppiness and a rotation away from rate-sensitive dividend names.
The 2018 “Volmageddon” episode is the canonical warning about suppressed volatility. The VIX surged from historically low levels, and products structurally short volatility, notably inverse-VIX exchange-traded products, suffered large losses. It is the clearest case of a long calm ending abruptly once crowded short-volatility trades unwound, and it parallels today’s environment where systematic volatility selling is a named suppression mechanism.
The 2022 rate-hiking cycle is the most recent multi-month case. The MOVE index stayed elevated through the U.K. LDI crisis and sustained yield-curve volatility while equities oscillated between fear and relief, eventually resolving through valuation pressure on long-duration growth stocks.
| Episode | MOVE behaviour | VIX behaviour | How it resolved | Lag to equity repricing |
|---|---|---|---|---|
| 2013 Taper Tantrum | Spiked on taper signal | Initially subdued | Sector rotation from rate-sensitive stocks | Weeks to months |
| 2018 Volmageddon | Elevated | Low, then sudden spike | Short-vol unwind, sharp equity drop | Abrupt |
| 2022 rate cycle | Sustained high | Oscillating | Valuation pressure on growth | Multi-month |
Across all three, resolution took one of two paths: bond volatility normalised as policy uncertainty faded, or equity volatility caught up abruptly once suppression mechanisms failed.
Reuters reporting around 10 September 2025 highlighted investor sensitivity as yields approached 5%, yet the prior 5.0% threshold on the 10-year did not trigger a significant equity selloff, leaving the trigger level an open question.
That is the genuinely unusual feature of the current setup. The calm itself is not strange at this stage; what is strange is how long it has held near the 5% threshold. Either the trigger level has quietly shifted higher, or the eventual repricing, when it arrives, will be sharper for having been delayed.
Understanding MOVE and VIX together: a framework for cross-asset risk reading
The mistake is treating this as a choice between two indices. MOVE and VIX are complementary, not competing. MOVE captures rate-market uncertainty, VIX captures equity-market uncertainty, and the divergence between them is itself a data point worth reading.
Charles Schwab’s 2026 framing is useful here: both are imperfect, complementary tools, not precise timing signals. Used together, they describe a fuller risk picture than either can alone.
Part of why the VIX undersells current risk is structural. It does not capture several things that matter in this environment:
- Single-stock dispersion risk across the broader market
- Intraday volatility dominated by 0DTE trading
- Cross-asset spillovers from rates, credit, or currency markets
- The concentration effect that lets mega-caps mask index-level stress
For an investor, that list changes how you use the number. A low VIX alongside a spiking MOVE is not an all-clear. It is a specific configuration that historically has not resolved quietly, which means treating it as safety is accepting tail risk that is not currently priced.
What weak Treasury auction data adds to the picture
The bond stress is not purely a story about rate expectations. It is partly about demand, and the auction data shows it.
Reuters reported that the 30-year auction in the month before 10 September 2025 produced a bid-to-cover ratio of 2.27, the lowest since November 2023, with end-user demand falling to 82.5%, the weakest since August 2024. The 10-year auction on 6 August 2025 drew a bid-to-cover of 2.35x against a recent average of 2.51x, which RBC Capital Markets strategists called “soft.”
This distinction matters to you directly. Demand-driven yield rises are far harder for the Federal Reserve to talk down than expectations-driven ones, which adds a layer of structural concern the VIX does not reflect at all.
Treasury auction demand has become the clearest structural signal separating rate moves driven by policy expectations from those driven by genuine buyer retreat; the $70 billion 5-year note auction clearing at 5.033% with a 3.1 basis point tail and foreign buyers taking just 54.3% of awards illustrates what a demand-driven yield move looks like in practice.
Kachuba’s warning captures the trap: traders holding long options positions in a low-volatility regime face constant pressure to exit before any large move, creating a structural tendency toward under-hedging precisely when tail risk is building.
What to watch before the disconnect resolves
The analytical conclusion here is not a prediction. It is a checklist of three named variables you can actually monitor.
- The 10-year yield trajectory. This is the primary signal. Whether yields stabilise near the current 5.23% or push to fresh highs will tell you whether bond-market stress is peaking or compounding. Recall that the prior 5.0% level failed to trigger equity repricing, so the threshold question is live.
- Treasury auction demand. Watch bid-to-cover ratios and indirect bidder participation at long-maturity auctions. The 30-year auction on 9 October 2025 printed a bid-to-cover of 2.38, only modestly better than the 2.27 reading from the prior month. Continued weakness here signals the demand-side pressure on yields is structural rather than episodic.
- The VIX term structure and skew. If longer-dated equity options begin pricing more uncertainty than near-term ones, a steepening volatility term structure, that would signal professional hedgers are finally taking the bond-market warning seriously at longer horizons.
The three together form a stronger signal than any one alone. If yield levels, auction demand, and the term structure all move in the same direction, that convergence is materially more meaningful than a single indicator flashing.
The central read is this: the calm VIX is not evidence of safety. It is evidence of structural suppression in a specific options-market configuration that has a historical tendency to resolve abruptly.
Track these three and you will recognise the disconnect resolving before someone watching only the VIX does.
This article is for informational purposes only and should not be considered financial advice. Investors should conduct their own research and consult with financial professionals before making investment decisions. Past performance does not guarantee future results, and any forward-looking observations are speculative and subject to change based on market developments.
Reading both markets at once, not just the calmer one
The bond market, through the MOVE index, is registering its clearest stress signal since the Liberation Day tariff shock of April 2025. The equity market, through the VIX, remains suppressed by dealer gamma positioning, 0DTE flows, and index concentration. Both readings are technically accurate. Neither one alone is enough.
That is the decision-point. The question is no longer whether the disconnect exists; it plainly does. The question is whether you are positioned as though the VIX is complete information, or as though the MOVE reading is telling you something the VIX cannot capture.
History suggests these divergences resolve rather than linger. The path they take, quiet normalisation or an abrupt equity catch-up, depends largely on whether the bond-market stress stays demand-driven or eases on policy clarity. Reading both markets at once, rather than the calmer of the two, is what puts you on the right side of that resolution.
For investors who want to move from reading the MOVE-VIX divergence to acting on it, our comprehensive walkthrough of beta-weighted risk management covers the specific position-sizing and volatility-targeting frameworks that translate cross-asset stress signals into deliberate, measurable portfolio adjustments.