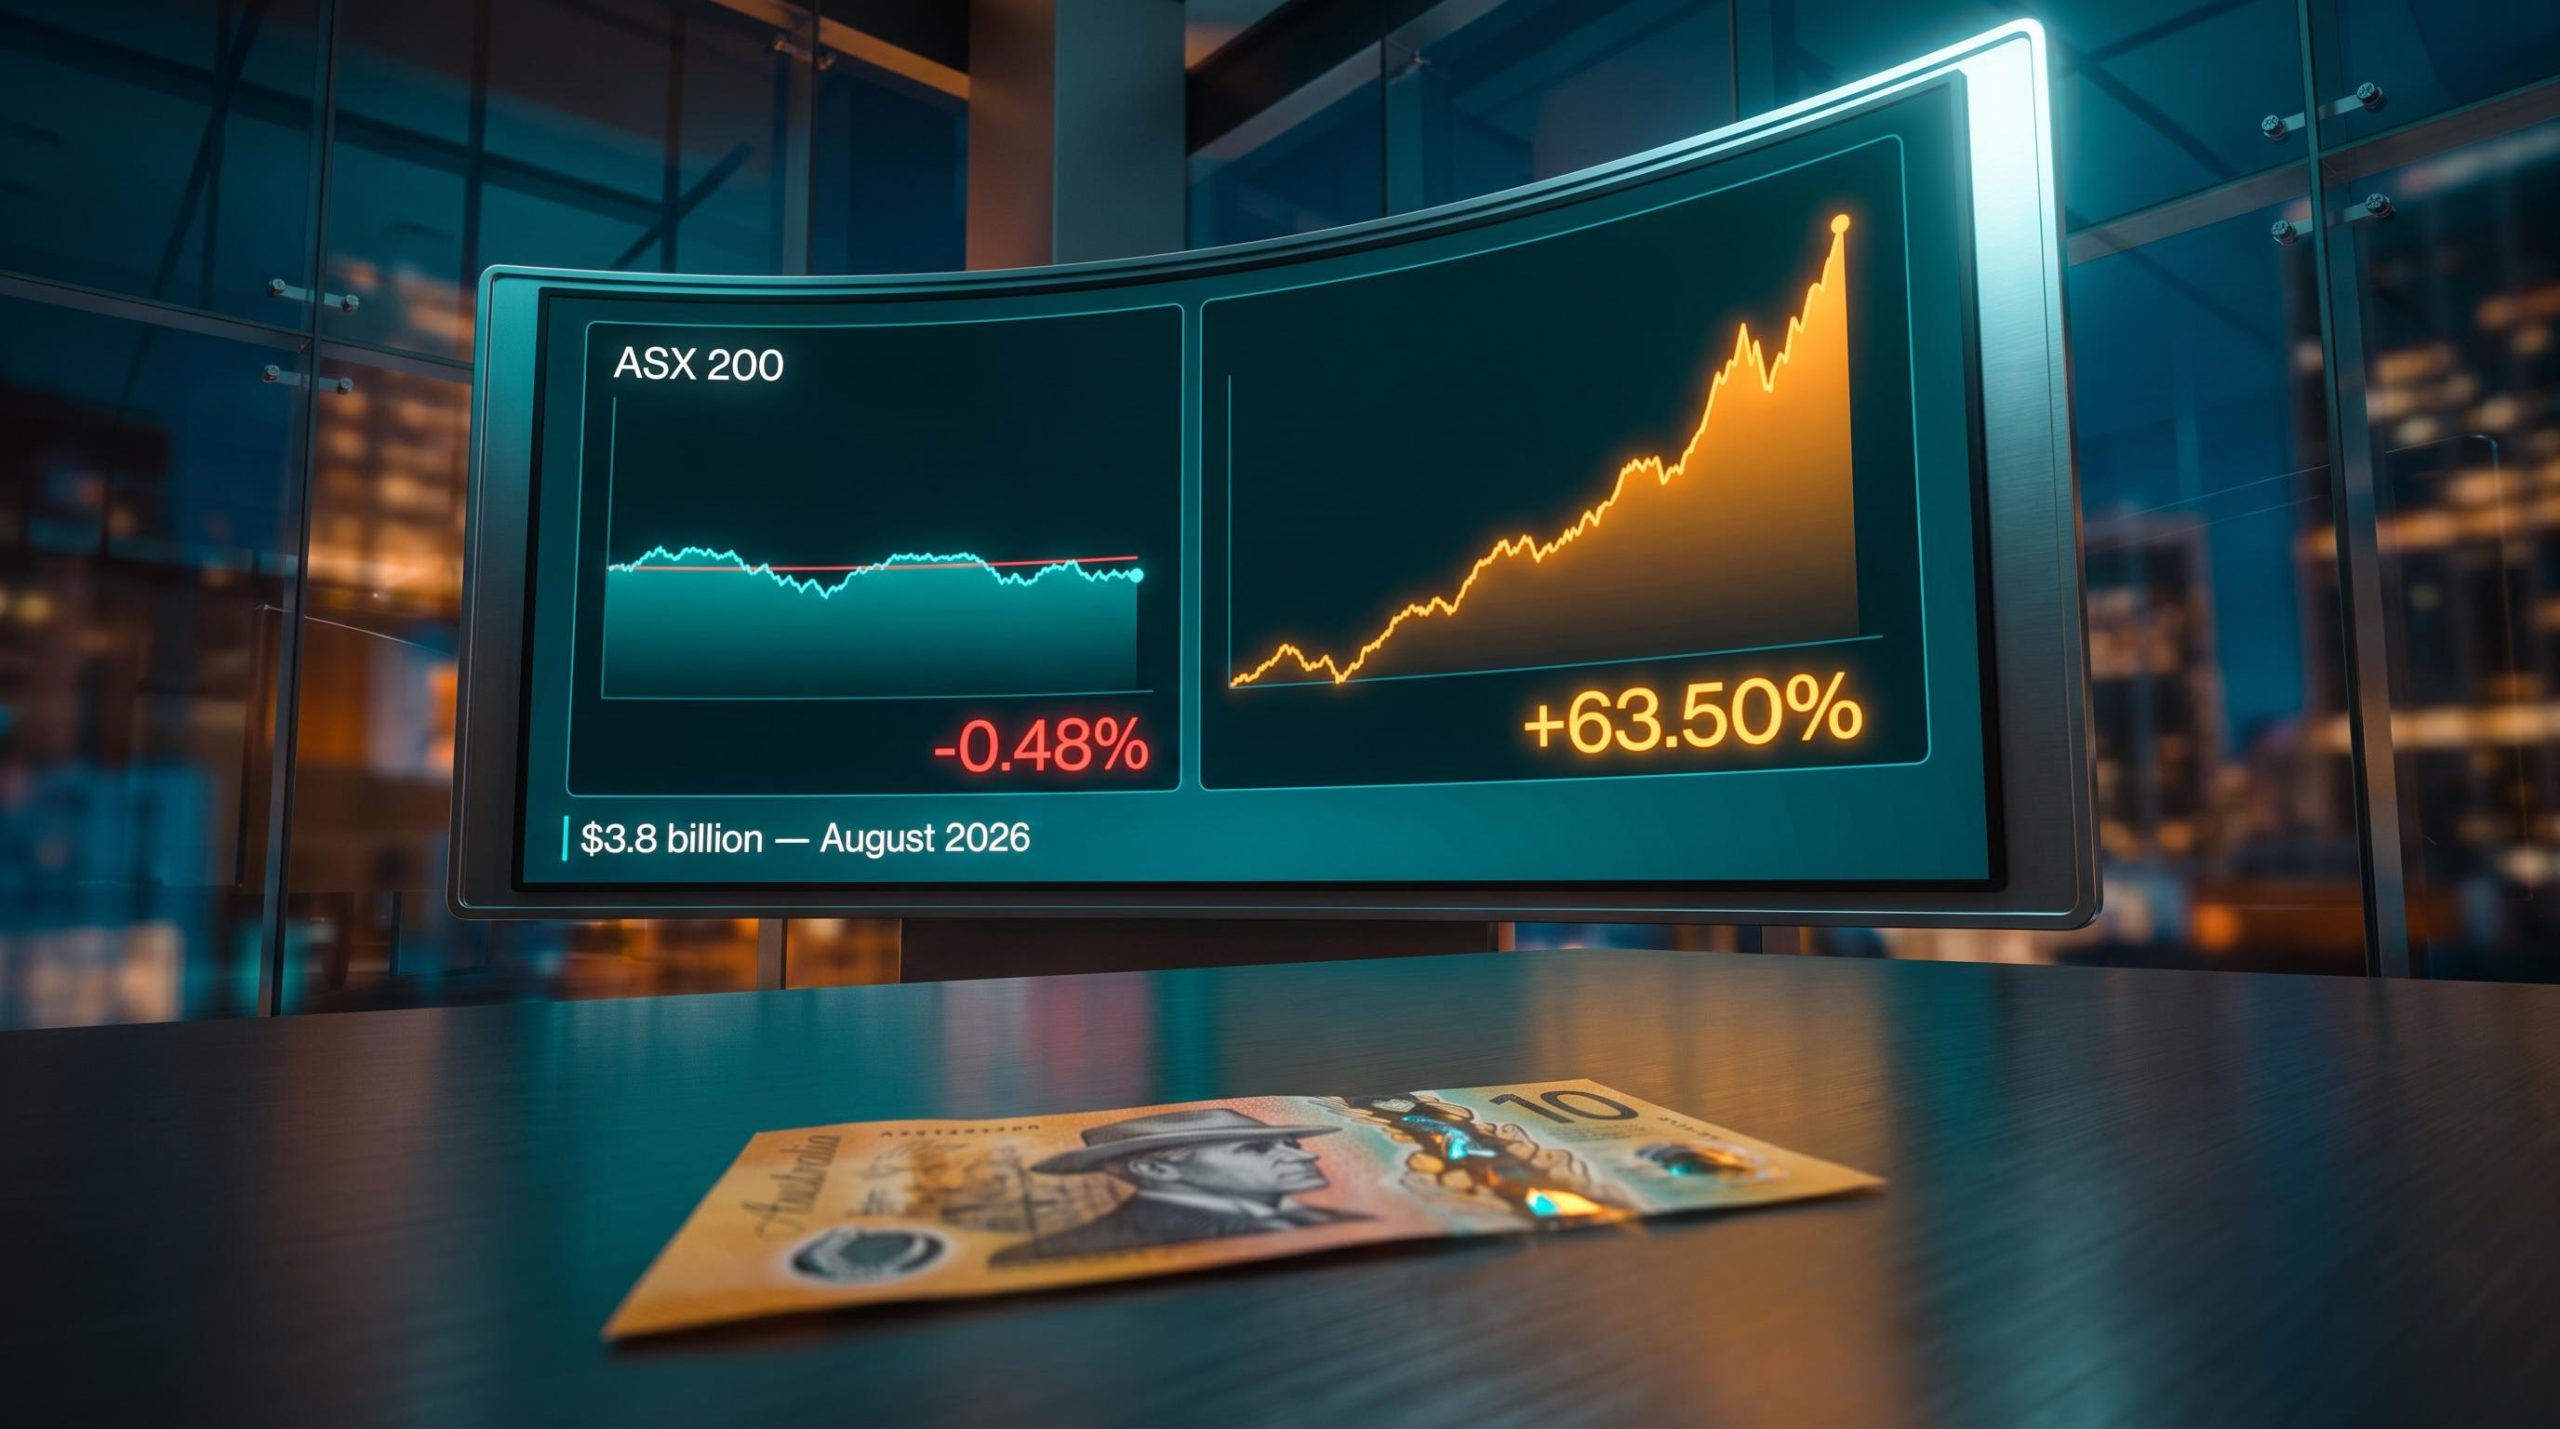
Australian investors poured a record $3.8 billion into international equity ETFs in August 2026, the largest single month on record, and they did it while the local market gave them almost nothing to work with.
That is the tension worth sitting with. The S&P/ASX 200 has delivered close to zero this year, yet capital is flowing offshore at an accelerating pace. This is not a panic trade. It is a deliberate reallocation by investors who have concluded that the structure of the Australian market, weighted toward banks and miners with thin technology exposure, limits what a domestic portfolio can do.
This piece breaks down which international ETFs are capturing that money, the investment logic driving each, and what a finance-literate Australian investor should weigh before adding or increasing an offshore position.
Why Australian investors are sending record capital offshore
The rotation story does not rest on a single data point. It rests on three independent data sets that all point the same way, which is what separates a structural shift from a momentum trade.
Start with the flows. International equity ETFs pulled in $3.56 billion in July 2026, a record at the time, then broke it again with $3.8 billion in August 2026, a new all-time monthly high according to the BetaShares Australian ETF Review. Total industry assets reached approximately $382 billion in August, and international equities were the single most popular category two months running.
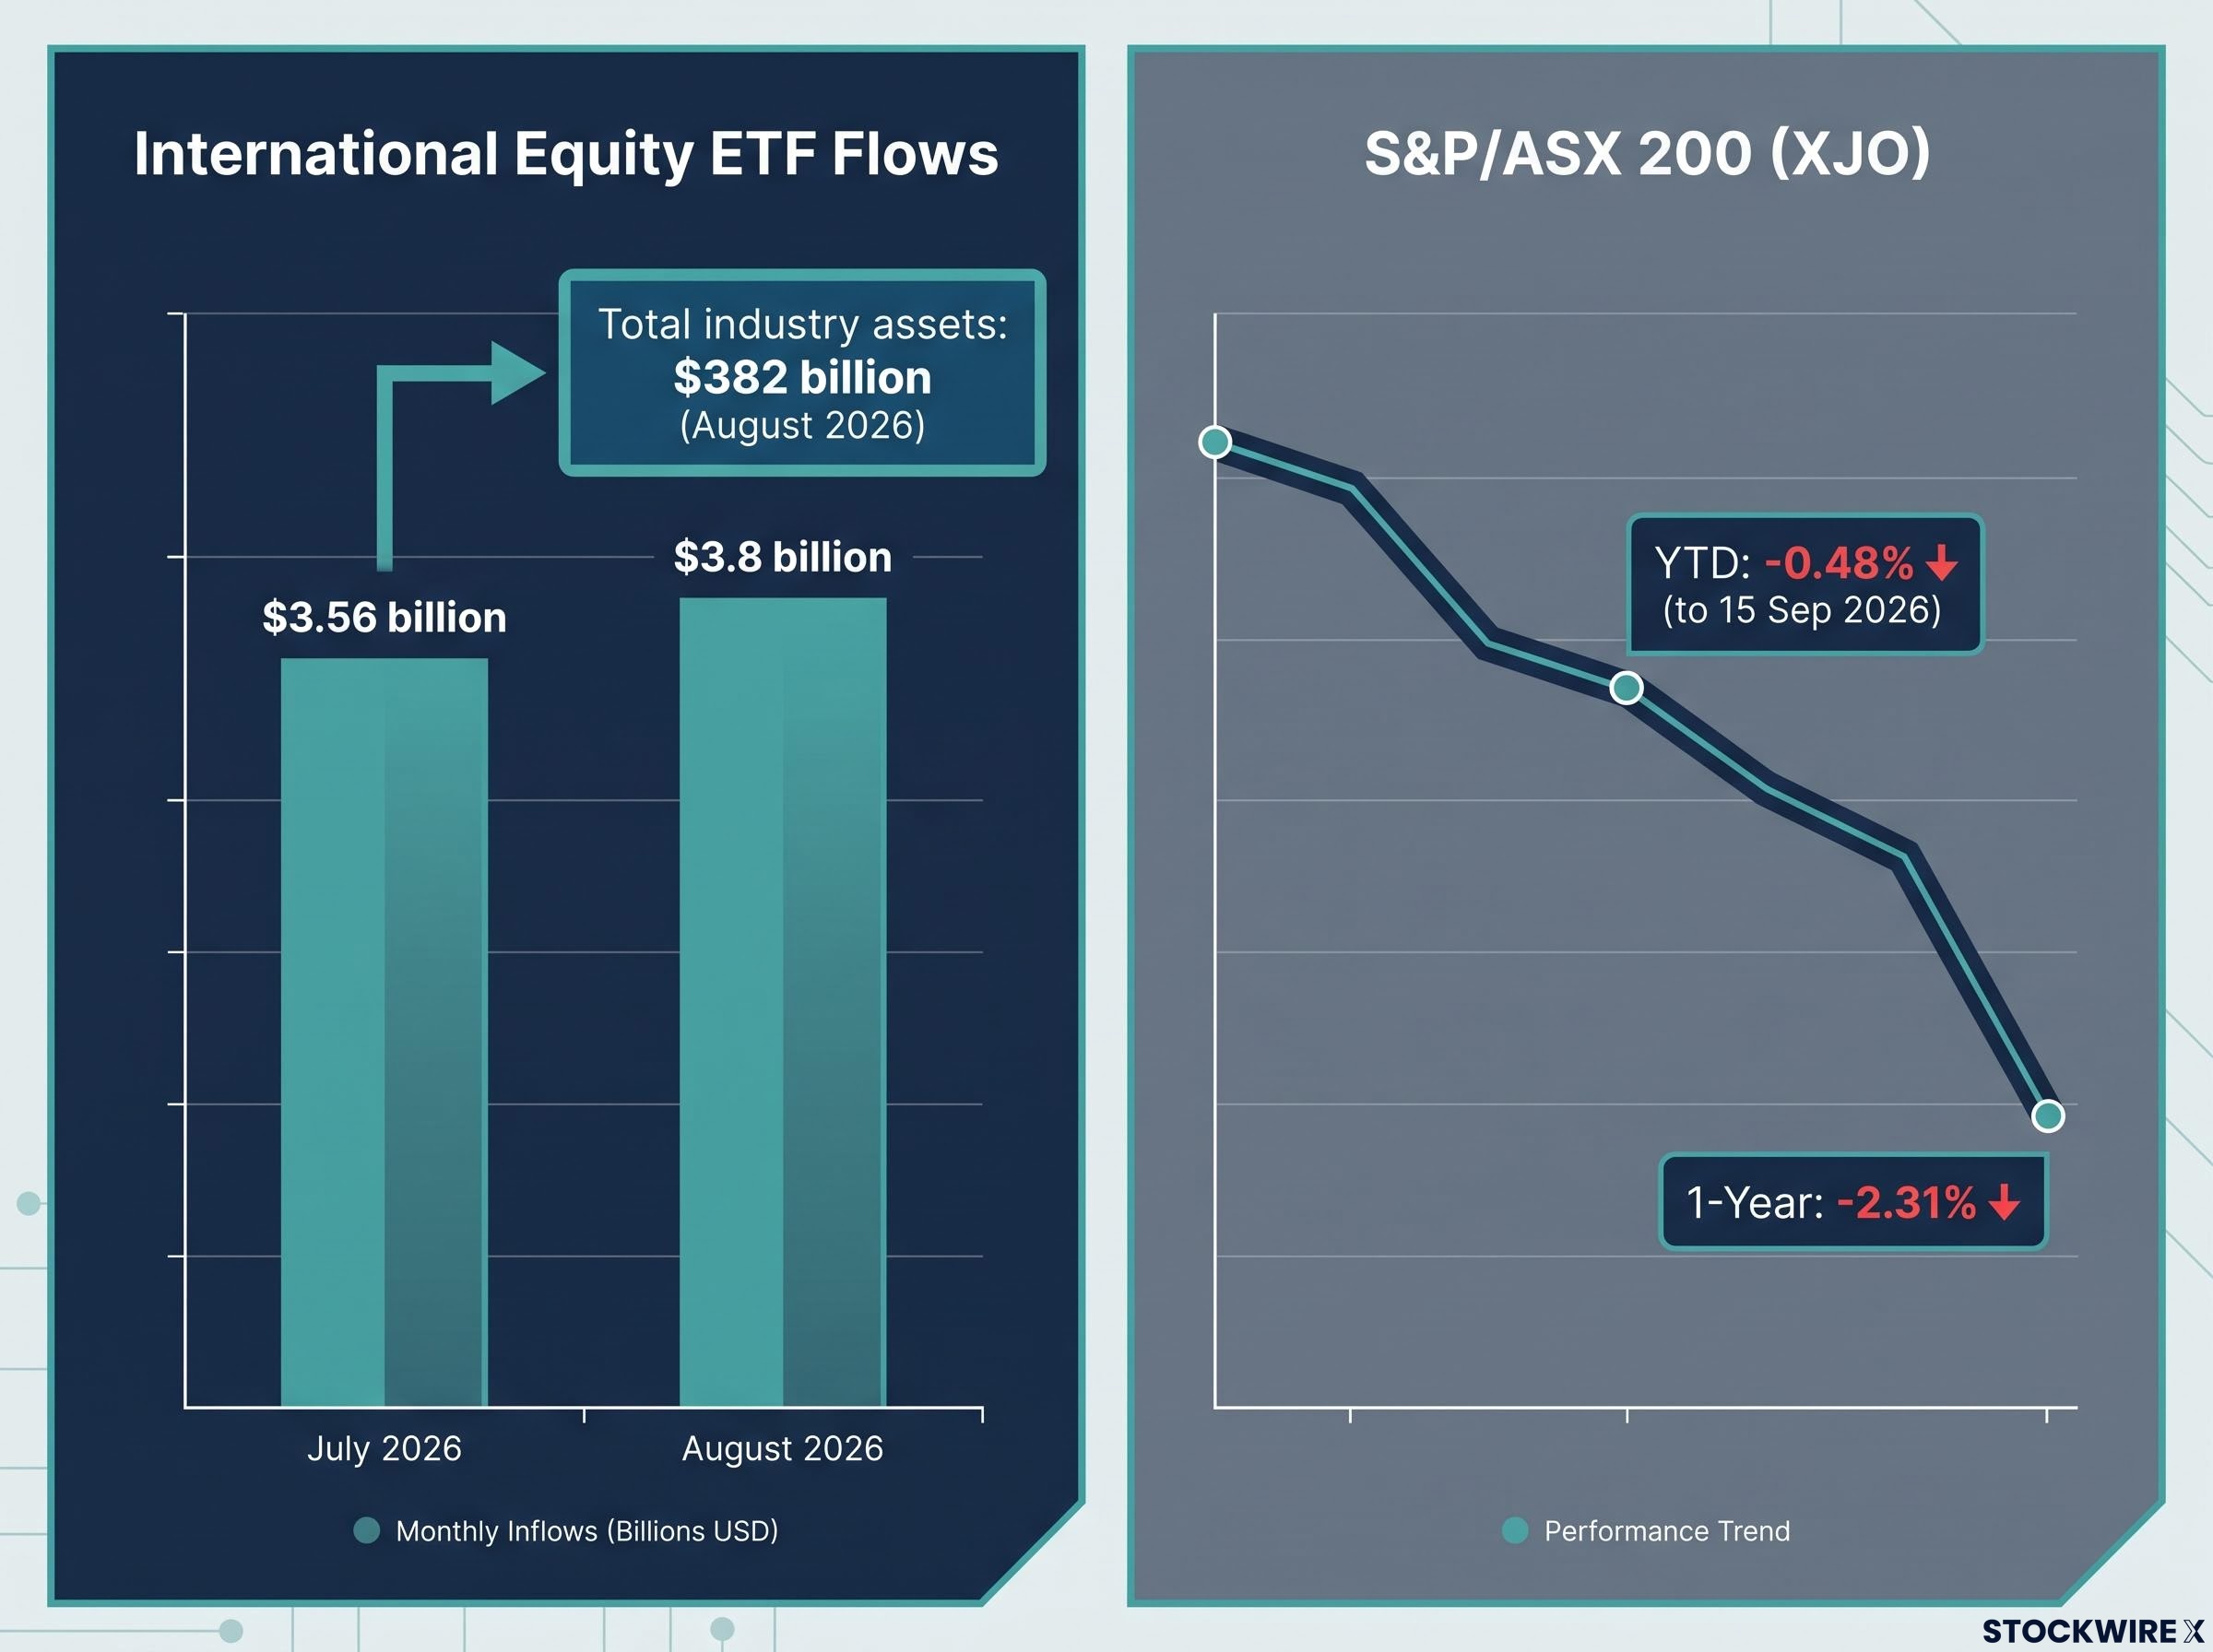
Now put that against what the domestic market offered. The ASX 200 sat at a year-to-date price return of approximately -0.48% as of 15 September 2026, with a total return of roughly +0.19% on Yahoo Finance’s series, and a one-year return of -2.31%. Investors were not chasing a hot local market. They were leaving a flat one.
The reasons split into three structural drivers:
- ASX composition: The index leans heavily on banks and miners, with limited representation in technology and AI-linked sectors, capping the growth exposure a domestic portfolio can hold.
- Offshore technology access: International ETFs offer entry to semiconductor, AI, and global tech themes that are difficult to build directly and largely absent from the ASX.
- Adviser conviction: This is not a retail-only impulse, and the survey data proves it.
According to the MSCI ETF Intelligence Report 2026, 67% of Australian advisers plan to increase international equity allocations over the next two years, while only 5% plan to reduce them. 40% expect to focus more on emerging markets specifically.
The retail signal points the same direction, with a BetaShares survey showing 65% of ETF investors planning their next allocation into global equities.
Read together, the consecutive record months, the flat-to-negative ASX, and the adviser conviction data tell you this rotation has institutional backing. It is not a sentiment spike that reverses on the next domestic earnings season.
ASX structural concentration in financials and materials, which together account for roughly 52% of the S&P/ASX 200, is the foundational reason the offshore rotation carries conviction beyond a single data cycle; broad global funds like VGS and IVV have become the standard instruments for Australian investors bridging that gap.
When big ASX news breaks, our subscribers know first
Three ETFs leading the 2026 offshore rotation: what the numbers show
The offshore field is wide, from broad global index funds to niche thematics. Three funds stand out because they combine meaningful inflows with the most dramatic performance gaps against the ASX: the BetaShares Asia Technology Tigers ETF (ASIA), the BetaShares MSCI Emerging Markets Complex ETF (BEMG), and the VanEck MSCI International Value AUD Hedged ETF (HVLU).
The table below sets each against the ASX 200 as the baseline. The dispersion is not marginal. It is categorical.
| ETF / Ticker | YTD Return (Sep 2026) | One-Year Return | Key Exposure | Currency |
|---|---|---|---|---|
| ASIA (Asia Technology Tigers) | ~+42.44% (to 11 Sep) | +63.50% (to 17 Sep) | Asia ex-Japan tech; ~40% semiconductors | Unhedged |
| BEMG (MSCI Emerging Markets) | ~14% (13.91%-16.38% range) | +27.06% (to 31 Aug) | 24 EM nations; Taiwan, Korea, China, India ~80% | Unhedged |
| HVLU (Intl Value AUD Hedged) | ~45.63% (to 18 Sep)* | +67.94% (to 31 Aug) | ~250 developed-market value companies | AUD hedged |
| S&P/ASX 200 (XJO) | -0.48% price (to 15 Sep) | -2.31% (to 15 Sep) | Domestic banks and miners | AUD |
*A note on HVLU: the original source reported more than 23% year-to-date, while Investing.com (+45.63% to 18 September 2026) and TrackInsight (+45.51% to 28 August 2026) report figures roughly double that. The discrepancy likely reflects different cut-off dates or a price-versus-total-return methodology. The higher figures are more recent and corroborated by multiple sources, so treat them as the working numbers with that caveat in mind.
On HVLU’s value credentials, three MSCI screens define the fund:
- Price-to-book value
- Price-to-forward earnings
- Enterprise value relative to cash flow from operations
The result is a portfolio trading at a price-to-earnings ratio of approximately 10.25 against a category average of 18.40, with a dividend yield of roughly 3.24%.
What each fund actually holds
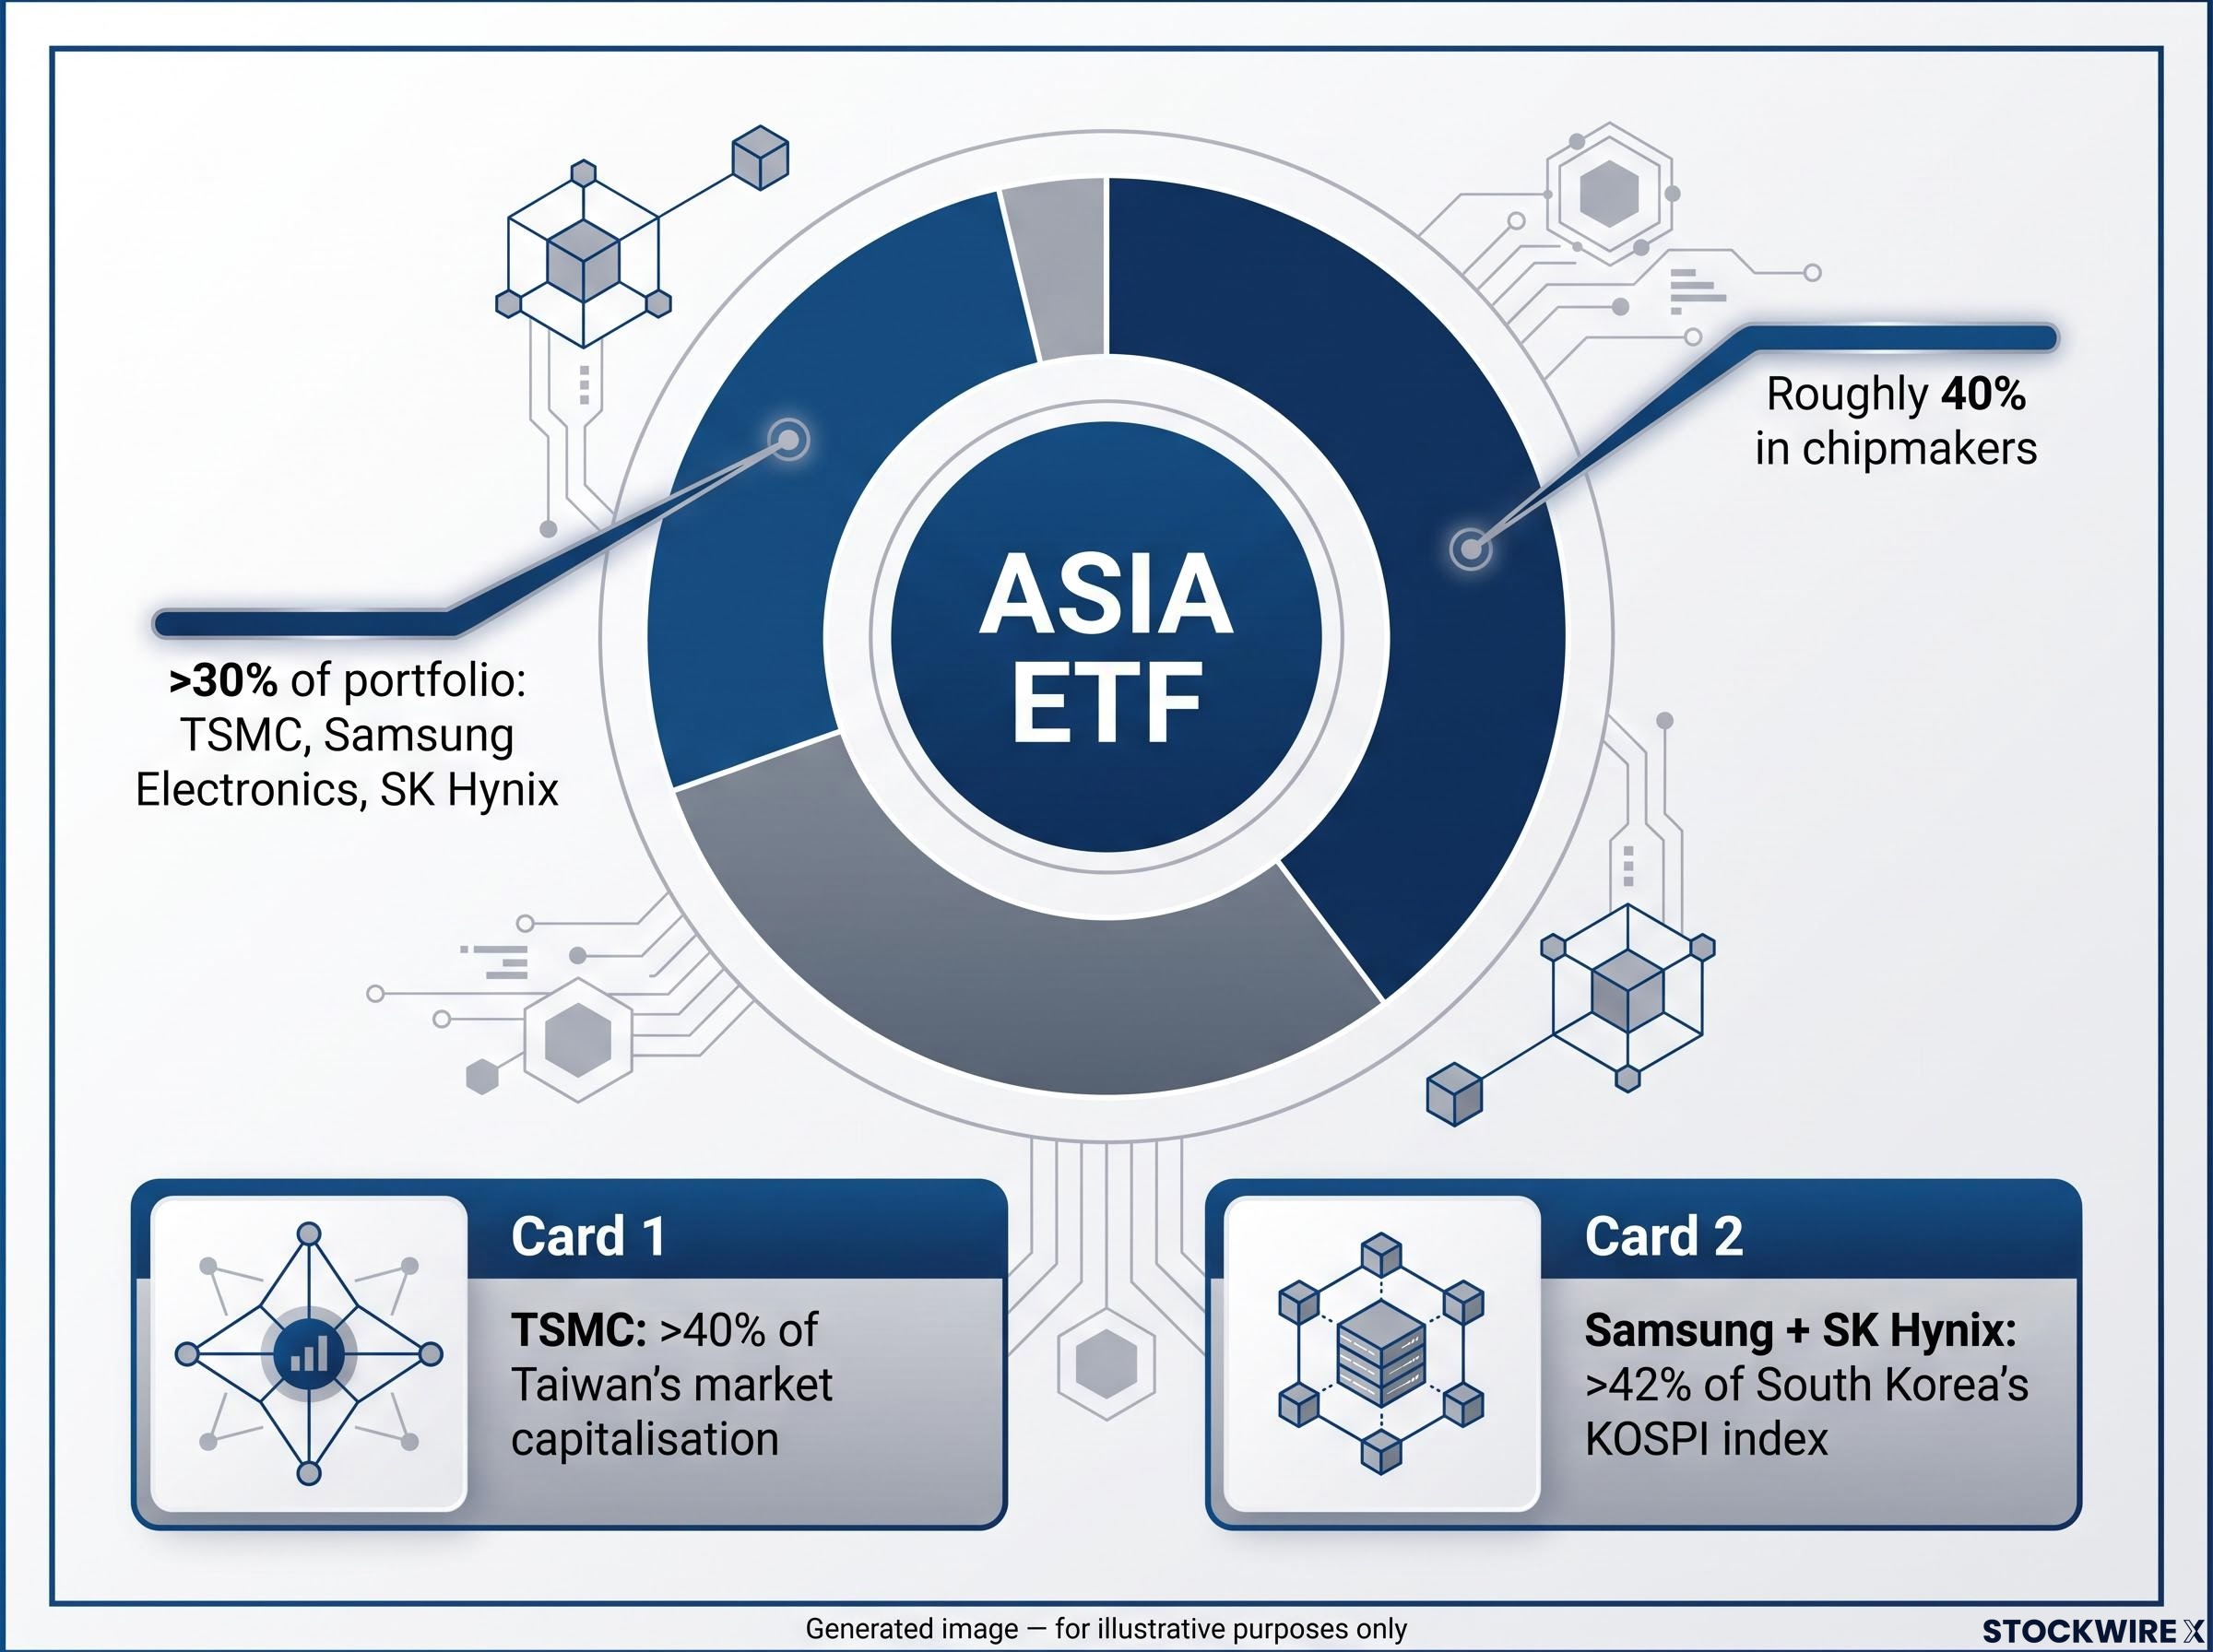
ASIA is a semiconductor and AI-hardware play. It tracks the 50 largest technology and online retail companies across Asia excluding Japan, with roughly 40% of the portfolio in chipmakers, making it a direct route into the hardware side of the AI theme rather than US software.
BEMG is a broader emerging-market bet anchored in Asian technology and financials. It spans large and mid-cap equities across 24 emerging market nations, though Taiwan, South Korea, China, and India together make up close to 80% of the fund, concentrating the exposure in Asia’s growth engines.
HVLU is a disciplined value screen across developed markets. It holds around 250 large and mid-cap companies selected on MSCI value scores, with currency fully hedged back to the Australian dollar to strip out exchange-rate noise from the equity return.
The investment logic behind each fund, and where the risks sit
You have seen the returns. Now the mechanics that explain them, and the concentrations that could unwind them. For each fund, the risk is not boilerplate. It is a specific signal about what would have to change to turn a 2026 winner into a 2027 detractor.
ASIA’s returns trace almost entirely to the AI infrastructure build-out. TSMC, Samsung Electronics, and SK Hynix together represent more than 30% of the portfolio, and all three are direct beneficiaries of surging data-centre and high-bandwidth memory demand. That is also the vulnerability. TSMC alone accounts for more than 40% of Taiwan’s market capitalisation, and Samsung plus SK Hynix make up over 42% of South Korea’s KOSPI index, so the fund is effectively a leveraged bet on a handful of mega-cap chipmakers.
The semiconductor concentration inside ASIA runs deeper than the top-line holdings suggest: SK Hynix and Samsung together accounted for over 37% of the portfolio as of the March 2026 review, making the fund’s risk profile more analogous to a chipmaker pair trade than a diversified regional technology exposure.
BEMG rides the same theme but spreads it. Taiwan and South Korea are heavy weights, giving it exposure to the AI hardware story, but its reach into India and financials across 24 nations offers slightly more diversification within the emerging-markets sleeve. It is the more balanced way to hold the trade, at the cost of some upside concentration.
HVLU’s logic is different. Value is a pro-cyclical factor that has historically outperformed during periods of rising yields, and the current regime of higher interest rates and normalising inflation is viewed as supportive. The AUD hedge matters here too: 68% of Australian advisers prefer hedged or dynamically hedged exposure, and unhedged funds saw returns eroded when the US dollar weakened against the Australian dollar, at a hedging cost of only about 0.03%-0.10% per annum.
The fund-specific risks break down cleanly:
- ASIA: Extreme single-theme concentration in AI hardware, sensitivity to Chinese regulatory shifts, and crowding risk as foreign investors begin trimming chip winners.
- BEMG: Broad emerging-market exposure to currency, political, and capital-control risk, plus the same AI-hardware concentration through its Taiwan and Korea weights.
- HVLU: Value traps (cheap stocks that stay cheap for good reason) and style drift, as some value ETFs now hold more than a quarter of their portfolios in tech-adjacent names.
A Morningstar strategist profile in early September 2026 warned that the semiconductor rally had become excessively concentrated and vulnerable to any slowdown in AI capital expenditure or a negative macro surprise.
That warning is the most credible bearish signal in the picture, and it applies most directly to ASIA and, by extension, to BEMG.
What an Australian investor needs to weigh before acting
The analysis converts into a decision. Sizing a position in any of these funds is not just buying performance, it is taking an implicit bet, so the choice to add offshore exposure should run through a structured checklist rather than a performance chase.
- Make currency an active decision. Whether to hold hedged or unhedged exposure is a separate risk call from the underlying equity allocation. If the Australian dollar strengthens, unhedged foreign returns shrink; if it weakens, they grow. Decide this explicitly rather than letting the ETF label decide for you.
- Compare the fee drag. Broad index ETFs run at roughly 0.03%-0.20% per annum, while thematic funds like ASIA and BEMG sit closer to 0.30%-0.70%. The gap is defensible for targeted exposure, but only if you are consciously paying for it.
- Plan for the tax treatment. Under ATO guidance, foreign-sourced ETF income must be reported as foreign income, and foreign-domiciled funds often require you to self-record distributions. Where withholding tax has been paid overseas, the Foreign Income Tax Offset may apply.
- Assign a portfolio role. Use broad, low-cost global ETFs such as BGBL, VGS, or IVV as the core international holding, with ASIA, BEMG, or HVLU as satellite positions sized for their higher volatility and concentration.
That last point is where the data cautions against overcorrection. Australian advisers still maintain roughly a 50/50 split between domestic and international equities, and flows briefly reverted toward local shares around the May 2026 Federal Budget. The optimal move is to diversify, not to abandon domestic exposure. A reader who works through these four questions is making an allocation decision, not chasing a chart.
For readers wanting a full structural framework before acting on the allocation decision, our dedicated guide to investing in international shares from Australia covers the core-satellite split, the two-ETF international sleeve approach, and the ATO reporting obligations that come with foreign-sourced ETF income.
Where the offshore rotation goes from here, and what that means now
The honest read holds two truths in tension. The structural case for continuing the rotation is real, and so are the near-term concentration risks in the funds leading it.
AI portfolio concentration has a way of compounding invisibly: a standard multi-asset portfolio holding ASIA in equities, data-centre REITs in property, and infrastructure ETFs can be running the same thematic bet on hyperscaler capital expenditure through every sleeve simultaneously, long before any single position triggers a warning.
On the bullish side, the AI capital expenditure cycle, a macro regime that favours value, and hard adviser conviction (67% planning to increase international allocations) could sustain the shift into 2027. Total ETF assets sit near $382 billion and climbing, with international equities the dominant category. None of that is a certainty, but it is a genuine tailwind.
The conditions that would pressure the leaders are equally specific:
- AI capex slowdown: The primary risk to ASIA and BEMG, given their reliance on semiconductor demand.
- Value-growth reversal: The primary risk to HVLU, whose returns depend on the value factor persisting.
- AUD appreciation: A structurally stronger Australian dollar would erode unhedged offshore returns and weaken the case against hedging.
So the forward question is not whether these funds keep rising. It is whether your current offshore allocation reflects a deliberate view or one you inherited by default. Koalagains, in its HVLU profile, recommends sizing positions prudently or waiting for a technical pullback after a strong run, and that discipline applies across all three. Decide what you are monitoring, then hold, trim, or add against it.
This article is for informational purposes only and should not be considered financial advice. Investors should conduct their own research and consult with financial professionals before making investment decisions. Past performance does not guarantee future results. Financial projections are subject to market conditions and various risk factors.