Taiwan’s central bank has just revised its 2026 growth forecast to a striking 11.48%, held its benchmark rate steady for the tenth consecutive quarter, and sits atop an economy powered by one of the strongest export runs in the region. On paper, that is a recipe for a rising currency.
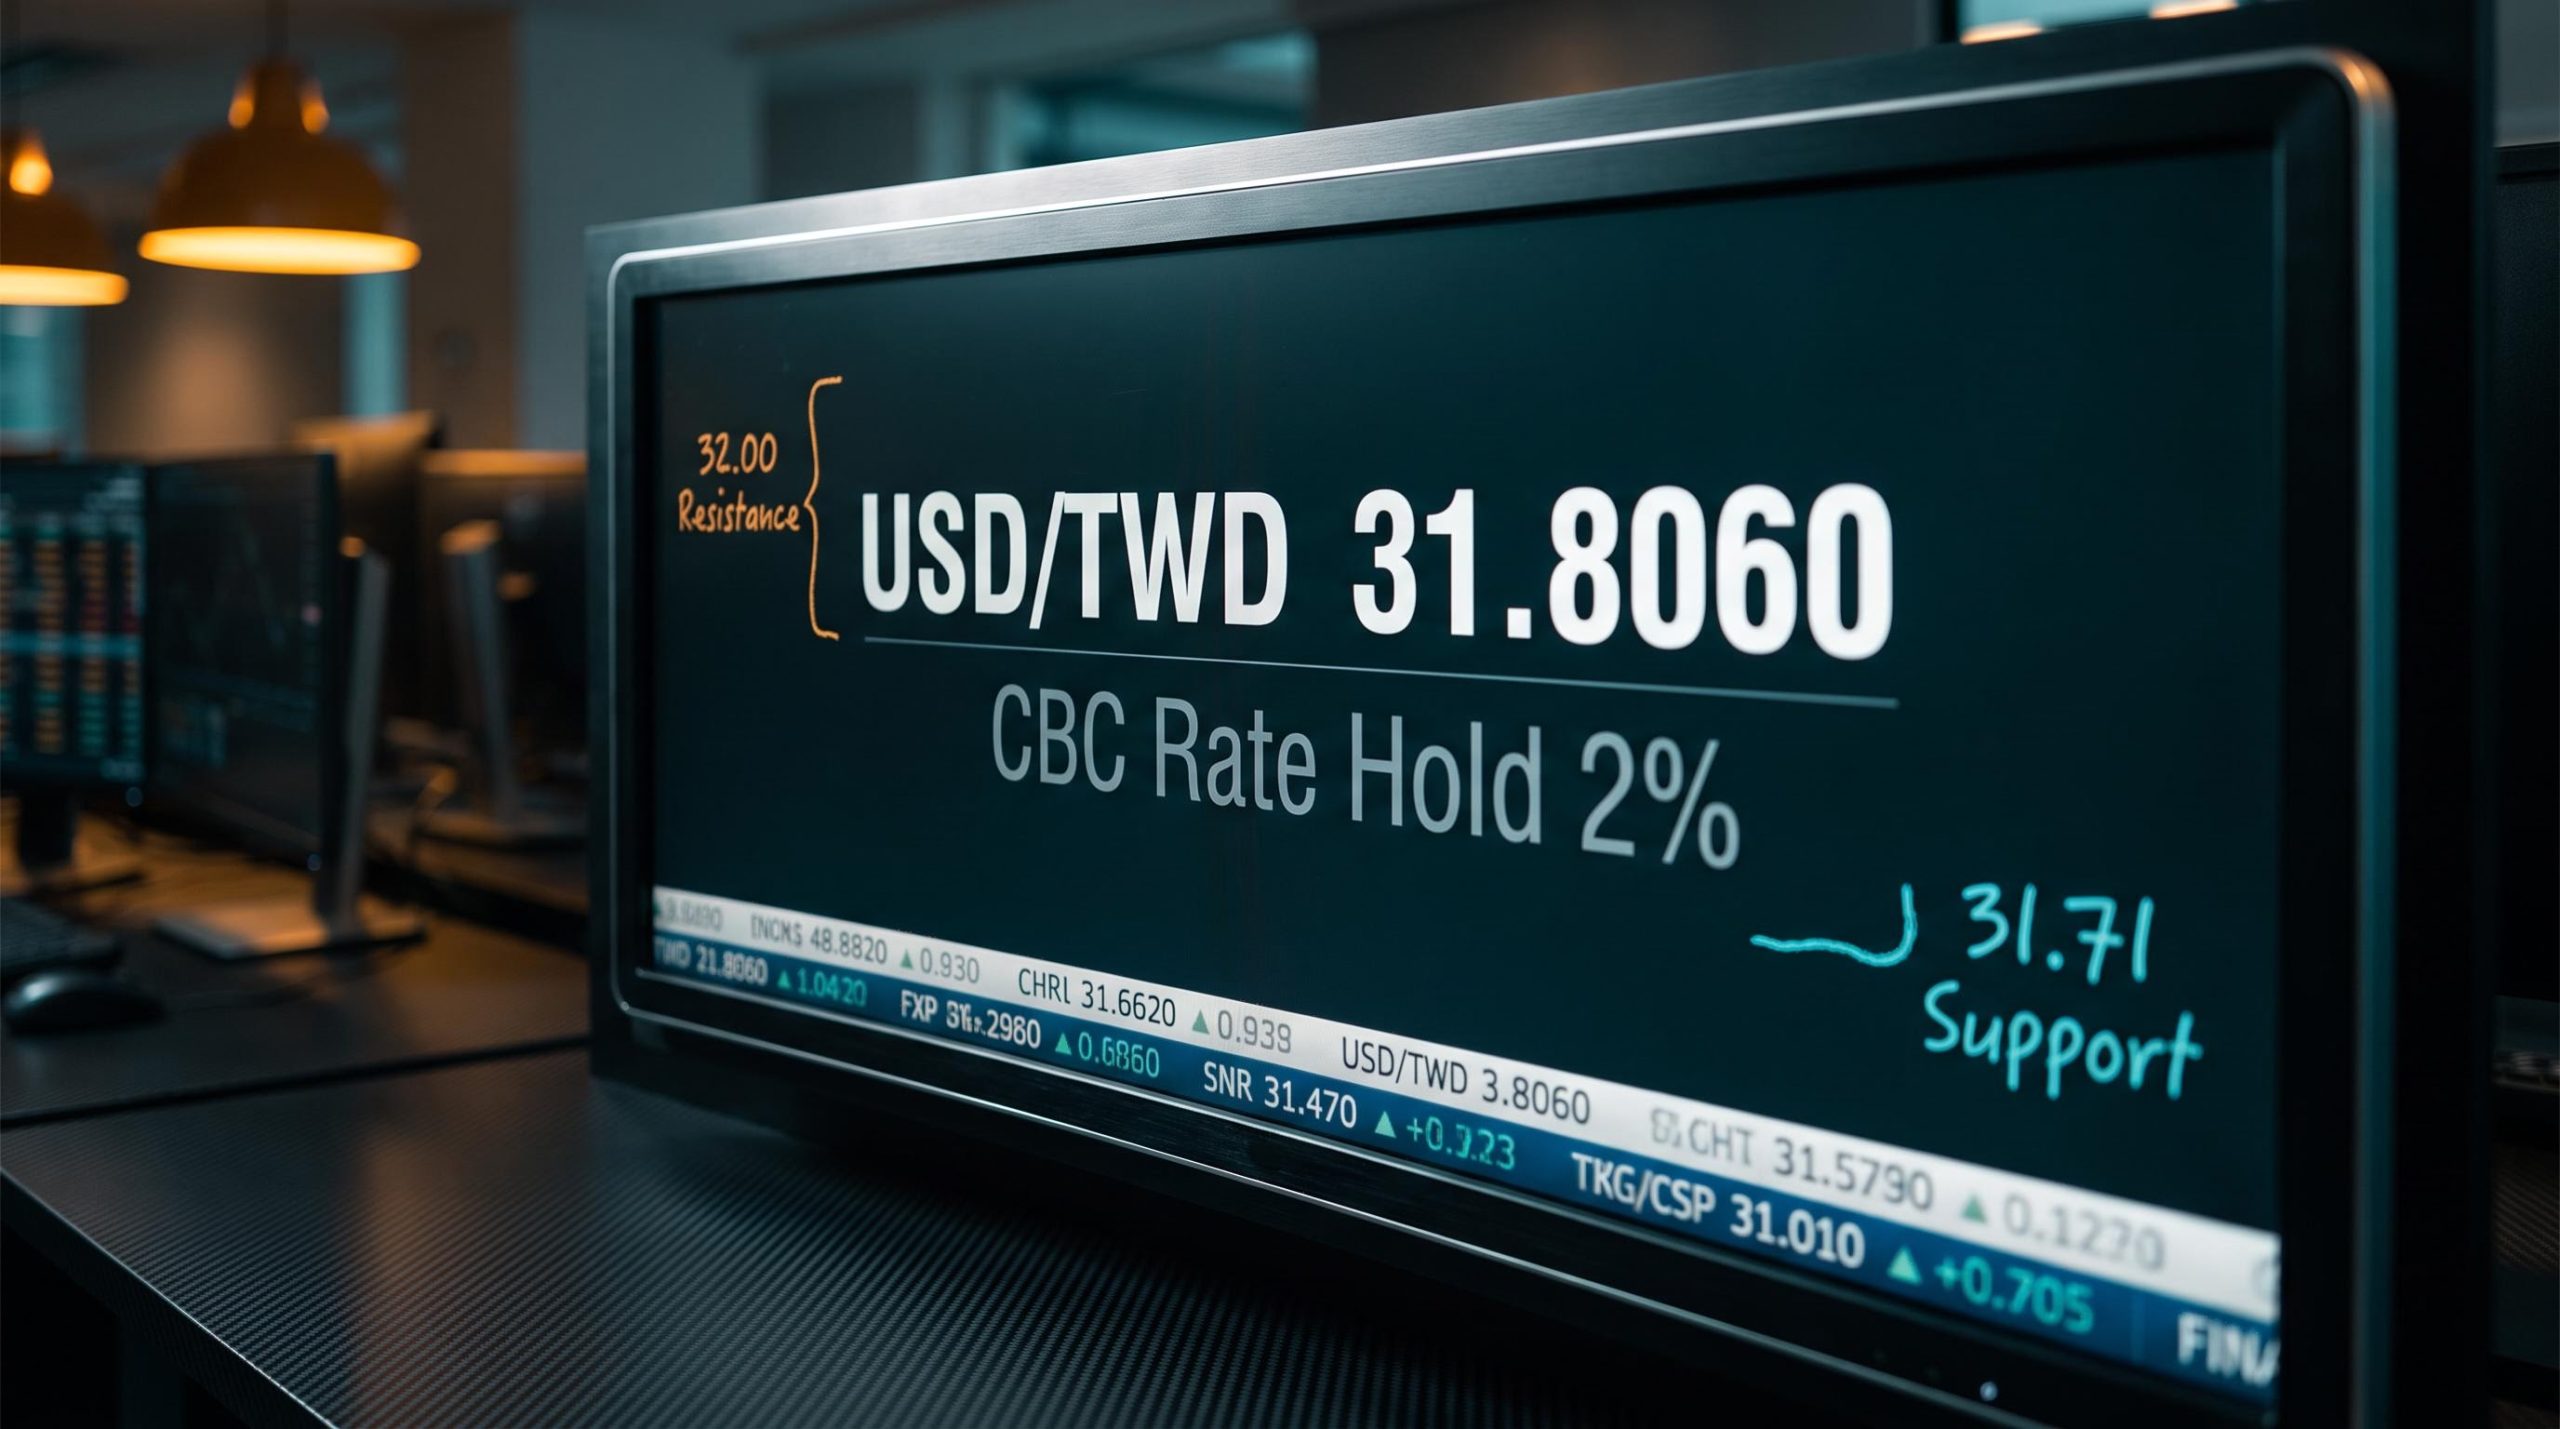
Yet the Taiwan dollar is not appreciating freely. It is trading in a tight band just below 31.81 per US dollar, hemmed in rather than let loose.
That gap between what the fundamentals suggest and what the currency is actually doing is the puzzle worth unpacking. The USD/TWD outlook in mid-September 2026 is being set by a contest between structurally supportive forces (surging AI-driven exports, a large current account surplus) and a set of countervailing pressures (central bank intervention, dividend outflows, carry-trade dynamics, and a resilient post-FOMC dollar).
What follows gives you a layered picture of the three forces actively competing to set USD/TWD direction, including the specific levels where each force tends to show its hand.
What the CBC’s tenth consecutive hold actually signals
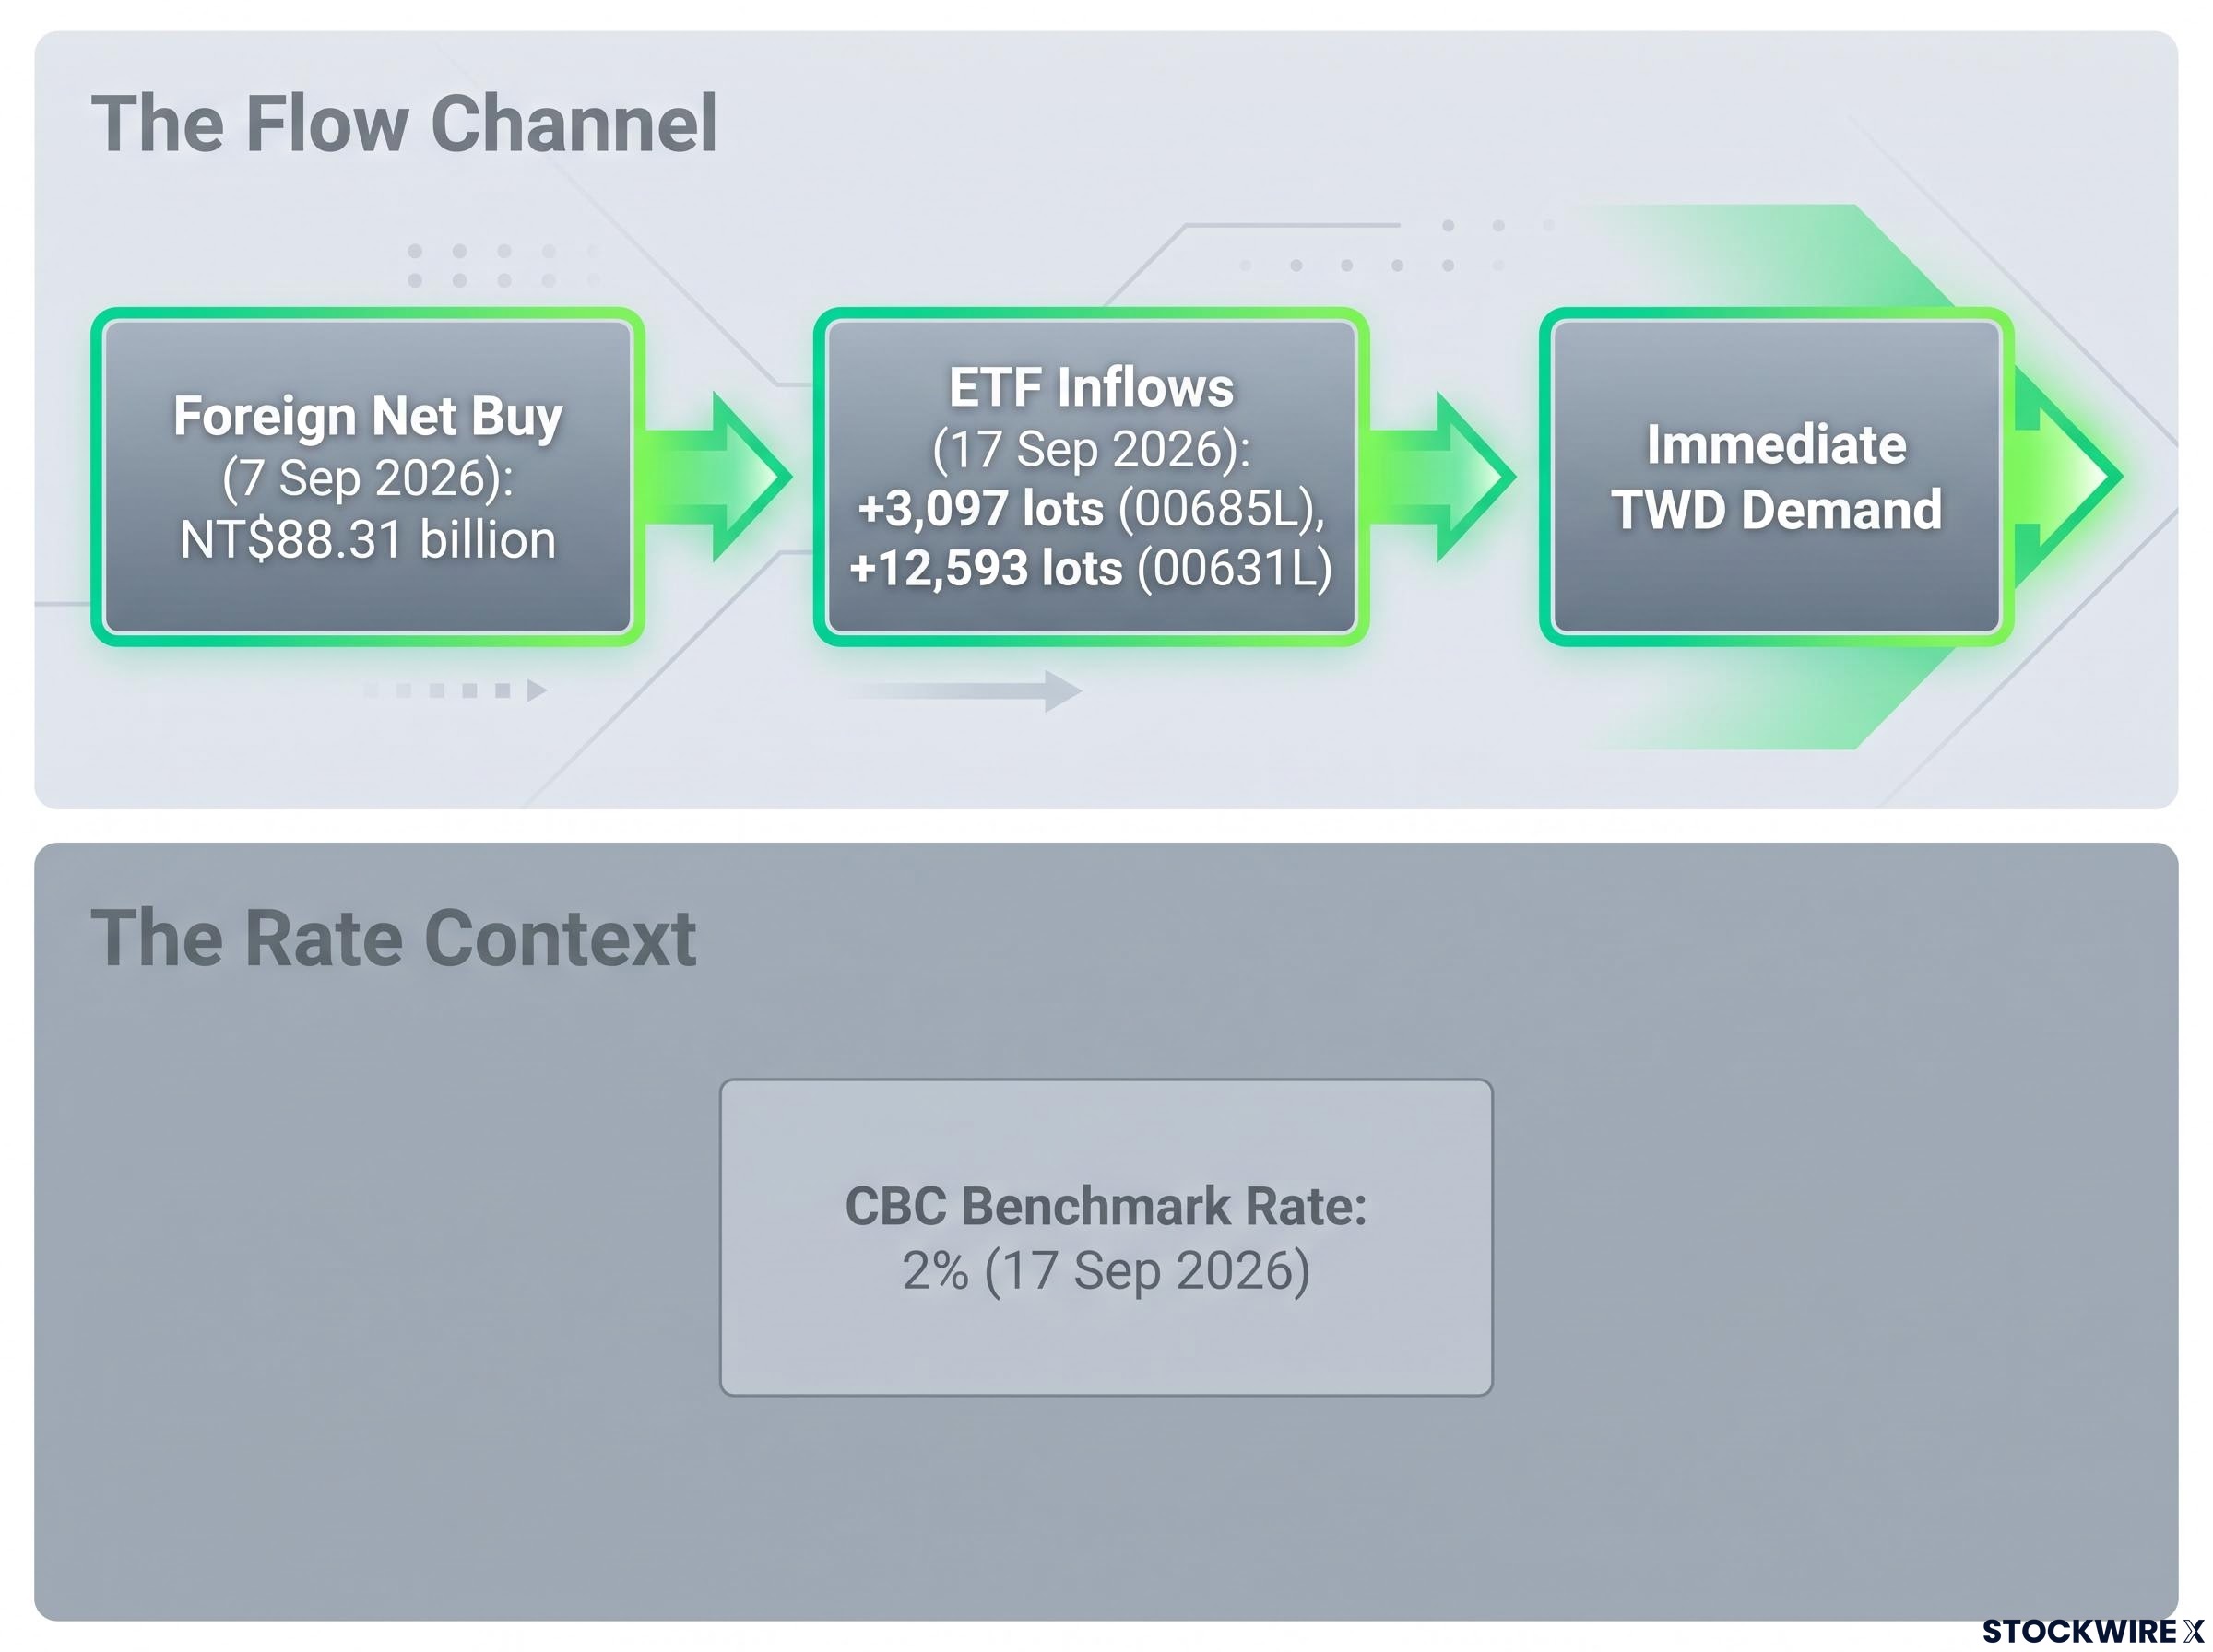
The Central Bank of the Republic of China (CBC) left its benchmark rate at 2% on 17 September 2026, the tenth straight quarter without a move. Nobody was surprised. A Commerzbank FX strategy note dated 26 August 2026, summarised by TMGM, had flagged exactly this outcome weeks in advance.
The decision itself is the least interesting part. What the CBC said around it, and what it has been doing in the market, is where the signal sits.
The tone leaned modestly hawkish rather than neutral. The CBC singled out persistent services inflation as an ongoing concern, but stopped well short of hinting at a hike. Read together, the three takeaways look like this:
- Rate unchanged at 2%, extending the longest policy pause in years.
- A hawkish undertone, driven by sticky services inflation, not a signal of imminent tightening.
- A confirmed intervention posture, with the CBC having stepped in during July 2026 to smooth capital-flow-driven currency volatility.
Coordinated currency intervention in August 2026, when the US joined Japan in a $59 billion single-session yen operation, demonstrated that central banks operating under different managed-float frameworks will act decisively to cap disorderly moves, a precedent that informs how seriously to take the CBC’s July 2026 smoothing operation as a signal of future willingness to act.
The growth revision is what makes that last point stand out.
Growth forecast revised to 11.48% The CBC lifted its 2026 GDP growth projection sharply at the September decision, a figure that would ordinarily argue for a stronger currency, not a managed one.
That combination is the real message for anyone positioning in the pair. According to OCBC strategist Christopher Wong, cited by the FXStreet Insights Team, the rate hold offers only limited marginal support for the Taiwan dollar in the near term. The active preference is for managed stability, not free appreciation.
What this tells you is that even a currency backed by double-digit growth will not be allowed to run. The CBC’s willingness to intervene sets a ceiling on how bullish you can reasonably be on the Taiwan dollar, no matter how good the macro data looks. Unchanged does not mean unconflicted.
When big ASX news breaks, our subscribers know first
Why equity flows, not rate spreads, move the TWD
Most G10 currency analysis starts with the interest rate differential. For the Taiwan dollar, that is the wrong starting point. To see why, follow the money at settlement.
Every time a foreign institution buys a Taiwan Stock Exchange (TWSE) listed share, it has to convert foreign currency into Taiwan dollars to settle the trade. That creates immediate, physical demand for the currency, entirely independent of where the policy rate sits.
Now put a number on it.
NT$88.31 billion in a single session Foreign institutional investors posted a net buy of that size on the TWSE main board on 7 September 2026, according to Focus Taiwan and TWSE data.
That one day of buying required a wall of Taiwan dollar demand at settlement. Compare that to a quarter-point rate decision, which nudges the currency slowly and at the margin, and the hierarchy becomes obvious. The flow moves faster and harder than the spread.
The data granularity goes further. On 17 September 2026, Goodwinlab.ai figures compiled from TWSE and TPEx post-close releases showed foreign investors net buying leveraged Taiwan equity ETFs: +3,097 lots in 00685L and +12,593 lots in 00631L. And the mechanism runs both ways. FSC regulatory statistics recorded net foreign selling of -705.34 in the regulator’s measurement unit as of 31 March 2026, a reminder that when flows reverse, the same settlement channel produces Taiwan dollar selling pressure.
| Date | Flow Event | Volume / Value | TWD Impact | Source |
|---|---|---|---|---|
| 7 Sep 2026 | Foreign net buy, TWSE main board | NT$88.31 billion | Supportive (TWD demand) | Focus Taiwan / TWSE |
| 17 Sep 2026 | Foreign net buy, leveraged ETFs | +3,097 lots (00685L); +12,593 lots (00631L) | Supportive (TWD demand) | Goodwinlab.ai / TWSE / TPEx |
| 31 Mar 2026 | Net foreign selling, TWSE-listed shares | -705.34 (FSC units) | Pressure (TWD selling) | FSC |
| Mid-Sep 2026 | Return to net buying after five outflow sessions | Direction reversal | Stabilising vs post-FOMC USD | OCBC / FXStreet |
The recent stabilisation illustrates the point neatly. After five consecutive sessions of net outflows, foreign buyers returned, and that return helped steady the Taiwan dollar against a firmer post-FOMC US dollar. Wong’s read is that near-term direction will be set primarily by these foreign equity flows and broader dollar trends, not by domestic monetary policy.
Global equity fund flows of nearly $800 billion year-to-date through August 2026 confirm that the foreign buying showing up in daily TWSE data is not a Taiwan-specific anomaly but part of a broad, Fed-pause-driven reallocation of cash into risk assets across regions.
The practical edge here is real. TWSE publishes daily net buy and sell figures for foreign investors, investment trusts, and dealers. That is a high-frequency, public signal you can monitor in near real time, and it is a more actionable input for short-term USD/TWD positioning than watching the rate spread that barely moves for quarters at a stretch.
The structural forces limiting TWD appreciation
If flows and fundamentals are so supportive, why can the Taiwan dollar not simply climb in a straight line? Because several independent forces cap its upside, and each one adds a layer to the picture.
Start with managed appreciation. The CBC’s confirmed intervention posture means strong fundamentals do not translate into unconstrained currency gains. That is a deliberate policy choice, not an accident of the market.
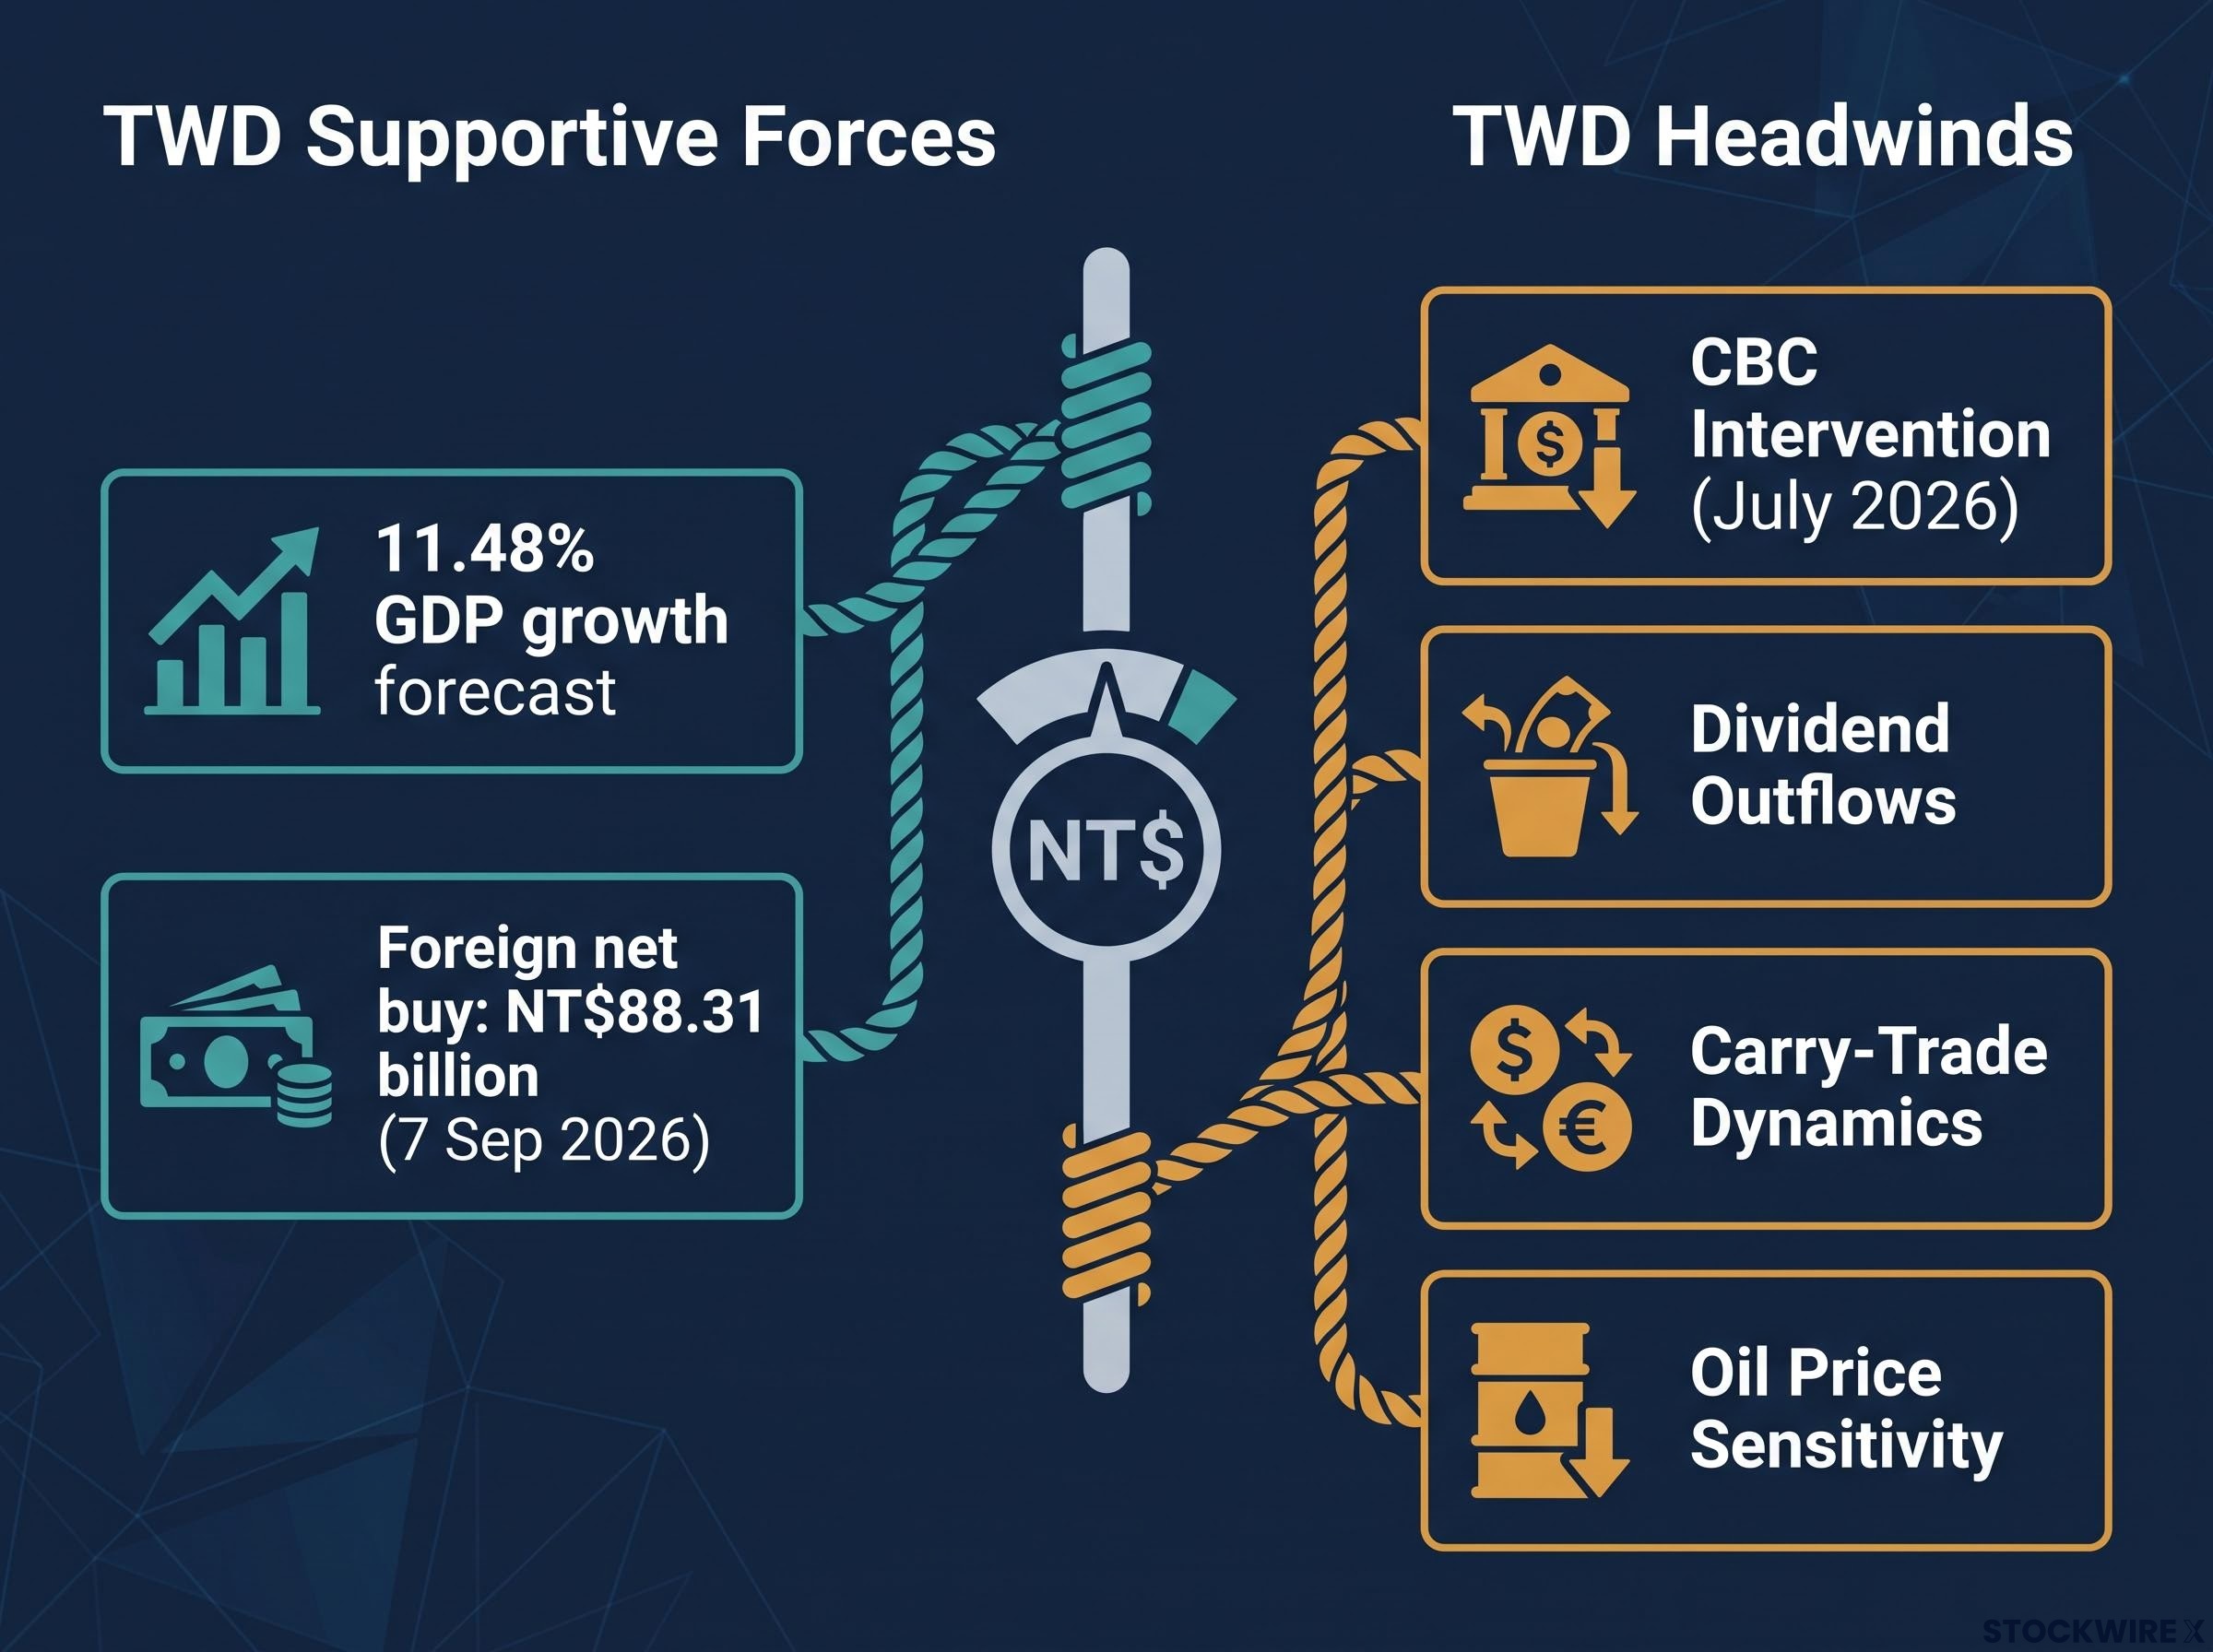
The other three headwinds operate through different channels:
- CBC intervention: smoothing operations, like the confirmed July 2026 action, deliberately slow the pace of appreciation.
- Dividend outflows: large repatriation flows around payout season can outweigh fresh equity inflows.
- Carry-trade dynamics: the low-yielding, volatile Taiwan dollar makes an attractive funding currency, so rising Fed tightening expectations trigger depreciation pressure from carry unwinds.
- Oil price sensitivity: according to Mitrade’s September 2026 commentary, higher oil prices can cap Taiwan dollar gains even when JPY strength and portfolio inflows are supportive.
The most telling detail is where the analysts converge. Three separate houses, using three different mechanisms, all point to the same neighbourhood.
Bank of America revised its year-end 2026 USD/TWD forecast up to 32.0 from 30.8, citing Fed rate expectations and the Taiwan dollar’s carry-funding profile, as reported by the Taipei Times in July 2026. Commerzbank’s Dr. Henry Hao and Charlie Lay expect the CBC to keep intervening to smooth appreciation, and put the consolidation range at 31.50-32.00. When three independent analysts identify different reasons for the same ceiling near 32.0, that tells you the upside for the currency is structurally bounded, even in a strong-growth environment.
The dollar’s 2026 rebound, anchored by the June FOMC’s hawkish dot plot under Fed Chair Kevin Warsh and a DXY that Morningstar estimates is approximately 15% overvalued, is one of the external forces that has kept USD/TWD elevated even as Taiwan’s own fundamentals argued for TWD appreciation.
Why dividends, not just yields, matter for TWD
Dividend repatriation is worth isolating because it behaves nothing like a yield differential. A rate spread exerts a continuous, small pull. Dividend outflows arrive as discrete, periodic, large-volume events, concentrated around payout seasons, which creates predictable windows of currency pressure.
The mechanism runs through the same settlement channel as equity buying, only in reverse. When foreign recipients convert their Taiwan dollar dividends back into foreign currency, they generate sustained USD/TWD demand.
The dividend thesis BNP Paribas strategist Chandresh Jain argued in July 2026 that record dividend payouts by Taiwanese companies could weigh more heavily on the currency than equity inflows, potentially pushing USD/TWD toward the 32-per-dollar area and creating a rough patch despite otherwise supportive fundamentals.
That is the most counterintuitive of the four forces: the very success that pays those dividends is what can pressure the currency when the cash goes home.
Technical levels defining the near-term USD/TWD range
The technical picture is best read as a map with boundaries, not a forecast. USD/TWD closed at 31.7870 on 18 September 2026, a 0.27% daily decline, with Investing.com quoting spot around 31.806 against a prior close of 31.872. That places the pair between two support zones, with daily momentum still bullish but the RSI easing back from near-overbought territory.
What makes the identified levels carry weight is confluence. When two independent indicators line up at the same price zone, that level matters more than one flagged by a single signal.
| Level Type | Price Zone | Technical Basis | Implication |
|---|---|---|---|
| Resistance | 31.90-32.00 | 38.2% Fibonacci retracement + 50-day MA | Critical test for bullish extension |
| Current spot | 31.7870 | 18 Sep 2026 close | Sitting between support zones |
| Primary support | 31.83-31.86 | 100-day MA + 50% Fibonacci retracement | First floor on any pullback |
| Secondary support | 31.71-31.73 | 21-day and 200-day MAs + 61.8% Fibonacci | Structural level if flows weaken |
The analyst ranges frame the same territory: Commerzbank at 31.50-32.00, Mitrade at 31.30-31.80, with a three-month low near 31.55. With the spot price sitting between two supports, RSI moderating, and daily momentum intact but slowing, according to OCBC’s Wong via FXStreet, the base case reads as consolidation rather than breakout.
For positioning, three scenarios frame the coming sessions:
- Spot holds primary support at 31.83-31.86 and drifts toward the 31.90-32.00 resistance on renewed dollar strength.
- Spot breaks to secondary support at 31.71-31.73 if foreign equity flows reverse and selling resumes.
- Spot clears 32.00 on sustained dollar strength, confirming the consolidation range has shifted higher.
A break below 31.71 on sustained foreign selling would be a structurally meaningful signal, not routine noise. A push through 32.00 would tell you the range itself has moved up.
For investors wanting to apply the same Fibonacci and moving average logic across other currency pairs, our comprehensive walkthrough of currency technical analysis frameworks uses a live GBP/USD setup to show how moving average configuration, RSI failure swing checks, and layered support mapping work together in a repeatable four-step process.
What shifts the range and what to monitor through the rest of 2026
The consolidation will not last forever. What resolves it, and in which direction, comes down to a handful of specific catalysts you can actually track.
The forces are best split into two camps:
- TWD-strengthening catalysts: a sustained return to foreign equity net buying on the TWSE; a retreat or stabilisation in US Treasury yields after the post-FOMC move.
- TWD-weakening catalysts: renewed or sustained foreign equity outflows; continued Fed tightening expectations that reinforce carry dynamics; concentrated dividend repatriation flows; any escalation in oil prices that erodes Taiwan’s trade balance advantage.
The upper boundary is where the analysts agree.
Bank of America’s year-end target: 32.0 Revised up from 30.8, this level sits alongside Commerzbank’s near-term ceiling of 32.00. A sustained move there would mark the current range being broken, not a routine fluctuation.
That convergence matters for how you read any move toward 32.0. Treat it as a structural test of whether CBC intervention capacity and equity inflow momentum can hold the range, rather than as ordinary drift. The July 2026 smoothing operation sets the expectation that sharp moves in either direction will draw a policy response.
Mitrade frames the near-term band at 31.30-31.80, with JPY strength and oil prices as the key swing variables. Wong’s warning is the one to keep front of mind: renewed foreign equity outflows would likely sustain upward pressure on USD/TWD.
For anyone with exposure to Taiwan equity or currency markets, the monitoring checklist beats any single forecast number. Four inputs will decide whether the pair holds its band or shifts entirely: daily TWSE flow data, US Treasury yield direction, oil price moves, and CBC communication.
Past performance does not guarantee future results. Financial projections are subject to market conditions and various risk factors, and forecasts cited here are speculative and subject to change based on market developments.
Reading USD/TWD in the second half of 2026
Pull the three threads together and a coherent picture emerges. The CBC’s managed-appreciation posture defines the policy ceiling. Foreign equity flows are the dominant short-term price driver. The technical levels mark the specific boundaries within which those flows are currently playing out.
That makes this an unusual currency pair. Its short-term price action is more directly tied to publicly available, daily equity flow data than to the interest rate spread that dominates most G10 analysis. For anyone who knows where to look, that makes USD/TWD unusually legible in real time.
The range anchors are worth holding in mind: Commerzbank’s 31.50-32.00, secondary technical support at 31.71-31.73, and the 32.00 level flagged as both Bank of America’s year-end target and Commerzbank’s ceiling. A 11.48% growth forecast is what makes the equity flow story credible in the first place, while the CBC’s intervention precedent is the constraint that stops either side of the range breaking cleanly.
The signals to watch through the rest of 2026:
- Daily TWSE institutional flow data for the direction of foreign buying.
- US Treasury yield moves following post-FOMC dynamics.
- Oil prices as a cap on Taiwan dollar gains.
- CBC communication and any fresh smoothing operations.
The open question is whether AI-driven export growth keeps attracting equity inflows at sufficient scale to offset dividend repatriation and carry pressures, or whether those outflow forces begin to dominate while the CBC holds rates steady. Strong macro numbers alone will not answer it. Watching the flows and the technicals together will.
This article is for informational purposes only and should not be considered financial advice. Investors should conduct their own research and consult with financial professionals before making investment decisions.