When 85% Growth Isn’t Enough: AI Stocks Priced for Perfection
2 hrs ago


Telstra shares are trading at approximately $5.38, within touching distance of their 52-week high of $5.58, yet the stock’s current dividend yield of roughly 3.41% sits fractionally below its five-year historical average of 3.62%. For income-focused investors, that divergence is the opening question worth examining. Telstra has delivered consistent earnings growth through 1H FY26, expanded its buyback programme, and tightened full-year guidance, all while reinforcing structural advantages in mobile coverage and 5G rollout. The stock is not obviously cheap or obviously expensive on a yield basis alone, which makes the analytical case more interesting than a simple buy or sell call. What follows walks through what Telstra’s network scale, revenue model, recent financial performance, and dividend yield history collectively reveal about whether TLS is fairly valued at current levels, using dividend yield as the primary valuation lens alongside supporting financial metrics.
Comparing a stock’s current dividend yield to its historical average functions as a rapid preliminary valuation signal for stable, income-generating businesses. The logic is straightforward: when a yield sits below its historical average, the share price has run ahead of dividend growth, meaning the market is pricing in optimism about the company’s future.
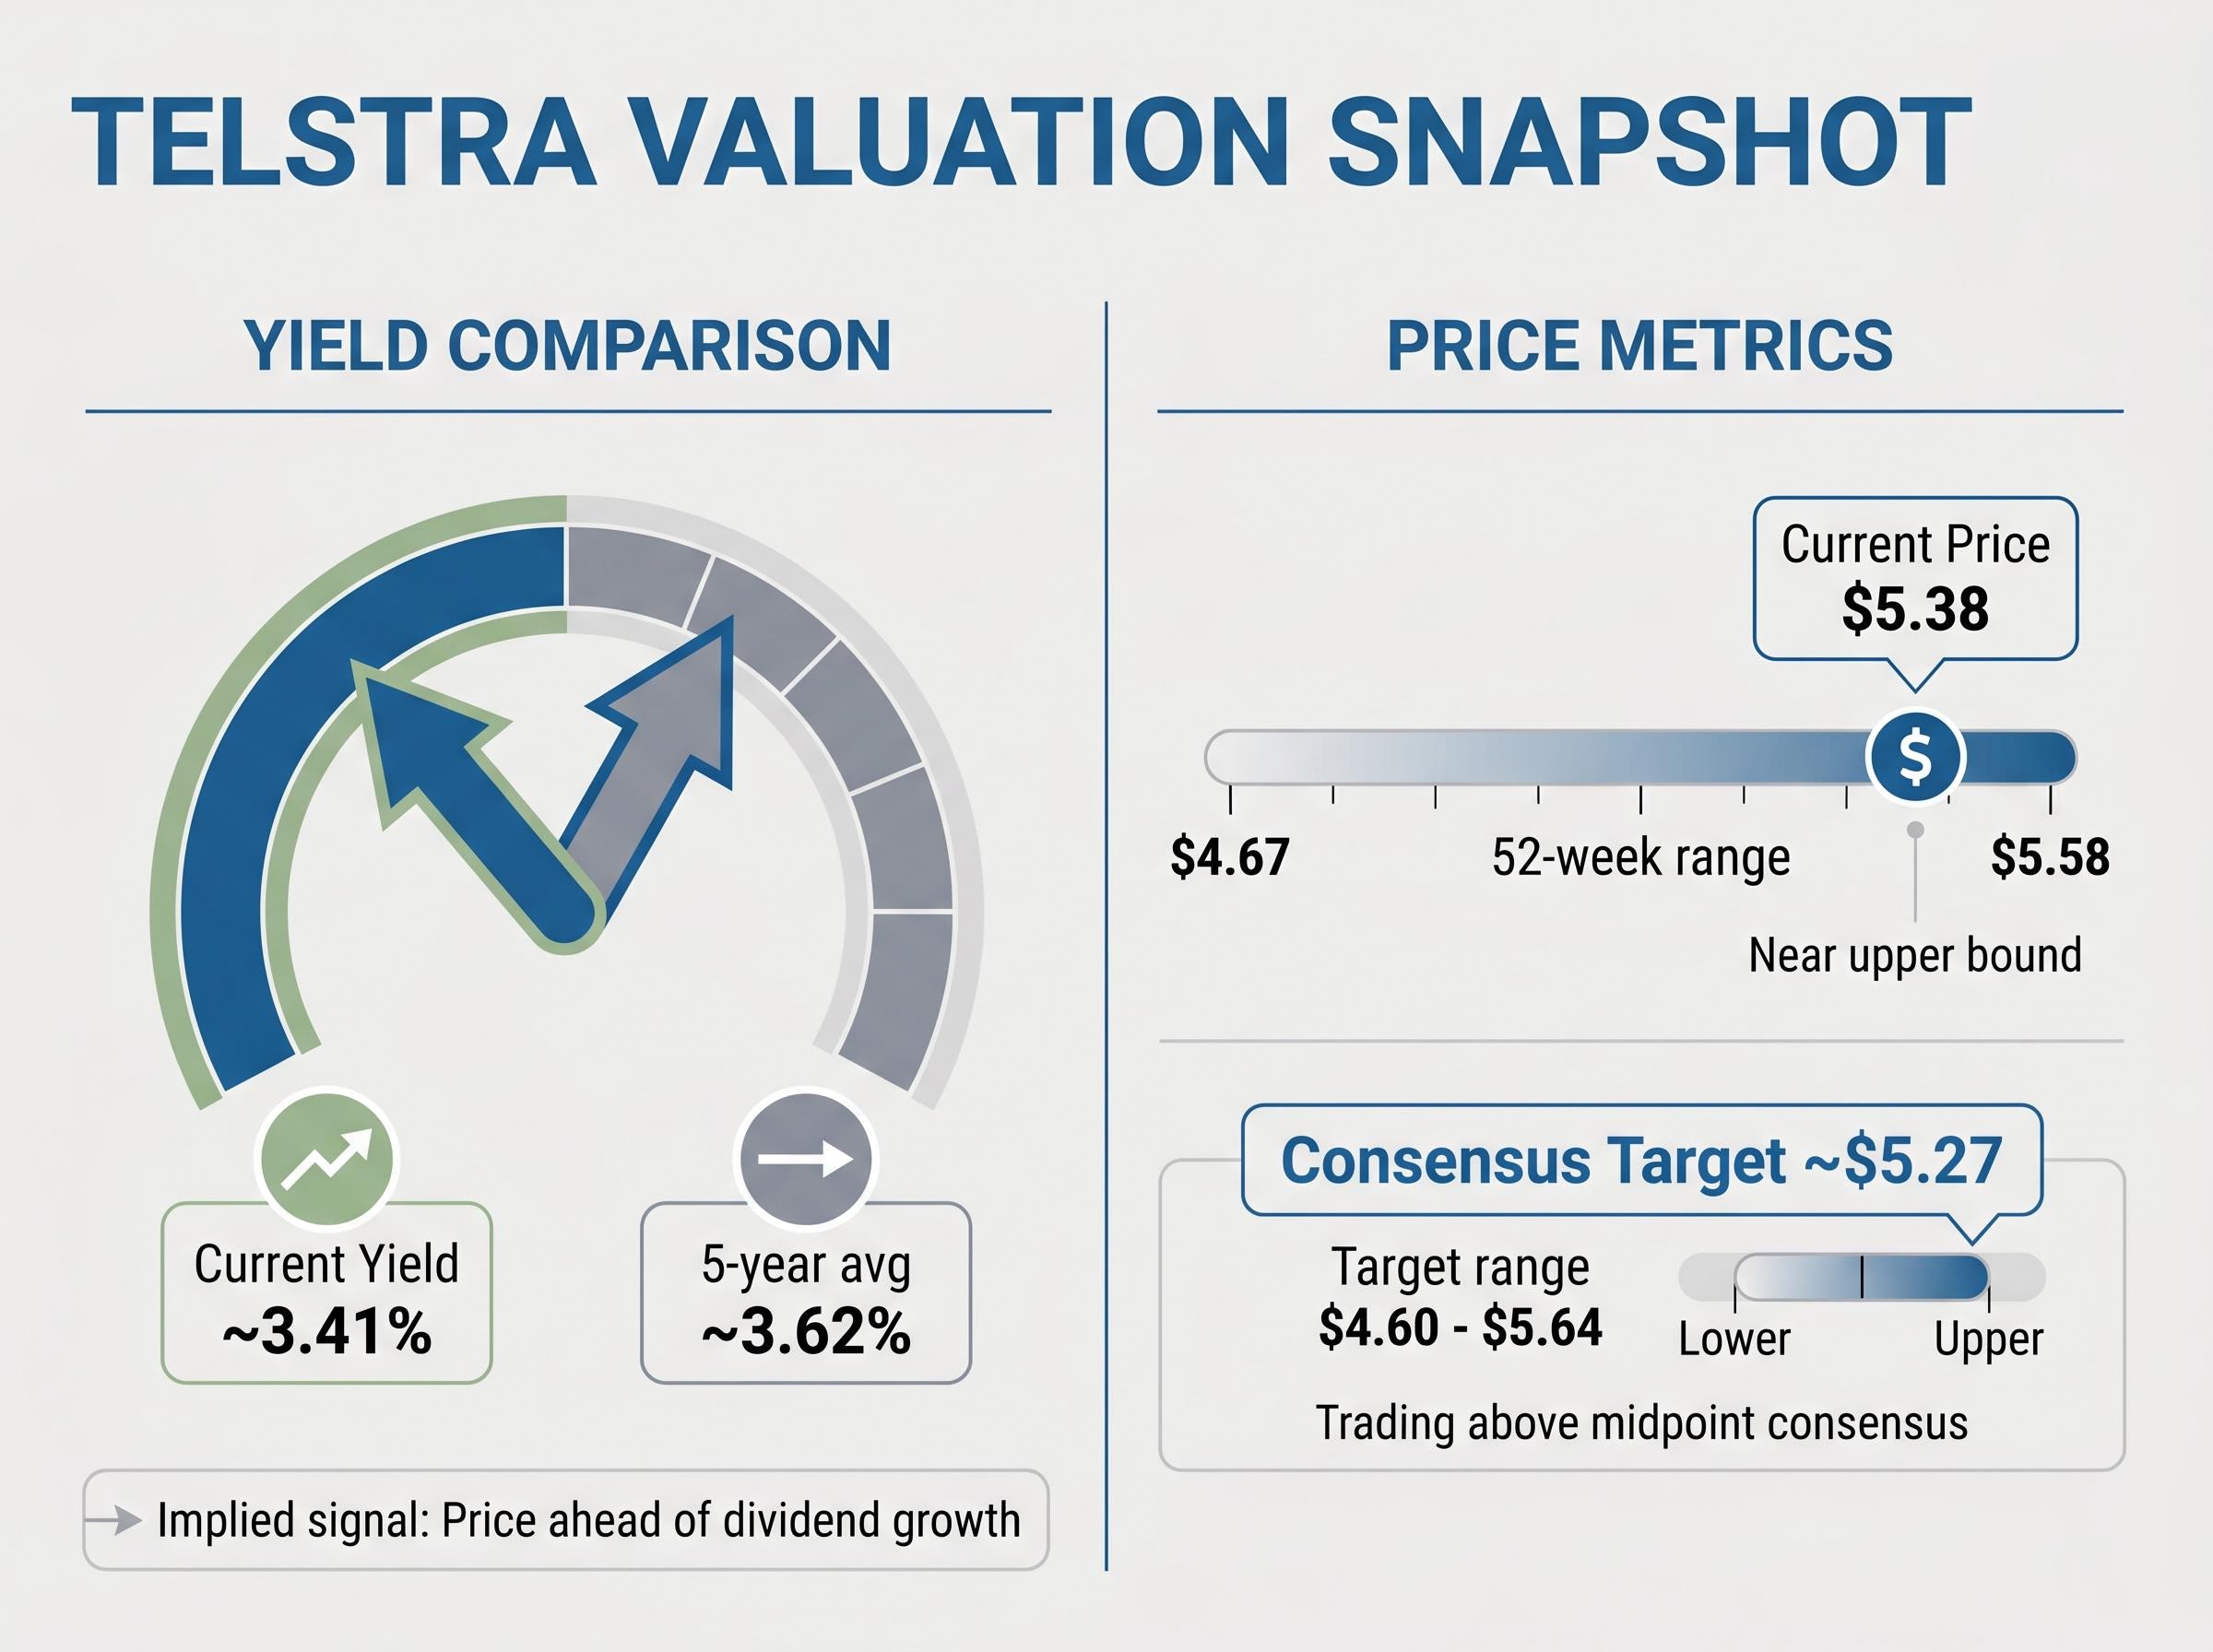
Telstra’s current yield of approximately 3.41% sits about 21 basis points below its five-year average of roughly 3.62%. Directionally, that gap suggests the share price has appreciated faster than dividends have grown.
A current yield below the historical average suggests the share price has run ahead of dividend growth, signalling the market is paying a premium for expected future returns.
Three scenarios can explain a below-average yield:
Yield analysis is one tool among several. Discounted cash flow models and dividend discount models offer greater precision. But for income investors seeking a fast read on whether Telstra looks stretched at current prices, the yield gap provides a useful starting anchor for the deeper analysis that follows.
Yield compression from share price appreciation is distinct from the more damaging scenario where rising yields are driven by a falling share price, and recognising those dividend trap signals early, including payout ratios above 100% and declining earnings coverage, is a core skill for any income-focused portfolio.
Telstra covers approximately 99.6% of the Australian population and has extended 5G access to more than 85% of Australians. Those figures are not marketing statistics. They represent physical infrastructure, spectrum holdings, and tower density that competitors cannot replicate without years of capital expenditure.
The regional network advantage is the most defensible element of that position. In areas outside major metropolitan centres, Optus and TPG/Vodafone do not compete effectively. Regional and rural coverage requires infrastructure investment that delivers lower per-subscriber returns, creating a barrier that pricing strategy alone cannot overcome.
The ACMA’s 2024-25 telecommunications trends report documents the network deployment gap between Telstra and its two principal competitors, with 5G rollout data confirming that Optus and TPG/Vodafone have concentrated investment in metropolitan corridors rather than pursuing the regional footprint that underpins Telstra’s coverage lead.
Telstra’s spectrum holdings and the pace of its 5G rollout compound the structural lead over time. Each additional year of 5G densification widens the gap rather than merely maintaining it, because spectrum is a finite, regulated resource and deployment cost advantages scale with existing tower infrastructure.
| Operator | Network coverage | 5G reach | Structural advantage |
|---|---|---|---|
| Telstra | ~99.6% population | 85%+ of Australians | Scale, spectrum depth, regional dominance |
| Optus | Metropolitan-focused | Narrower metro rollout | Price competition in urban markets |
| TPG/Vodafone | Metropolitan-focused | Limited 5G footprint | Cost-led strategy, limited regional presence |
Telstra International delivers services to governments and enterprises across more than 20 countries, diversifying revenue beyond the domestic consumer market. With more than 22.5 million retail mobile accounts domestically (as of 2023), the consumer base is already substantial, but the international enterprise segment provides resilience against purely domestic competitive pressures and ARPU erosion in mobile. It is a revenue anchor that does not depend on Australian plan pricing dynamics.
Telstra’s FY25 full-year results established the baseline. Total income reached $23.6 billion, underlying EBITDA grew 4.6% to $8.6 billion, and net profit after tax rose 1.8% to $2.3 billion. The gap between modest revenue growth and stronger profitability pointed to effective cost discipline rather than top-line momentum alone. Total dividends per share for the year came in at 19 cents.
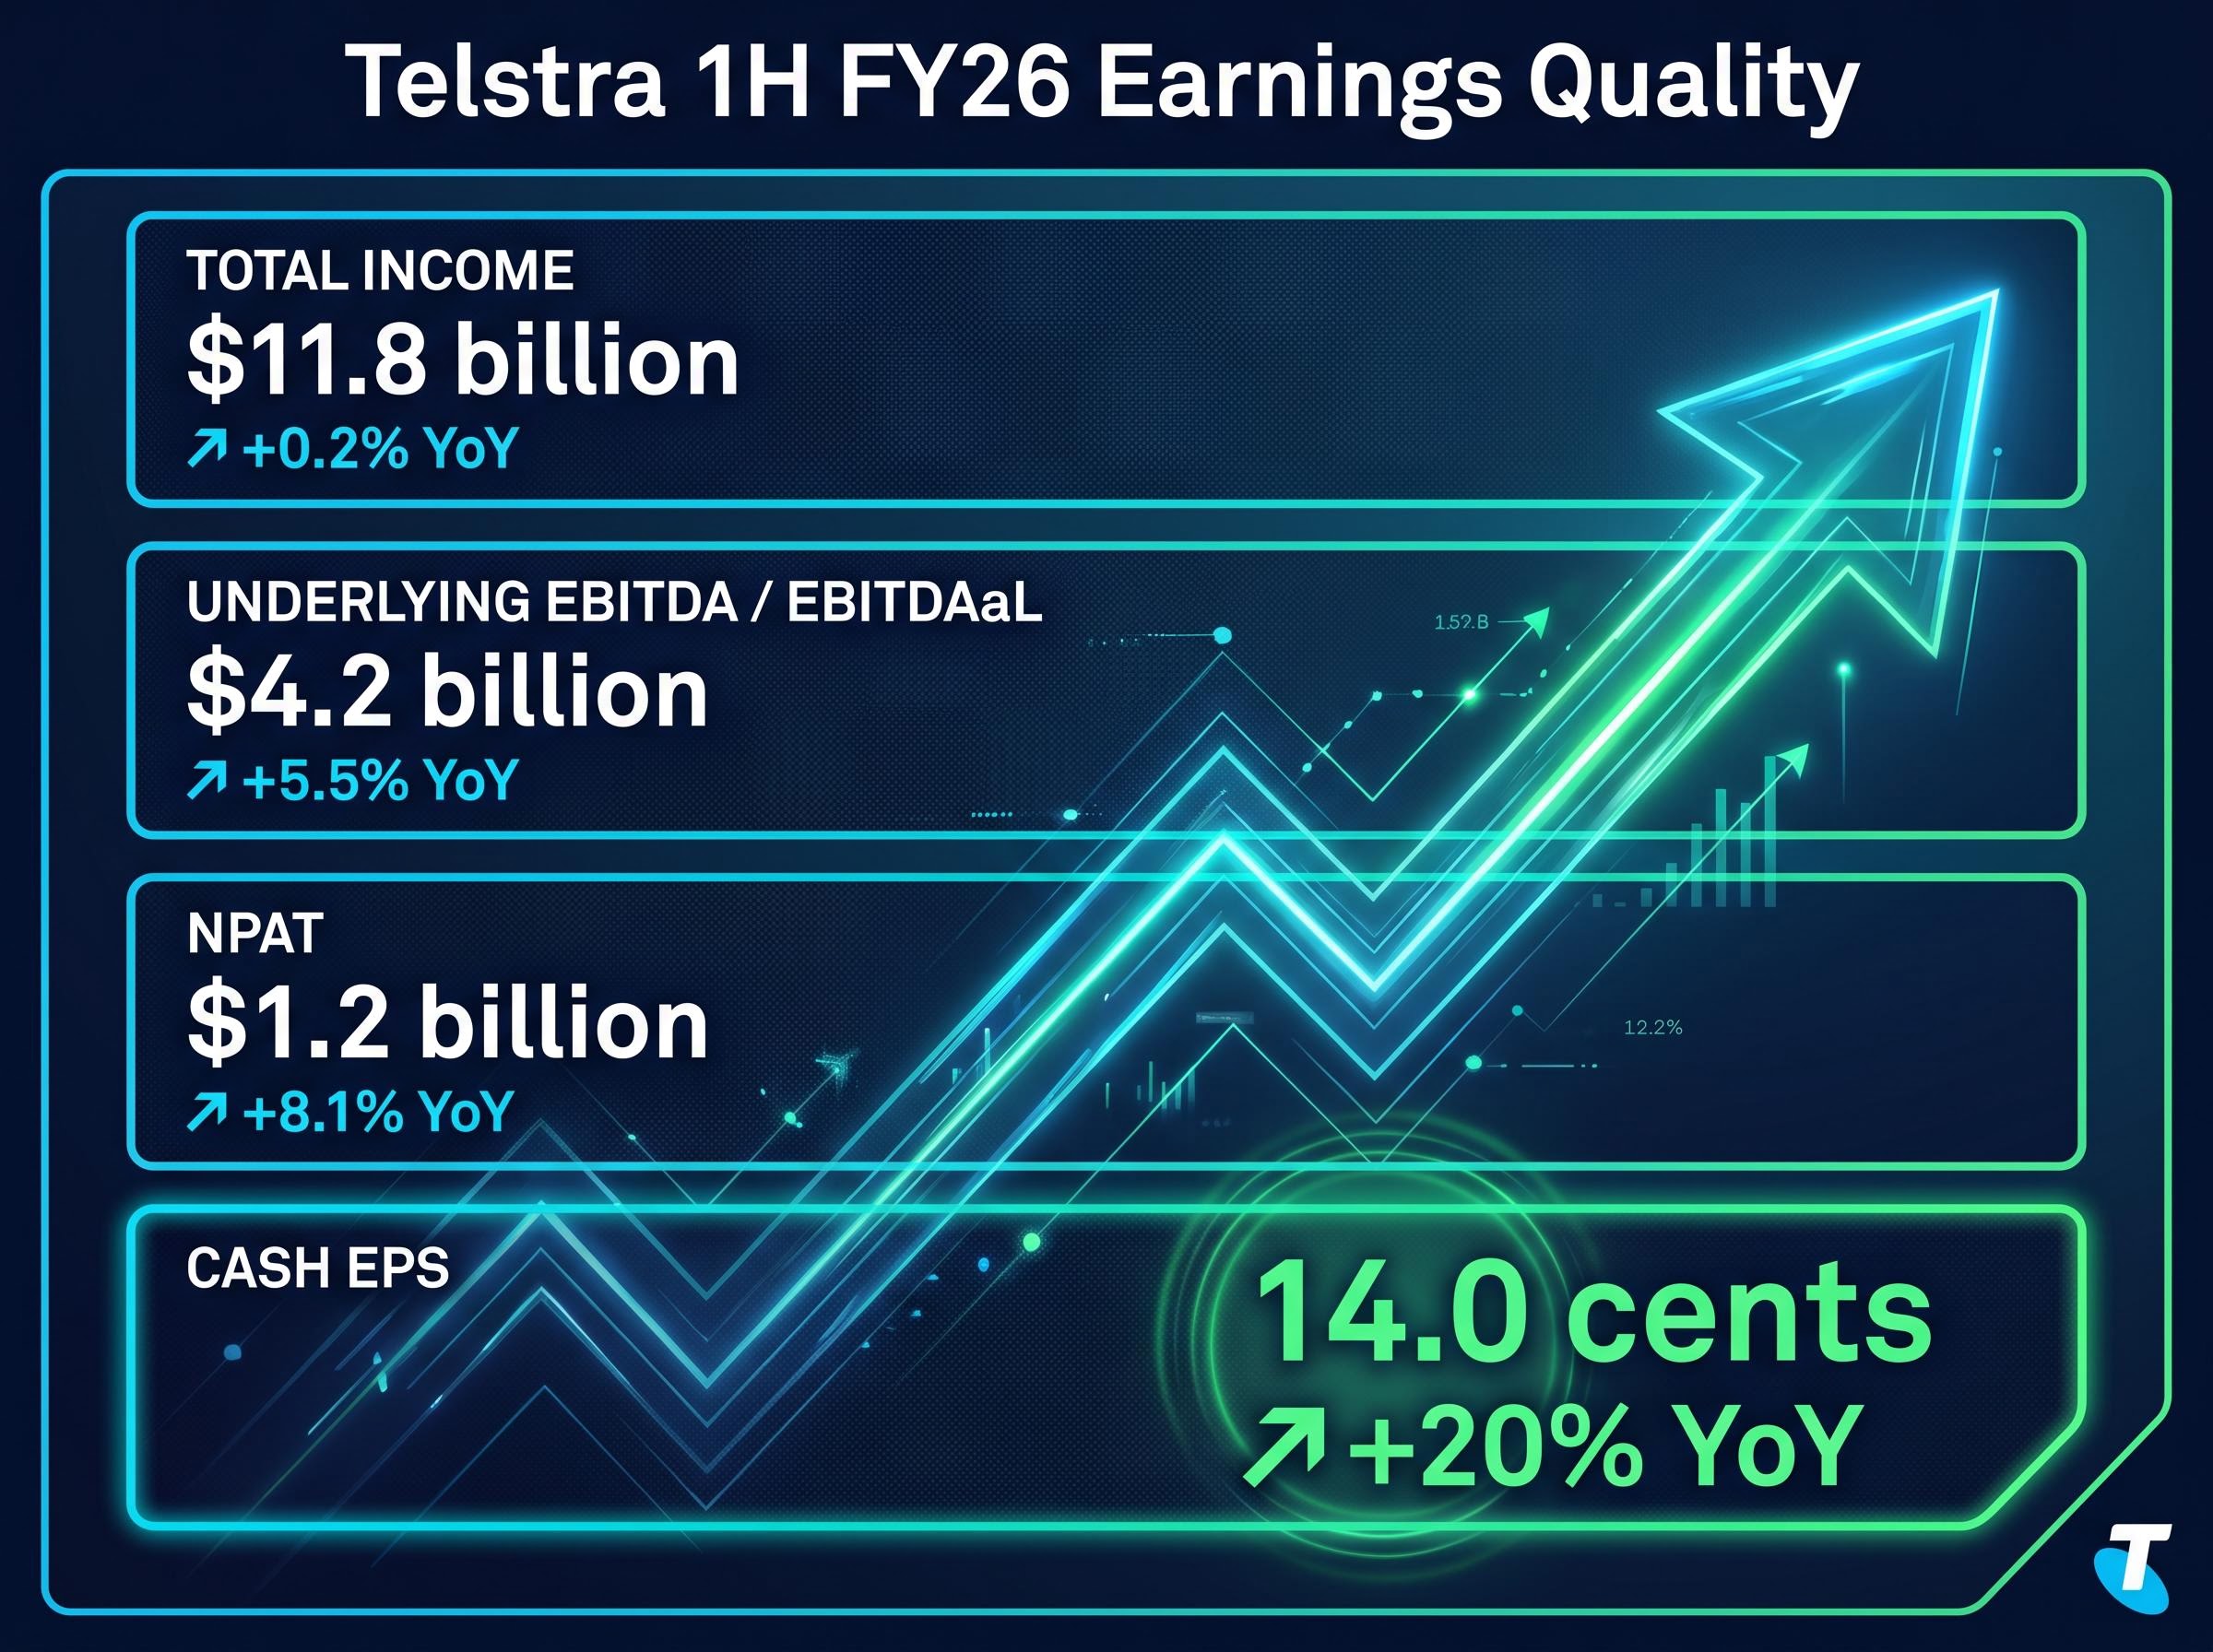
The 1H FY26 results, released on 19 February 2026, showed that pattern accelerating. Total income of $11.8 billion grew just 0.2% year on year, yet underlying EBITDAaL climbed 5.5% to $4.2 billion and NPAT rose 8.1% to $1.2 billion.
The 1H FY26 results, released on 19 February 2026, showed that pattern accelerating, with the Mobiles division delivering 5.6% revenue growth and AI-driven service improvements contributing to a near tripling of customer query resolution rates since the Virtual Assistant launch in November 2025.
Cash earnings per share grew 20% year on year to 14.0 cents in 1H FY26, the standout metric signalling accelerating earnings quality beneath flat revenue.
| Metric | FY25 (full year) | 1H FY26 (half year) | YoY change (1H FY26) |
|---|---|---|---|
| Total income | $23.6 billion | $11.8 billion | +0.2% |
| Underlying EBITDA / EBITDAaL | $8.6 billion | $4.2 billion | +5.5% |
| NPAT | $2.3 billion | $1.2 billion | +8.1% |
| Cash EPS | — | 14.0 cents | +20% |
Following the half-year results, management tightened FY26 underlying EBITDAaL guidance to $8.2-$8.4 billion. That narrowing, combined with the mid-single-digit cash earnings CAGR target to FY30, connects the positive operating leverage visible in the half-year numbers to a medium-term trajectory that supports both dividend sustainability and the current share price premium.
The most recent distribution was the 1H FY26 interim dividend of 10.5 cents per share (90.5% franked; 9.5 cents franked and 1.0 cent unfranked), paid on 27 March 2026. The FY25 full-year total stood at 19 cents per share. On a trailing basis, these figures underpin the current yield of approximately 3.41%.
That yield sits marginally below the five-year average of roughly 3.62%. In Telstra’s case, the gap reflects share price appreciation running slightly ahead of dividend growth, not dividend deterioration. Payouts have continued to grow; the share price has simply grown faster.
For Australian resident investors, particularly self-managed super fund trustees, the cash yield understates the total return. Franking credits add a gross-up component that materially improves the effective yield. Calculating the grossed-up yield on a partially franked dividend involves three steps:
For investors unfamiliar with the mechanics, the calculation of franking credit entitlement involves applying the standard 30/70 formula to the franked portion of each dividend, with the resulting credit functioning as a direct offset against personal tax liability or, for eligible low-tax investors and SMSFs in pension phase, a refundable cash amount from the ATO.
On a grossed-up basis, Telstra’s effective yield for eligible Australian tax residents is approximately 4.73%, materially above the headline cash figure.
In February 2026, Telstra expanded its on-market share buyback authorisation from up to $1.0 billion to up to $1.25 billion. By the end of 1H FY26, $637 million of that programme had been completed.
The mechanics matter for investors. Buybacks reduce the share count, supporting earnings per share growth even when aggregate profit grows modestly. They also function as a complement to the dividend, giving management a second lever for returning capital. Telstra’s total shareholder return framework operates through three simultaneous channels:
When a company with a market capitalisation of approximately $60.9 billion commits $1.25 billion to repurchasing its own shares alongside growing dividends, it is making an active capital allocation statement.
Management expanded the buyback in February 2026, with shares trading near their highest level in a year. That decision is a meaningful signal, not a routine administrative action. It indicates the Board’s assessment that capital is being deployed at acceptable value relative to the company’s internal view of future earnings.
This does not constitute a floor on the Telstra share price. Buybacks can be paused or adjusted at the Board’s discretion. But the willingness to accelerate repurchases at elevated prices suggests management confidence in the earnings trajectory that underpins the mid-single-digit cash earnings CAGR target to FY30.
The evidence assembled across the prior sections converges on a clear reading. Telstra is not expensive on an absolute basis, but it carries a thin margin of safety at current prices.
At approximately $5.38 (as at 22 May 2026), the share price sits above the analyst consensus 12-month target of roughly $5.27 and near the upper end of the 52-week range of $4.67-$5.58. The current yield of 3.41% against the five-year average of 3.62% confirms that the market is pricing in continued earnings and dividend growth.
| Valuation metric | Current value | Reference point | Implied signal |
|---|---|---|---|
| Dividend yield | ~3.41% | 5-year avg ~3.62% | Price ahead of dividend growth |
| Price vs. consensus target | $5.38 | ~$5.27 (range $4.60-$5.64) | Trading above midpoint consensus |
| Price vs. 52-week range | $5.38 | $4.67-$5.58 | Near upper bound |
On a yield, consensus, and technical basis, Telstra appears fairly valued at current levels, with limited margin of safety for new income-focused positions.
Specific risk conditions could compress the yield further or reverse recent gains. ARPU erosion from competitive mobile pricing remains a persistent threat, even if Telstra’s network moat has historically insulated it from the worst of the price wars. Execution risk on the mid-single-digit cash earnings CAGR target to FY30 is real; cost discipline must continue alongside revenue stability. Macro rate movements also matter: if the Reserve Bank of Australia holds rates higher for longer, income stocks face valuation pressure as risk-free alternatives become more competitive.
These statements are speculative and subject to change based on market developments and company performance.
Telstra is a high-quality income stock with a defensible network moat, improving earnings quality, and an active capital return programme. At current prices, it is trading at or marginally above fair value on a yield basis, with limited but not absent margin of safety.
For income investors evaluating entry timing rather than long-term portfolio conviction, several conditions would improve the case:
The buyback and dividend growth together form a dual shareholder return mechanism that supports the income thesis over the medium term. Whether TLS belongs in an income-focused portfolio at $5.38 depends less on the quality of the business, which is well established, and more on whether the investor requires a margin of safety that current pricing does not generously provide.
Investors exploring how Telstra’s yield fits within a retirement income strategy will find our dedicated guide to dividend income capital targets covers the specific capital thresholds required to meet ASFA retirement benchmarks, the role of franking credits in reducing those targets, and the optimal superannuation structures for holding fully or partially franked ASX equities.
This article is for informational purposes only and should not be considered financial advice. Investors should conduct their own research and consult with financial professionals before making investment decisions. Past performance does not guarantee future results. Financial projections are subject to market conditions and various risk factors.
As at 22 May 2026, Telstra shares are trading at approximately $5.38, with a trailing dividend yield of roughly 3.41%, which sits below the five-year historical average yield of approximately 3.62%.
For eligible Australian tax residents, Telstra's grossed-up yield is approximately 4.73%, materially higher than the headline cash yield of 3.41%, because the 1H FY26 interim dividend was 90.5% franked.
Telstra expanded its on-market buyback authorisation to $1.25 billion in February 2026, with $637 million already completed, and the decision to accelerate repurchases near 52-week highs suggests management confidence in the company's earnings trajectory to FY30.
Telstra covers approximately 99.6% of the Australian population with 5G reaching more than 85% of Australians, while Optus and TPG Vodafone have concentrated their rollouts in metropolitan corridors and hold a significantly smaller regional presence.
Telstra reported 1H FY26 total income of $11.8 billion, underlying EBITDAaL up 5.5% to $4.2 billion, NPAT up 8.1% to $1.2 billion, and cash earnings per share growth of 20% to 14.0 cents, with full-year FY26 EBITDAaL guidance tightened to $8.2-$8.4 billion.