
A multi-day bounce in US stocks vanished in a single session this week, yet the assets that usually catch fear behaved strangely. Bonds rallied as expected, but gold and silver fell even as yields dropped, which is not how a normal flight to safety plays out.
This stock market selloff was led by US technology. The Nasdaq was the weakest of the major indexes, the S&P 500 slid back towards its early-October lows, and the Russell 2000 held up comparatively well.
The evidence is mixed. Activity data stayed strong even as markets priced in less tightening from the Federal Reserve. The figures here reflect the latest snapshots located, around 22 October 2026, and some closing levels were not available.
Read on to see where the move looks like ordinary risk aversion and where it looks like a speculative unwind, plus the specific signals that should shape your next decision.
Why did a multi-day bounce fail in one session?
The chart tells the story before the commentators do. According to Spac, head of global macro at Tasty Live, the rebound that followed the prior Friday’s selloff never repaired the damage. When the S&P 500 rallied into the underside of its broken trading range and got rejected there, it confirmed the bounce was corrective rather than a fresh uptrend.
A corrective bounce is a temporary recovery inside a larger decline. It relieves selling pressure without changing the direction of the trend.
The last complete figure found puts the S&P 500 at 7,757.17, up 0.58% on 21 October. A full close for 22-23 October was not located. Nasdaq futures were down about 1.6% ahead of the 22 October session as the tech selling resumed.
The Nasdaq has already done what the S&P 500 is still trying to avoid: it broke below its range floor. Spac’s levels for the next leg are:
- Nasdaq support zone: roughly 28,700-28,850, just under 29,000
- Nasdaq next downside target: about 27,500, the July lows
- Russell 2000: stalled at former support now acting as resistance, along a downtrend line in place since mid-August
That Russell downtrend began after Kevin Warsh’s hawkish speech at Jackson Hole. The index was roughly flat in this session, a resilience Spac attributes to its small technology weighting.
| Index | Latest data found | Technical level | Read |
|---|---|---|---|
| Nasdaq | Close not found; futures down about 1.6% pre-session 22 Oct | Support 28,700-28,850; target 27,500 | Broke range floor; weakest index |
| S&P 500 | 7,757.17 (+0.58%) on 21 Oct; 22-23 Oct close not found | Underside of broken range | Rejection confirms corrective bounce |
| Russell 2000 | Close not found; roughly flat | Downtrend line since mid-August | Relative resilience from low tech weight |
The divergence matters for you. If the Russell is holding while the Nasdaq cracks, the damage sits in mega-cap tech, and a headline index level can hide where the stress actually lives in your portfolio.
Investors weighing the Nasdaq’s broken range against the S&P 500’s rejection will find our detailed coverage of conflicting S&P 500 and Nasdaq signals useful for its Ichimoku cloud support levels and momentum confirmation tests.
When big ASX news breaks, our subscribers know first
Why are bonds rallying while gold, silver and the dollar fail to act like havens?
The puzzle is simple to state. Treasury yields fell, with the 10-year around 4.95-4.96%, which normally helps gold because a non-yielding asset becomes cheaper to hold. Gold fell anyway.
A safe-haven hierarchy explains much of it. In a sudden equity scare, investors reach first for the most liquid hedge, and here that was government bonds. Gold and silver, after a strong run this year, were treated less like shelters and more like crowded trades to be cut.
Gold’s safe haven status has repeatedly failed in liquidity-driven selloffs, including March 2020 and March 2026, when forced selling, real yields and dollar direction overrode its defensive properties, which is the pattern now visible in this week’s metals move.
Metals: liquidation or macro?
The size of the gold move depends on the source. CNBC reported spot gold at $4,081.89, down 1.4%, during the 22 October session, while a later Strong Buy Analytics snapshot showed about $4,040.20, down 2.65%. Silver fell harder: a silver fund dropped 5.59% against 2.63% for a gold fund.
Roberto Scholtes of Singular Bank sees forced liquidation, with hedge funds unwinding AI-related positions and selling profitable metals to raise cash. CNBC pointed instead to an oil rally reviving inflation worries. Spac disagrees with that second reading, describing crude as only modestly higher and not an inflation scare.
| Mechanism | Who argues it | Evidence | Asset affected |
|---|---|---|---|
| Forced liquidation | Roberto Scholtes, Singular Bank | AI hedge-fund positions unwinding | Gold, silver |
| Oil-driven inflation concern | CNBC | Oil rally coincided with gold’s fall | Gold |
| Speculative positioning | Kitco; Spac | Silver fund -5.59% vs gold fund -2.63% | Silver more than gold |
| Safe-haven hierarchy | Kitco | Lower yields failed to lift bullion | Bonds over metals |
The evidence favours a combination. Silver’s steeper drop fits a more leveraged market being cleared first, and its industrial demand makes it vulnerable when a tech selloff reads as a growth warning. If you hold metals as a hedge, this episode shows they can fall alongside equities when positioning is crowded.
The dollar’s missing bid
Matt Weller of StoneX observed that tech selling sent money into bonds but not the dollar. Selling US tech can mean selling dollar assets outright rather than parking cash in dollars. Francesco Pesole of ING added that markets read equity turbulence as reducing the odds of further Fed hikes.
The euro steadied despite stress in France. CNBC put the French-German 10-year spread at 147 basis points, while another report put it near 175 basis points.
US unwind, not global panic A global funding crisis normally drives investors into dollars. A US-specific equity unwind can do the opposite, because it reduces demand for American assets.
Why did strong earnings fail to lift mega-cap tech?
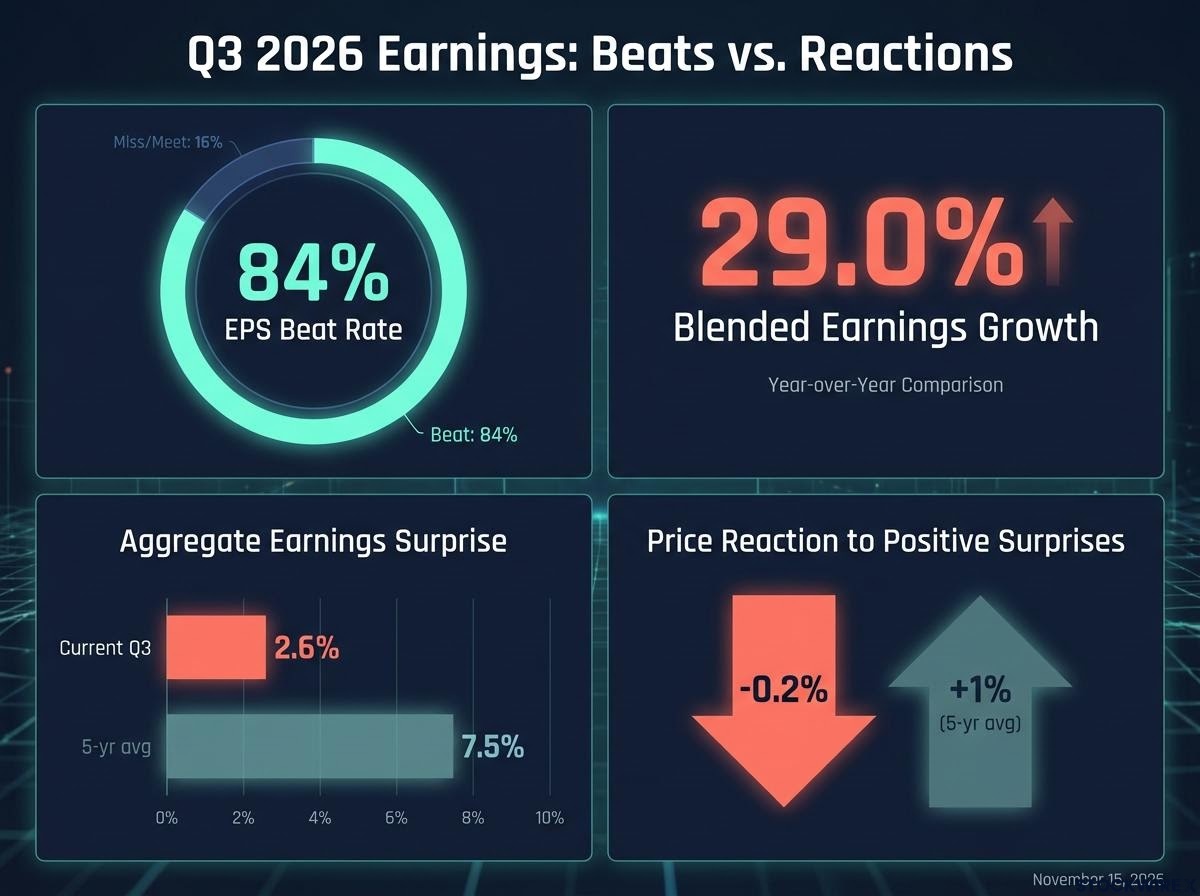
On paper, the quarter looked excellent. Companies kept beating forecasts, yet their shares often slipped afterwards.
The weakness is narrower than headlines suggest. Spac points to an equal-weighted Finviz heat map showing more stocks up than down, with the largest names dragging the indexes. That undercuts the idea of a wholesale rotation out of AI; a rotation away from crowded, expensive, rate-sensitive AI exposure describes it better.
| Metric | Q3 2026 figure | Benchmark |
|---|---|---|
| Blended earnings growth | 29.0% | 29.2% a month earlier |
| EPS beat rate | 84% | Only six companies missed |
| Aggregate earnings surprise | 2.6% | 7.5% five-year average |
| Price reaction to positive surprises | -0.2% | About +1% five-year average |
The FactSet numbers settle it. The share of companies beating stayed high, but the margin of the beat was about a third of normal, and the reward for beating disappeared. Three explanations fit:
- The bar was too high. With growth near 29%, matching estimates was already priced in.
- Positioning exhaustion. Scholtes describes an unwind of crowded AI trades, especially semiconductors.
- Financing concerns. Reuters reported worry about the debt structures funding the AI build-out, separate from quarterly results.
For you, a stock that beats and still falls signals expectations are fully priced. Earnings season is therefore a weaker support for index levels than the headline beat rate suggests.
The split between earnings beats and stock reaction is visible company by company: beats paired with strong revenue were rewarded, while thin beats with cautious guidance were sold, which explains why the headline beat rate offers so little index support.
What do Fed hike odds and slowing growth data mean for the outlook?
The Fed signals and the growth signals point in different directions, and that tension sits at the centre of the outlook.
Mixed growth signals
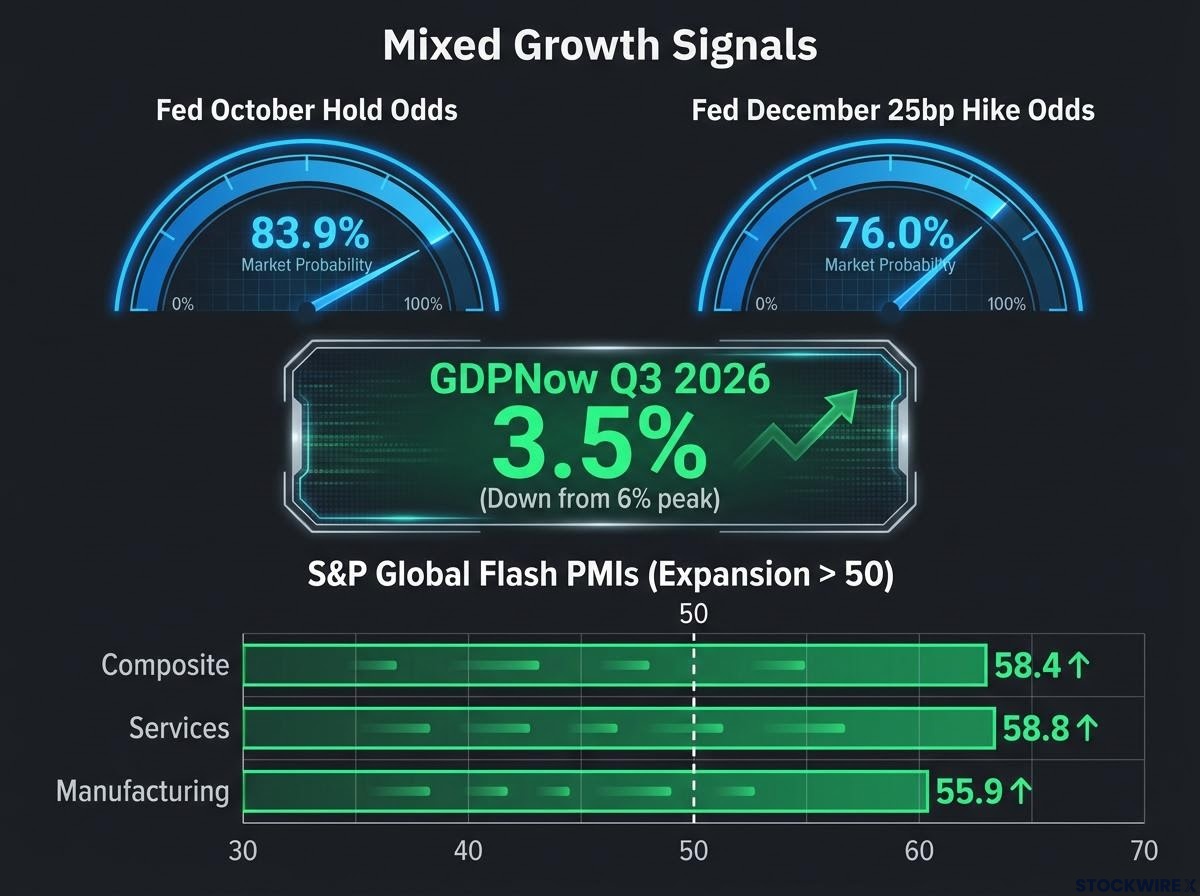
Markets now price two further hikes rather than three. A December move is likely but no longer certain.
Fed funds futures pricing can swing by dozens of points on a single speech, as the October hike odds did earlier this autumn, which is why conflicting hold probabilities of 84% and 93% should be treated as a range rather than a verdict.
| Indicator | Figure | Source | What it signals |
|---|---|---|---|
| October hold odds | 83.9% (16.1% for 25 bp hike); about 93% per Spac | CME FedWatch via Odaily; Spac | Hold expected; sources conflict |
| December hike odds | 76.0% 25 bp; 14.2% 50 bp; 9.9% none | CME FedWatch via Odaily | Hike likely, not certain |
| GDPNow Q3 2026 | 3.5% (20 Oct), from a 6% peak | Atlanta Fed | Cooling from a strong pace |
| Flash PMIs | Composite 58.4; services 58.8; manufacturing 55.9 | S&P Global | Expansion, no contraction |
A purchasing managers’ index (PMI) surveys business activity, and any reading above 50 indicates expansion. These readings are well clear of that line, so this is cooling, not confirmed recession. The risk Spac flags is easing driven by weaker growth, which tends to hurt stocks because falling yields arrive alongside falling profits.
The Q3 advance GDP release is due 29 October 2026, though the official Bureau of Economic Analysis calendar entry was not located.
One trader’s positioning and what could break it
Spac is positioned for continued liquidation:
- Short gold and silver (100-ounce futures)
- Short S&P 500, Nasdaq, Russell and European equities via put verticals
- Short the dollar against the Aussie, pound, euro and Canadian dollar
- Long bonds, oil and Bitcoin
The counter-risks are real. A Fed pivot could revive long-duration tech, and investors showed a strong dip-buying reflex on 19 October. SpaceX and Super Micro results have revived AI sentiment before, a bond short squeeze could pull yields lower without a slowdown, and metals could rebound if the dollar keeps sliding.
When the bearish case strengthens The case for further downside strengthens materially if soft data is followed by weaker earnings guidance and persistent credit or funding stress.
Treat any single trader’s book as a hypothesis, not a forecast. These statements are speculative and subject to change based on market developments.
What this unwind changes, and what it does not
The cross-asset pattern points to a US-tech-led speculative unwind rather than a global funding crisis. Bonds did the hedging, metals behaved like crowded risk, and the dollar lost its usual bid because the shock was American in origin.
What it does not change is the underlying data. PMIs and GDPNow still describe an economy that is cooling, not contracting.
Four variables will decide the next move: the 29 October GDP release, the Fed meeting, whether the Nasdaq holds the 28,700-28,850 zone, and whether yields and the dollar start moving with the metals. With no confirmed 23 October closes, the honest stance is to watch those markers before committing to either side.
This article is for informational purposes only and should not be considered financial advice. Investors should conduct their own research and consult with financial professionals before making investment decisions. Past performance does not guarantee future results. Financial projections are subject to market conditions and various risk factors.