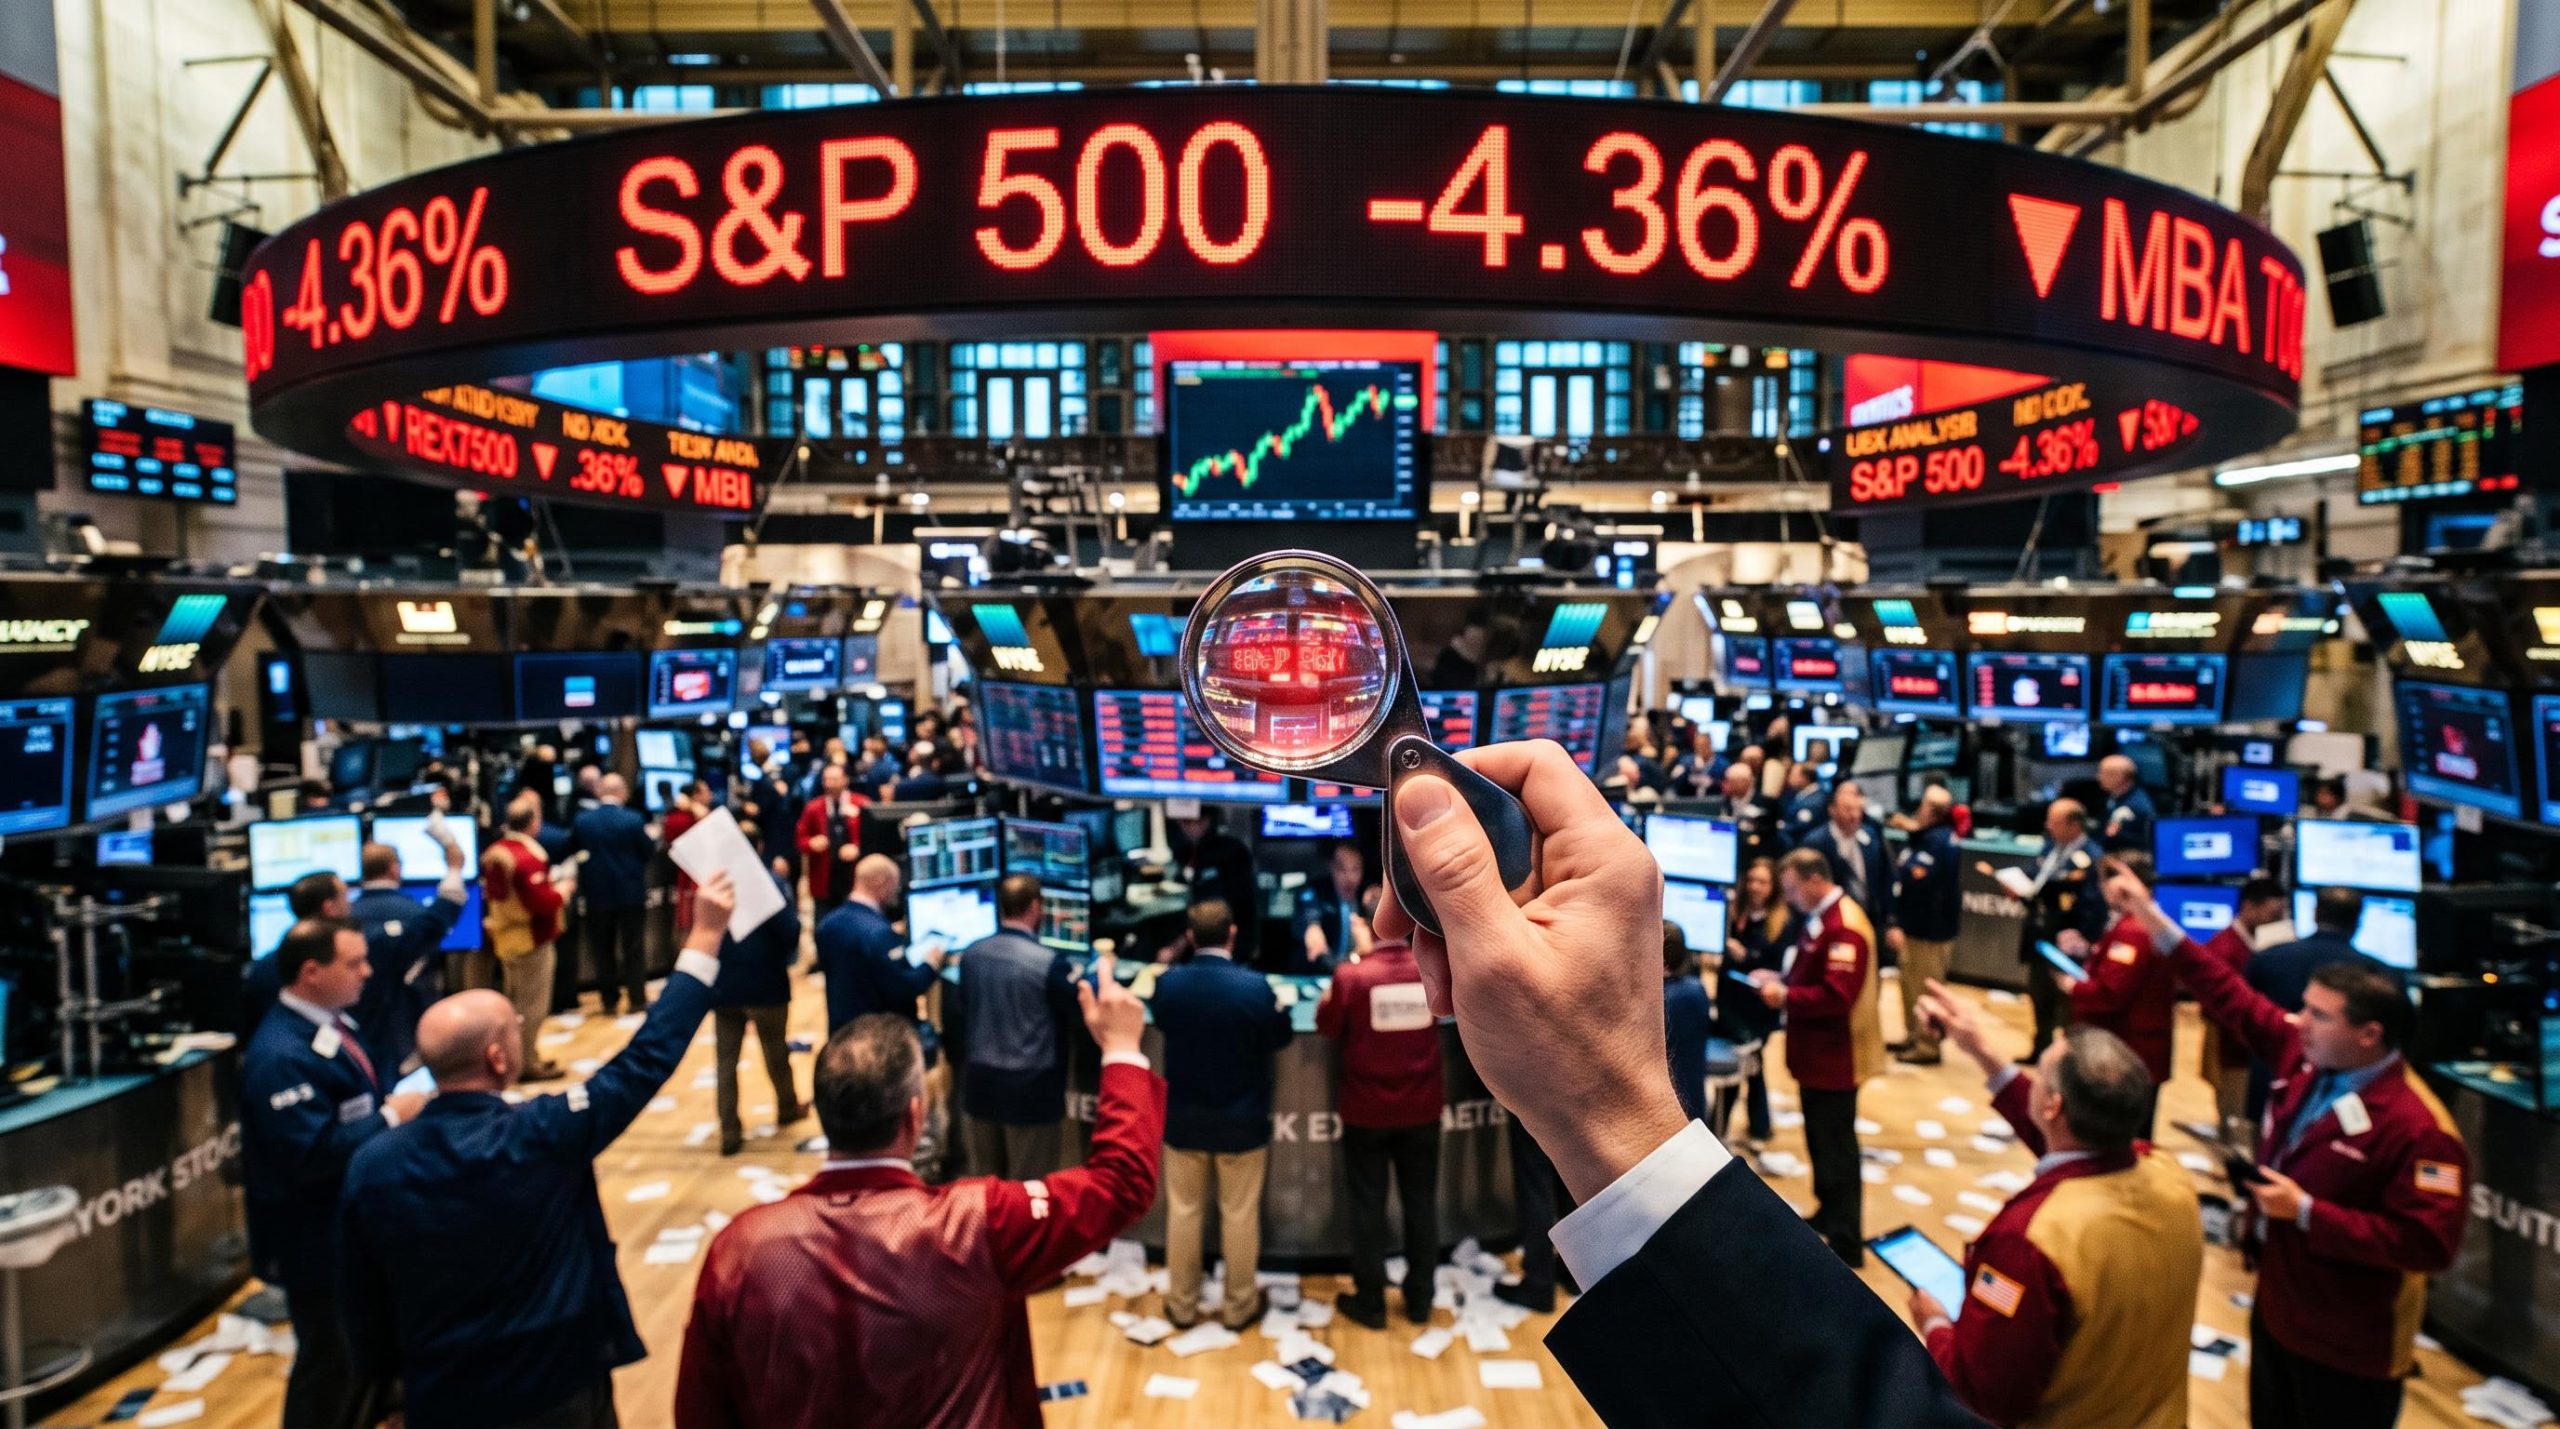
Wall Street’s best post-midterm session in 44 years lasted exactly one day. On Wednesday, 4 November 2026, the Dow jumped 1,569 points (3%). By Thursday’s close the S&P 500 had dropped 4.36% and the Nasdaq Composite had slid into correction territory, meaning a fall of more than 10% from its recent peak.
The relief rally looked like good news. The stock market sell-off that followed suggests it was something else: a brief pause in event risk before a harder repricing.
Roughly $3 trillion of S&P 500 value disappeared in a single session, according to Reuters. The S&P closed at 7,353.73, the Nasdaq at 24,315.00 and the Dow at 51,523.06. With the October jobs report due on Friday, the next move could come quickly.
Here is a clear read on the chart levels that matter, why falling Federal Reserve hike odds did nothing for stocks, and what to watch in the payrolls data before you react.
What did the sell-off actually look like, and where are the key levels?
Start with the closing numbers, because they set the scale of the reversal.
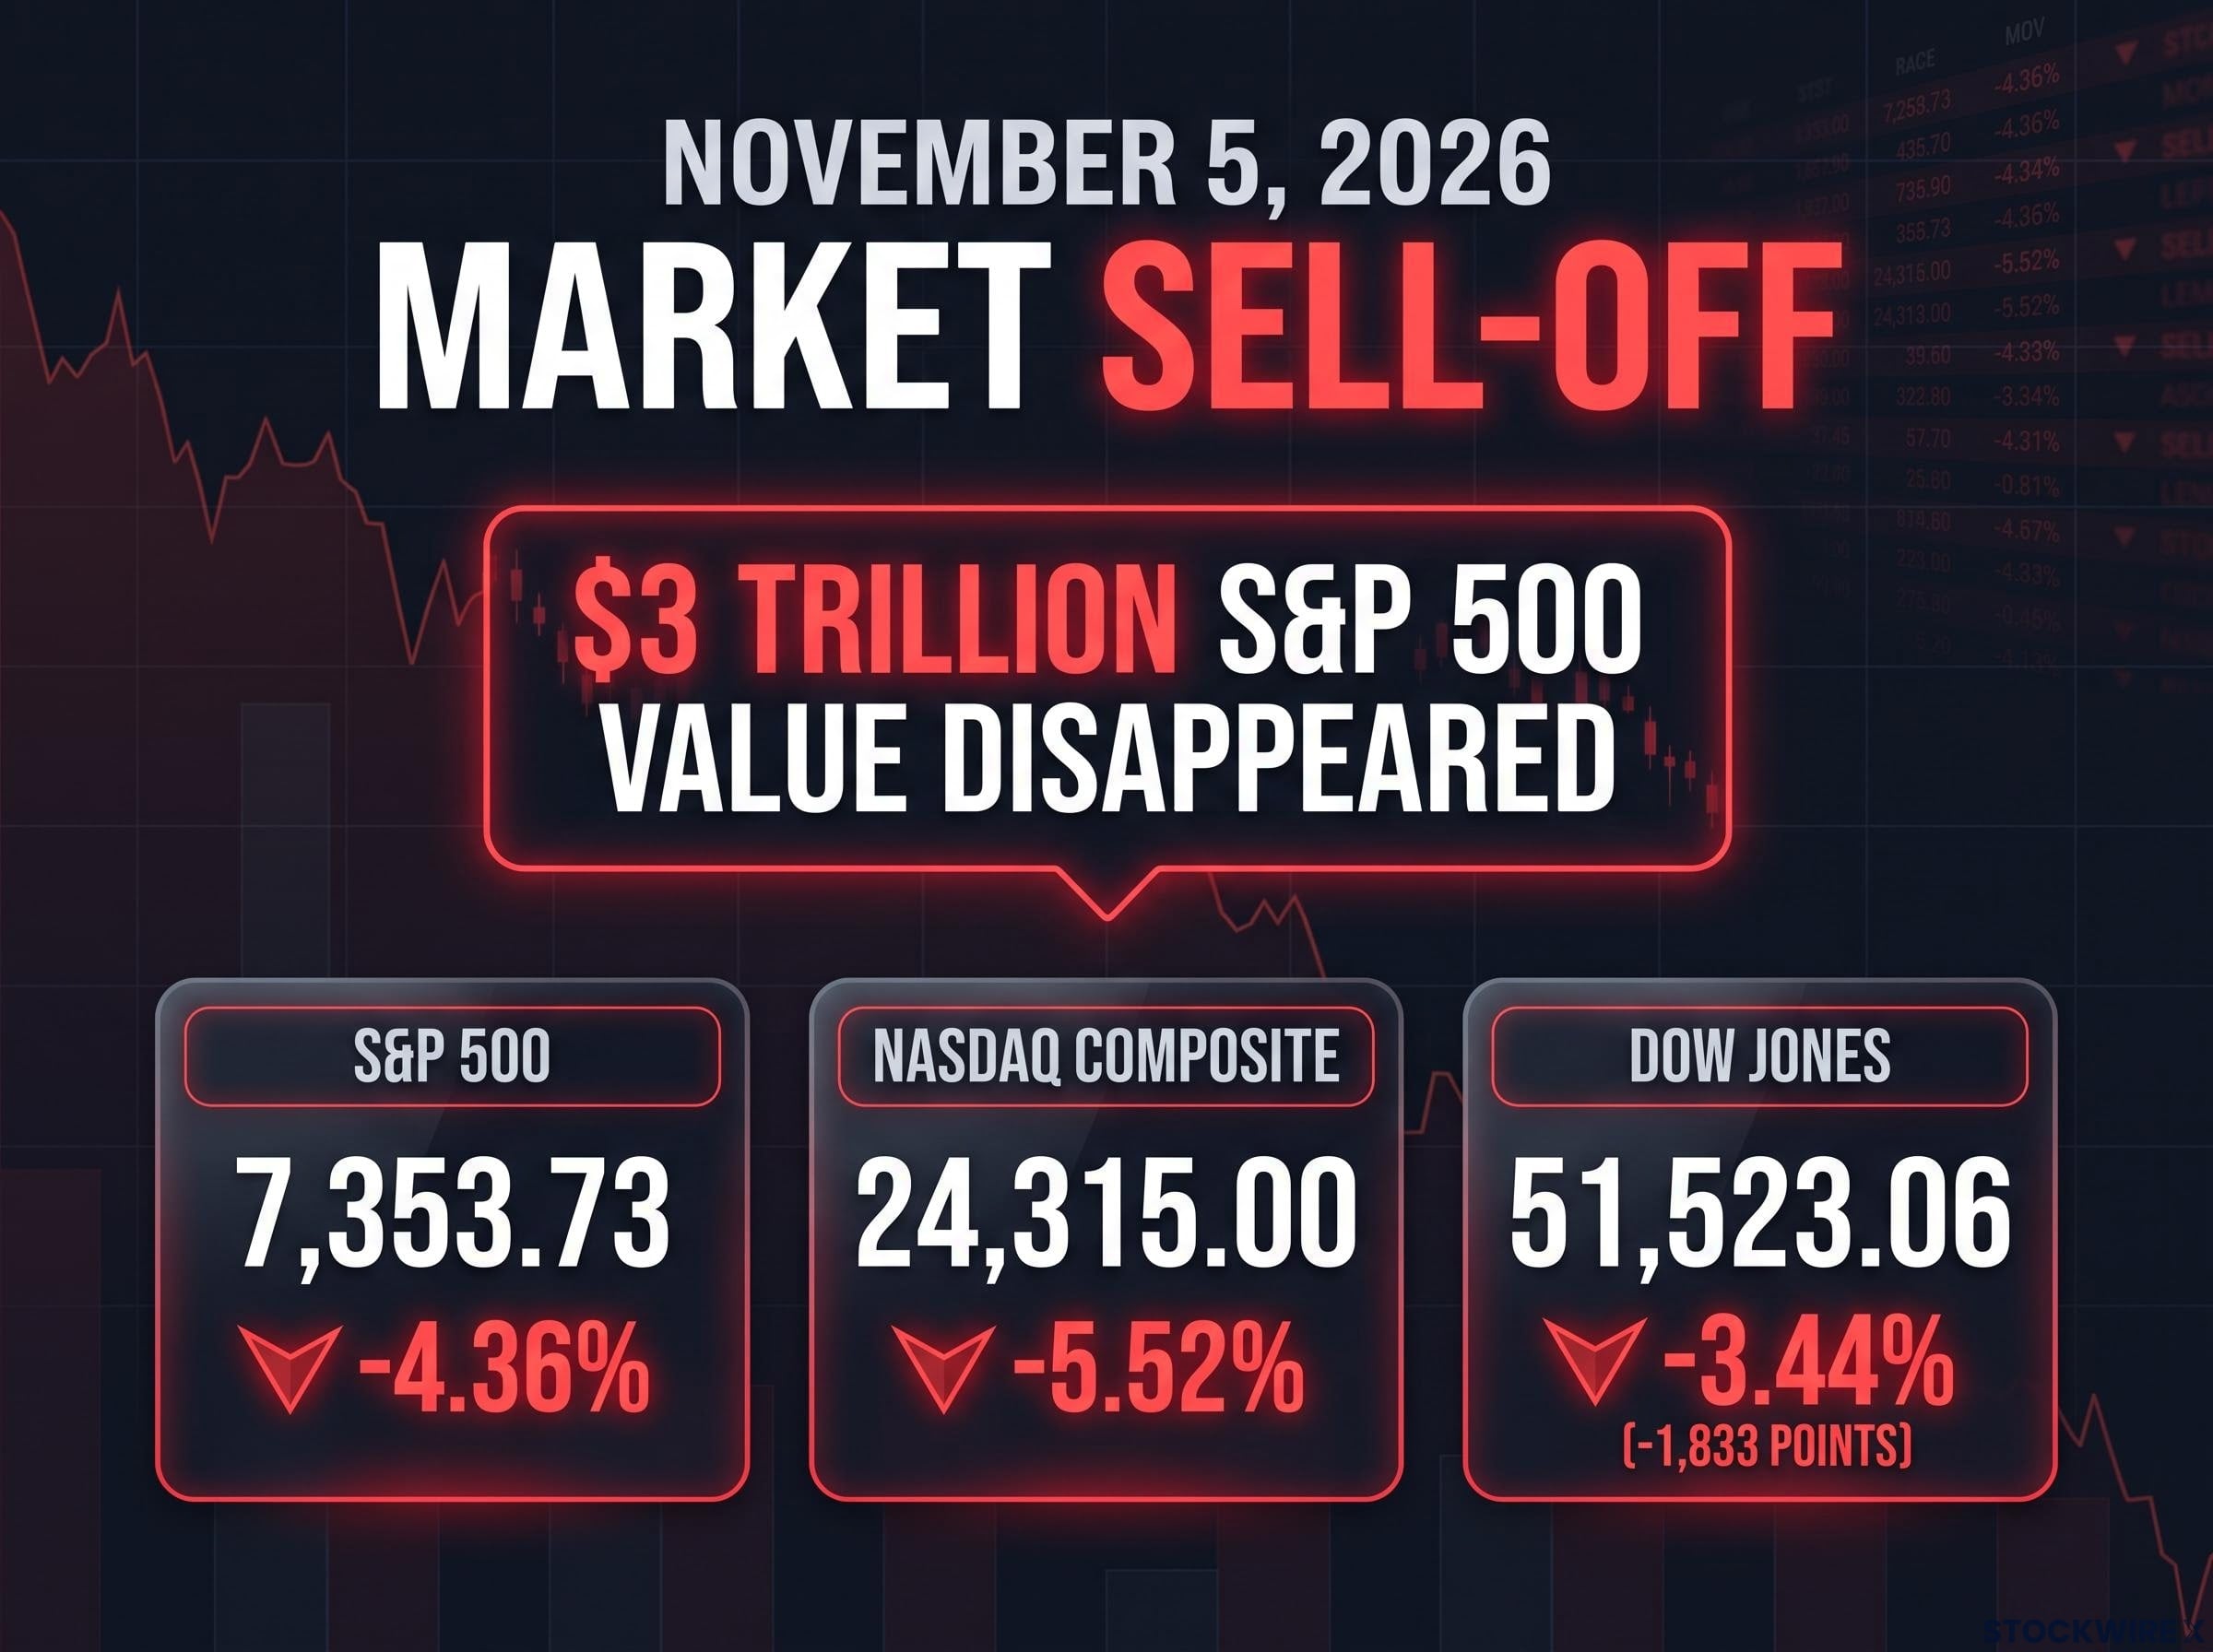
| Index | Close (5 November 2026) | Daily move |
|---|---|---|
| S&P 500 | 7,353.73 | -4.36% |
| Nasdaq Composite | 24,315.00 | -5.52% |
| Dow Jones Industrial Average | 51,523.06 | -3.44% (-1,833 points) |
Read against Wednesday’s gains (S&P +1.58%, Nasdaq +1.44%), this was a two-day round trip that ended lower than it began. The bounce never repaired the underlying trend, which has made lower highs and lower lows since early October.
The head of global macro presenting Macro Money at Tasty Live, who added to short positions during Wednesday’s bounce, argues the Nasdaq failed at a cluster of old support levels that now act as resistance. S&P futures are back at late July levels. The presenter’s levels on the continuous ES contract (the main S&P 500 futures contract):
- About 7,200: the next target if current support breaks
- About 7,000: the major line in the sand
No current numerical ES quote was available for this analysis. Morgan Stanley’s Mike Wilson flagged risk toward 7,100, about 9% below the then-record, on 1 November, while still recommending buying the dip.
If 7,200 gives way, treat 7,000 as the point where this stops being a pullback and starts testing the trend. A hold at either level may produce only a reaction bounce, so one green day is not an all-clear.
Why breadth and correlation matter
Breadth measures how many stocks join a move. On Thursday, heat maps showed few gainers and the equal-weight index looked as weak as the headline benchmark.
When correlations rise and sector differences fade, selling is about raising cash and preserving capital, not judging individual companies.
When big ASX news breaks, our subscribers know first
Sell-off, rotation or liquidation: how do you tell the difference?
Most investors assume a big down day means money is moving somewhere better. Sometimes it is. Thursday’s evidence points mostly elsewhere.
Rotation is money shifting between sectors or assets. Liquidation is forced or defensive selling across the board, usually fast and driven by leverage, margin calls or stop-loss orders (automatic sell instructions triggered at a set price).
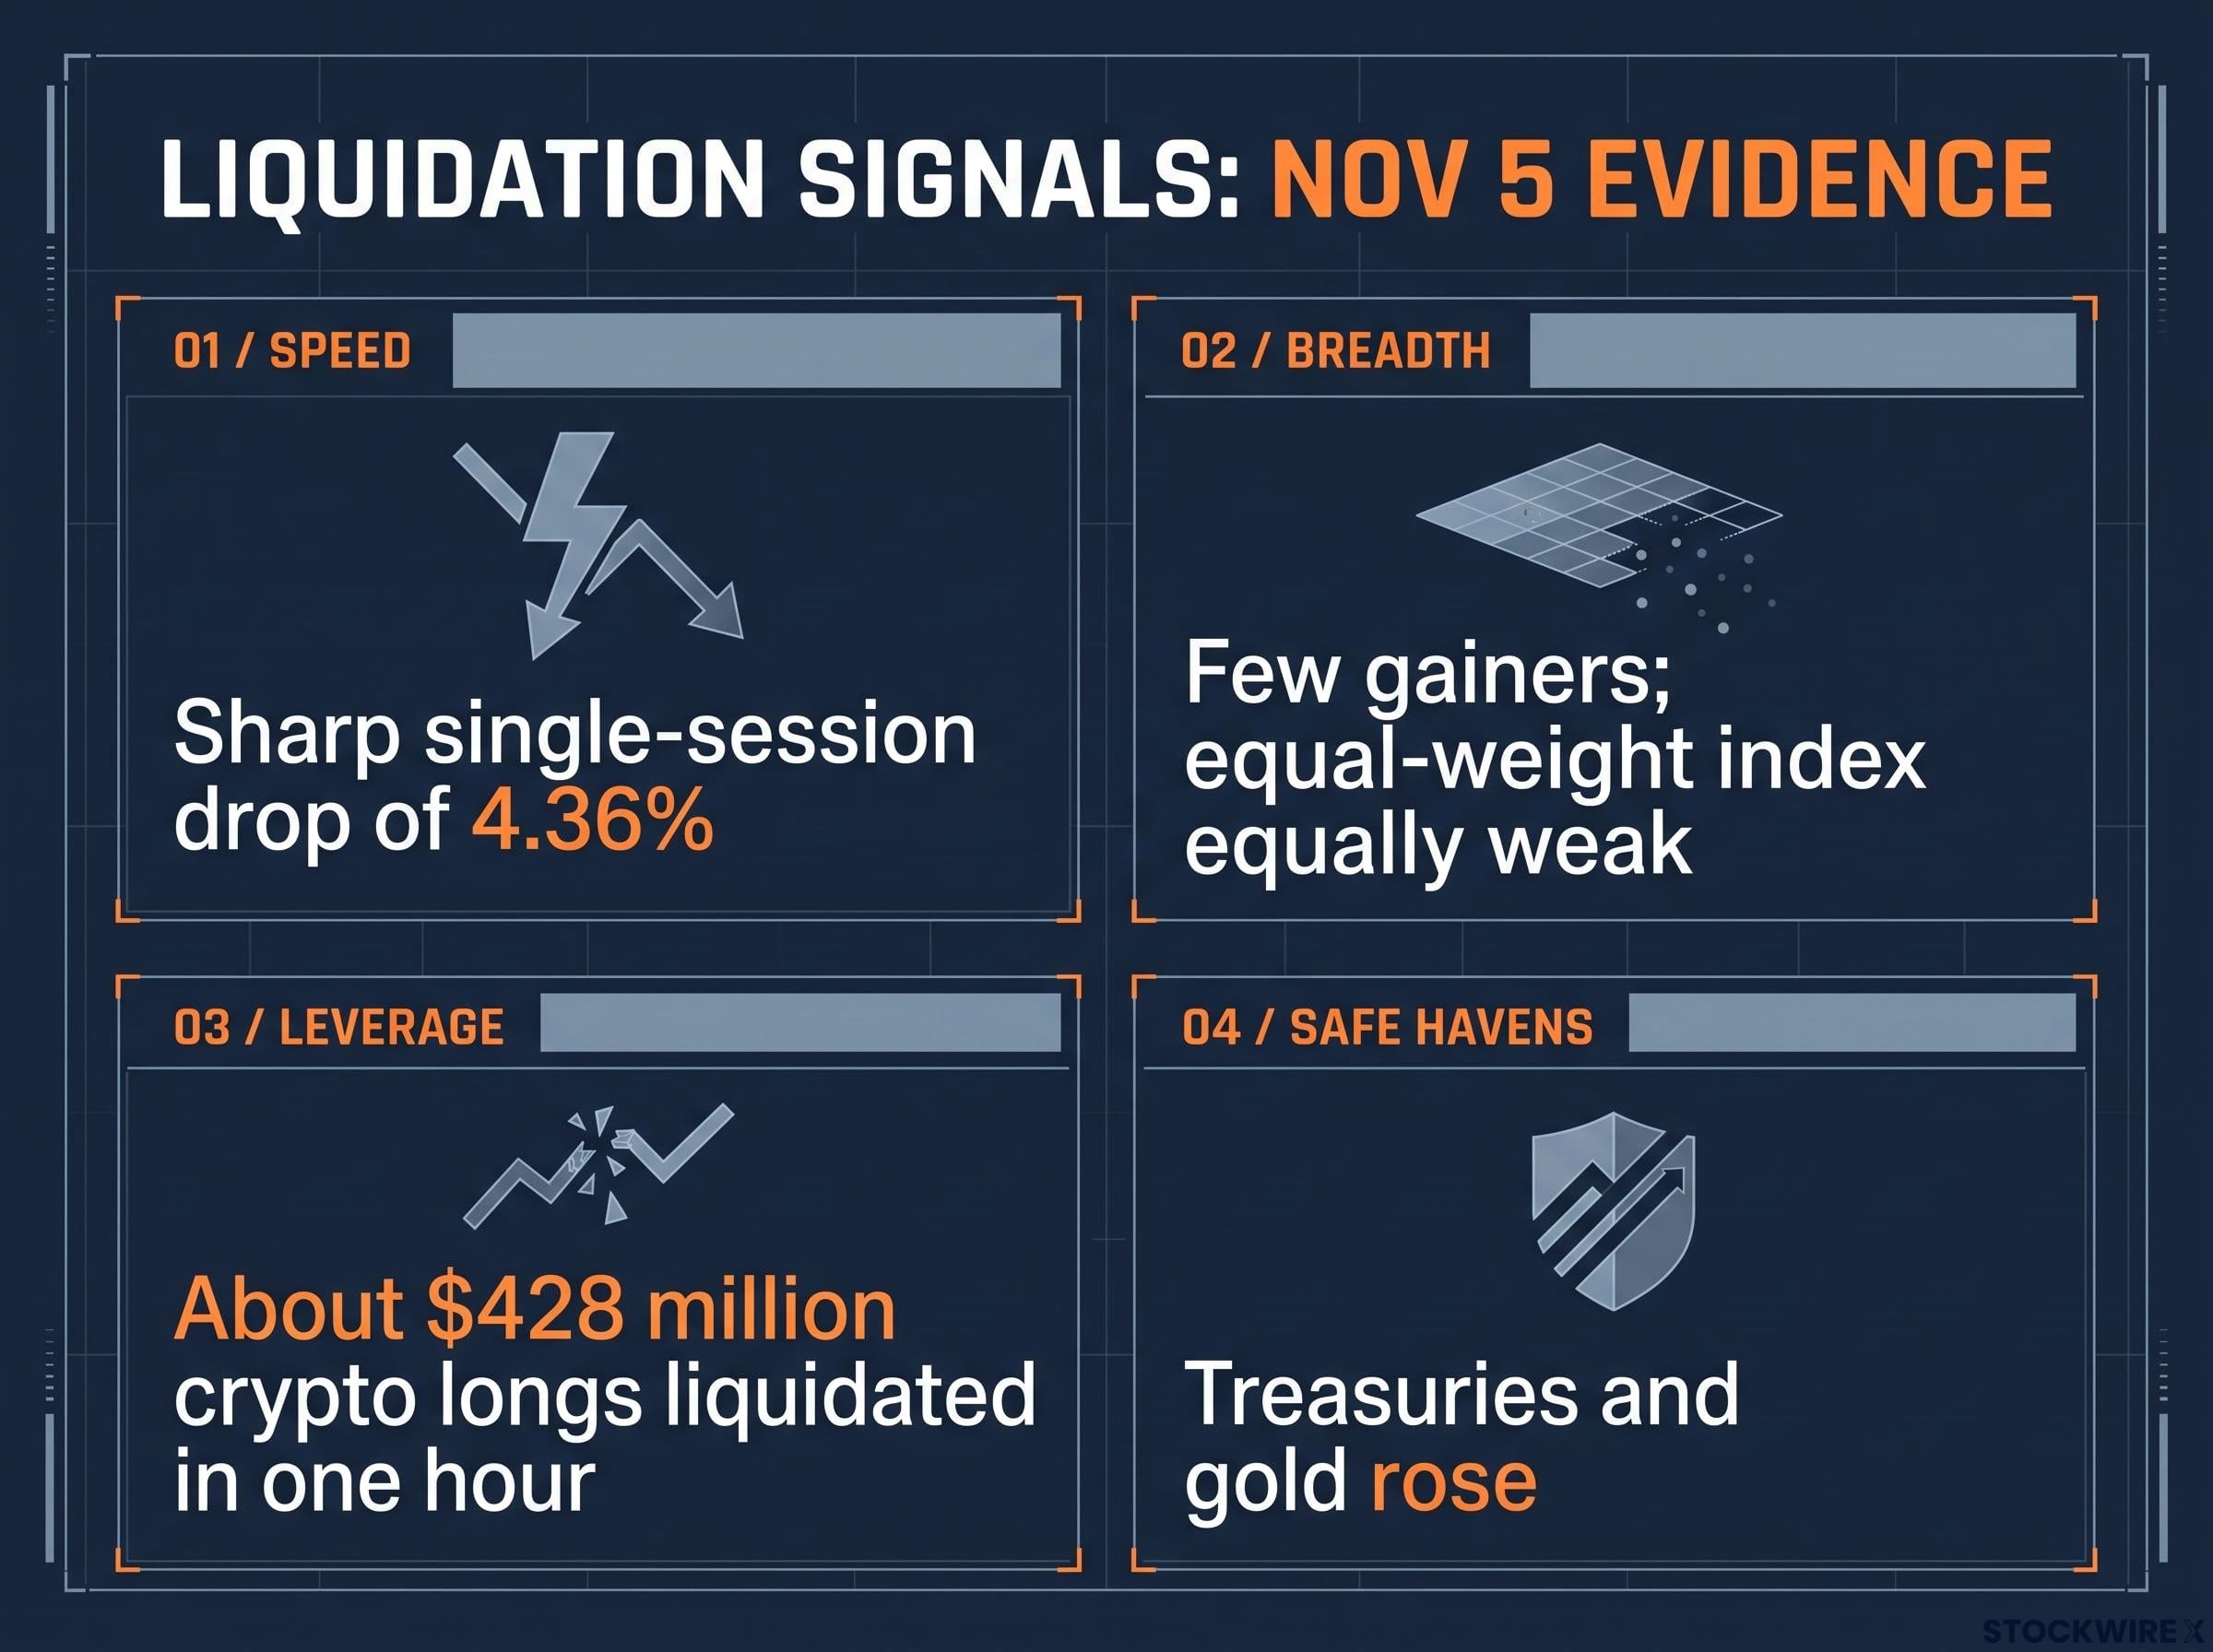
| Signal | Rotation | Liquidation (5 November evidence) |
|---|---|---|
| Speed | Gradual over days or weeks | Sharp single-session drop of 4.36% |
| Breadth | Some sectors rise as others fall | Few gainers; equal-weight index equally weak |
| Leverage | Little forced selling | About $428 million of crypto longs liquidated in one hour |
| Safe havens | Mixed | Treasuries and gold rose, signalling some rotation too |
The crypto figure comes from Yahoo Finance citing Swissquote. Both forces were present, but the speed and breadth lean toward liquidation.
Why it started is contested. Reuters pointed to a reassessment of the Democratic congressional victory and what it could mean for AI data centre construction, semiconductor demand and regulation. A decisive result, in other words, did not mean business-friendly for every sector. Ipek Ozkardeskaya of Swissquote said investors would scrutinise the aggressive AI buildout. Bloomberg commentary offered a gentler read: possibly healthy consolidation while cloud revenue stays strong.
Either way, the risk spread from AI and chip stocks to the broader market as investors questioned whether heavy capital spending would turn into free cash flow.
An earlier AI repricing showed the same pattern, with technology falling far more than the broad market and trendline support becoming the test of whether a pullback turns into a deeper unwind.
History cuts both ways.
The 2018 precedent: SPY gained about 1.9% in November 2018, then fell 8.8% in December. The post-midterm rally became that year’s high.
Against that, SPY rose in five of six post-midterm Novembers, and BlackRock reports an average 14.1% S&P 500 gain in the six months after midterms since 1970. Liquidation hits good and bad holdings alike, so a falling portfolio does not, on its own, tell you anything about the quality of what you own.
Why are falling Fed hike odds not lifting stocks?
Here is the puzzle. Markets are pricing fewer rate hikes, which should help stocks. Yet equities topped in early October, just as hike odds started fading.
The Fed held its target range at 3.75%-4.00% on 4 November and described inflation as elevated. Its own outlook involves 50 basis points of hikes this year. Chair Kevin Warsh made clear on 28 October that he did not see policy as restrictive:
“unwilling and unable to call” financial conditions tight.
Market pricing has drifted away from that stance:
- 29 October: 79.6% probability of a December hike on CME FedWatch (Yahoo Finance)
- Around 5 November: December odds at 65.4%, from a certainty a week earlier, per the Tasty Live presenter
- Around 5 November: January hike odds at 81.5%, down from a certainty the day before, rising to certainty by March
- Around 5 November: about 67% chance of a follow-on hike by September
The two December figures are not a contradiction. They capture the same downward drift at different points. Markets also increasingly lean toward no changes in 2027, though specific early-2027 probabilities were not available.
Futures pricing can swing by 20 percentage points on a single Fed speech, which is why probabilities such as 65.4% for December are better read as a drifting range than a fixed forecast.
Wednesday’s rebound did not lift hike odds at all. That matters because of how rates feed into valuations. A lower expected rate shrinks the discount applied to future earnings, which normally helps growth stocks. But if rates are expected to fall because growth is weakening, lower earnings forecasts can overwhelm that benefit.
That is the read to take from this. Falling hike odds paired with falling stocks is a growth warning, not a rate tailwind you can bank on.
How fragile is US growth when AI investment is carrying it?
The headline looks strong. Real GDP grew at a 3.4% annualised rate in Q3 2026, according to the Bureau of Economic Analysis (BEA) on 29 October.
The composition tells a narrower story.
| Component | Share of GDP or contribution | Note |
|---|---|---|
| Consumption | About 68% of GDP; added 2.52 percentage points | Largest part of the economy |
| Investment | About 14% of GDP | Contributed far more than its size; reflects AI buildout |
| Net trade | Est. -3.3 percentage points (Fortune) | Import drag from prices, energy shock and tariffs |
An official BEA contribution breakdown for investment and net exports was not found, so the trade figure is Fortune’s 30 October estimate. On that reading, rising import costs offset consumption’s contribution, leaving business investment and inventories, largely tied to AI, doing the heavy lifting.
A slice worth about a seventh of the economy is carrying the growth story. That weight feeds stock prices through three channels:
- Rate channel: fewer expected hikes help valuations only if growth holds up.
- Consumer channel: weaker spending hits retailers, travel, housing-related firms and financials, and reduces appetite for high multiples.
- AI-capex channel: spending lands now while revenue and cash flow arrive later, so free cash flow can fall even when reported earnings look strong.
Reuters framed the post-election move as a political risk premium around data centres, electricity use, chips and permitting, not necessarily the end of the spending cycle.
If your portfolio leans on AI and semiconductor leaders, you are exposed to both a consumer slowdown and any pause in the buildout, and those risks are linked.
Strong ISM readings, softer details
The Institute for Supply Management (ISM) surveys do not show a collapse. October services came in at 54.5, down from 54.9, and manufacturing at 55.5, up from 54.5 (Reuters, 2 and 4 November). Readings above 50 signal expansion.
Underneath, services new orders slowed significantly, while manufacturing backlogs grew more slowly and employment softened. Bulls can point to the headlines; bears can point to the details. Both are reading the same data.
What are gold, bonds, the dollar and bitcoin saying before the jobs report?
Equities are only one witness. The other markets told a consistent story on Thursday.
| Asset | 5 November move or level | What it signals |
|---|---|---|
| Gold | Up nearly 2%, back above $4,000 | Demand for safety |
| 10-year Treasury yield | About 4.87% | Money moving into bonds |
| Dollar index | -0.22% to 101.25 | Mixed; firmer against some risk currencies |
| Bitcoin | About -6% to $75,000 | Leveraged positions unwinding |
Gold fell alongside stocks in October; now it is rising while they fall, a shift the Tasty Live presenter noted on the charts. Linh Tran of XS.com named $4,000 as the key level. Yields peaked and turned lower in October.
The dollar was less clear. Reuters data showed the index down, while the presenter saw dollar strength against the pound and the Australian dollar as investors sought cash.
Friday’s payrolls are the test:
- October payrolls consensus: 65,000 (Reuters); other surveys near 59,000
- Unemployment consensus: 4.2%
- September payrolls: 29,000
- October ADP private payrolls: 86,000
The gap to watch: consensus sits at 59,000-65,000 while ADP printed 86,000. That spread shows how a single release could drive a large reversal.
A weak print that confirms consumer softness could extend the selling. A firm one could revive hawkish Fed fears, and the AI-bubble debate sits behind both. If gold holds $4,000, yields keep falling and bitcoin loses support, the risk-off mood is intact. Gold slipping and yields rising alongside stocks would suggest the liquidation is easing.
A payrolls figure near the consensus matters less than where it sits against the breakeven range needed to absorb population growth, a threshold that decides whether weak hiring signals genuine slack.
What the jobs report can confirm, and what would change the picture
The most convincing read is a relief rally that removed event risk for one session, followed by a broader repricing of AI spending, regulation and liquidity. Fading hike odds offered little help because they increasingly reflect weaker demand, not cooling inflation.
Four variables will tell you whether that read holds:
- ES futures: around 7,200, then 7,000
- December hike odds: last near 65.4%
- Gold: holding above $4,000
- Payrolls: the print against the 59,000-65,000 consensus
The bull case rests on Wilson’s buy-the-dip view and strong post-midterm history. The bear case rests on technical damage and growth leaning on a narrow base. Friday’s data will not settle that debate, but it will show you which side the market is listening to.
These statements are speculative and subject to change based on market developments and economic data.
This article is for informational purposes only and should not be considered financial advice. Investors should conduct their own research and consult with financial professionals before making investment decisions.