Nasdaq futures were down nearly 2% overnight as Democrats claimed both chambers of Congress, the reaction most investors expected from a sweep that looked bad for tech. By late morning on Wednesday 4 November 2026, the Dow Jones Industrial Average was up more than 1,200 points and heading for its best session since April.
That reversal broke two assumptions at once: that a Democratic sweep would weigh on risk assets, and that bank scenario models had the size of the move roughly right. Unverified reports of Thursday’s session complicate the story. They say the next day gave back much of the gain and more.
This piece gives you a clear read on what volatility, oil, market breadth and options pricing say about a run toward record highs. It also sets out how much weight midterm history deserves when you are deciding whether this midterm election stock market rally has legs.
Why did the rally beat the bank scenarios and the bearish tech view?
The overnight drop looked like confirmation of the bearish case. Then buyers arrived, and by late morning the Nasdaq was up about 2%, the S&P 500 about 1.7% and the Dow more than 1,200 points.
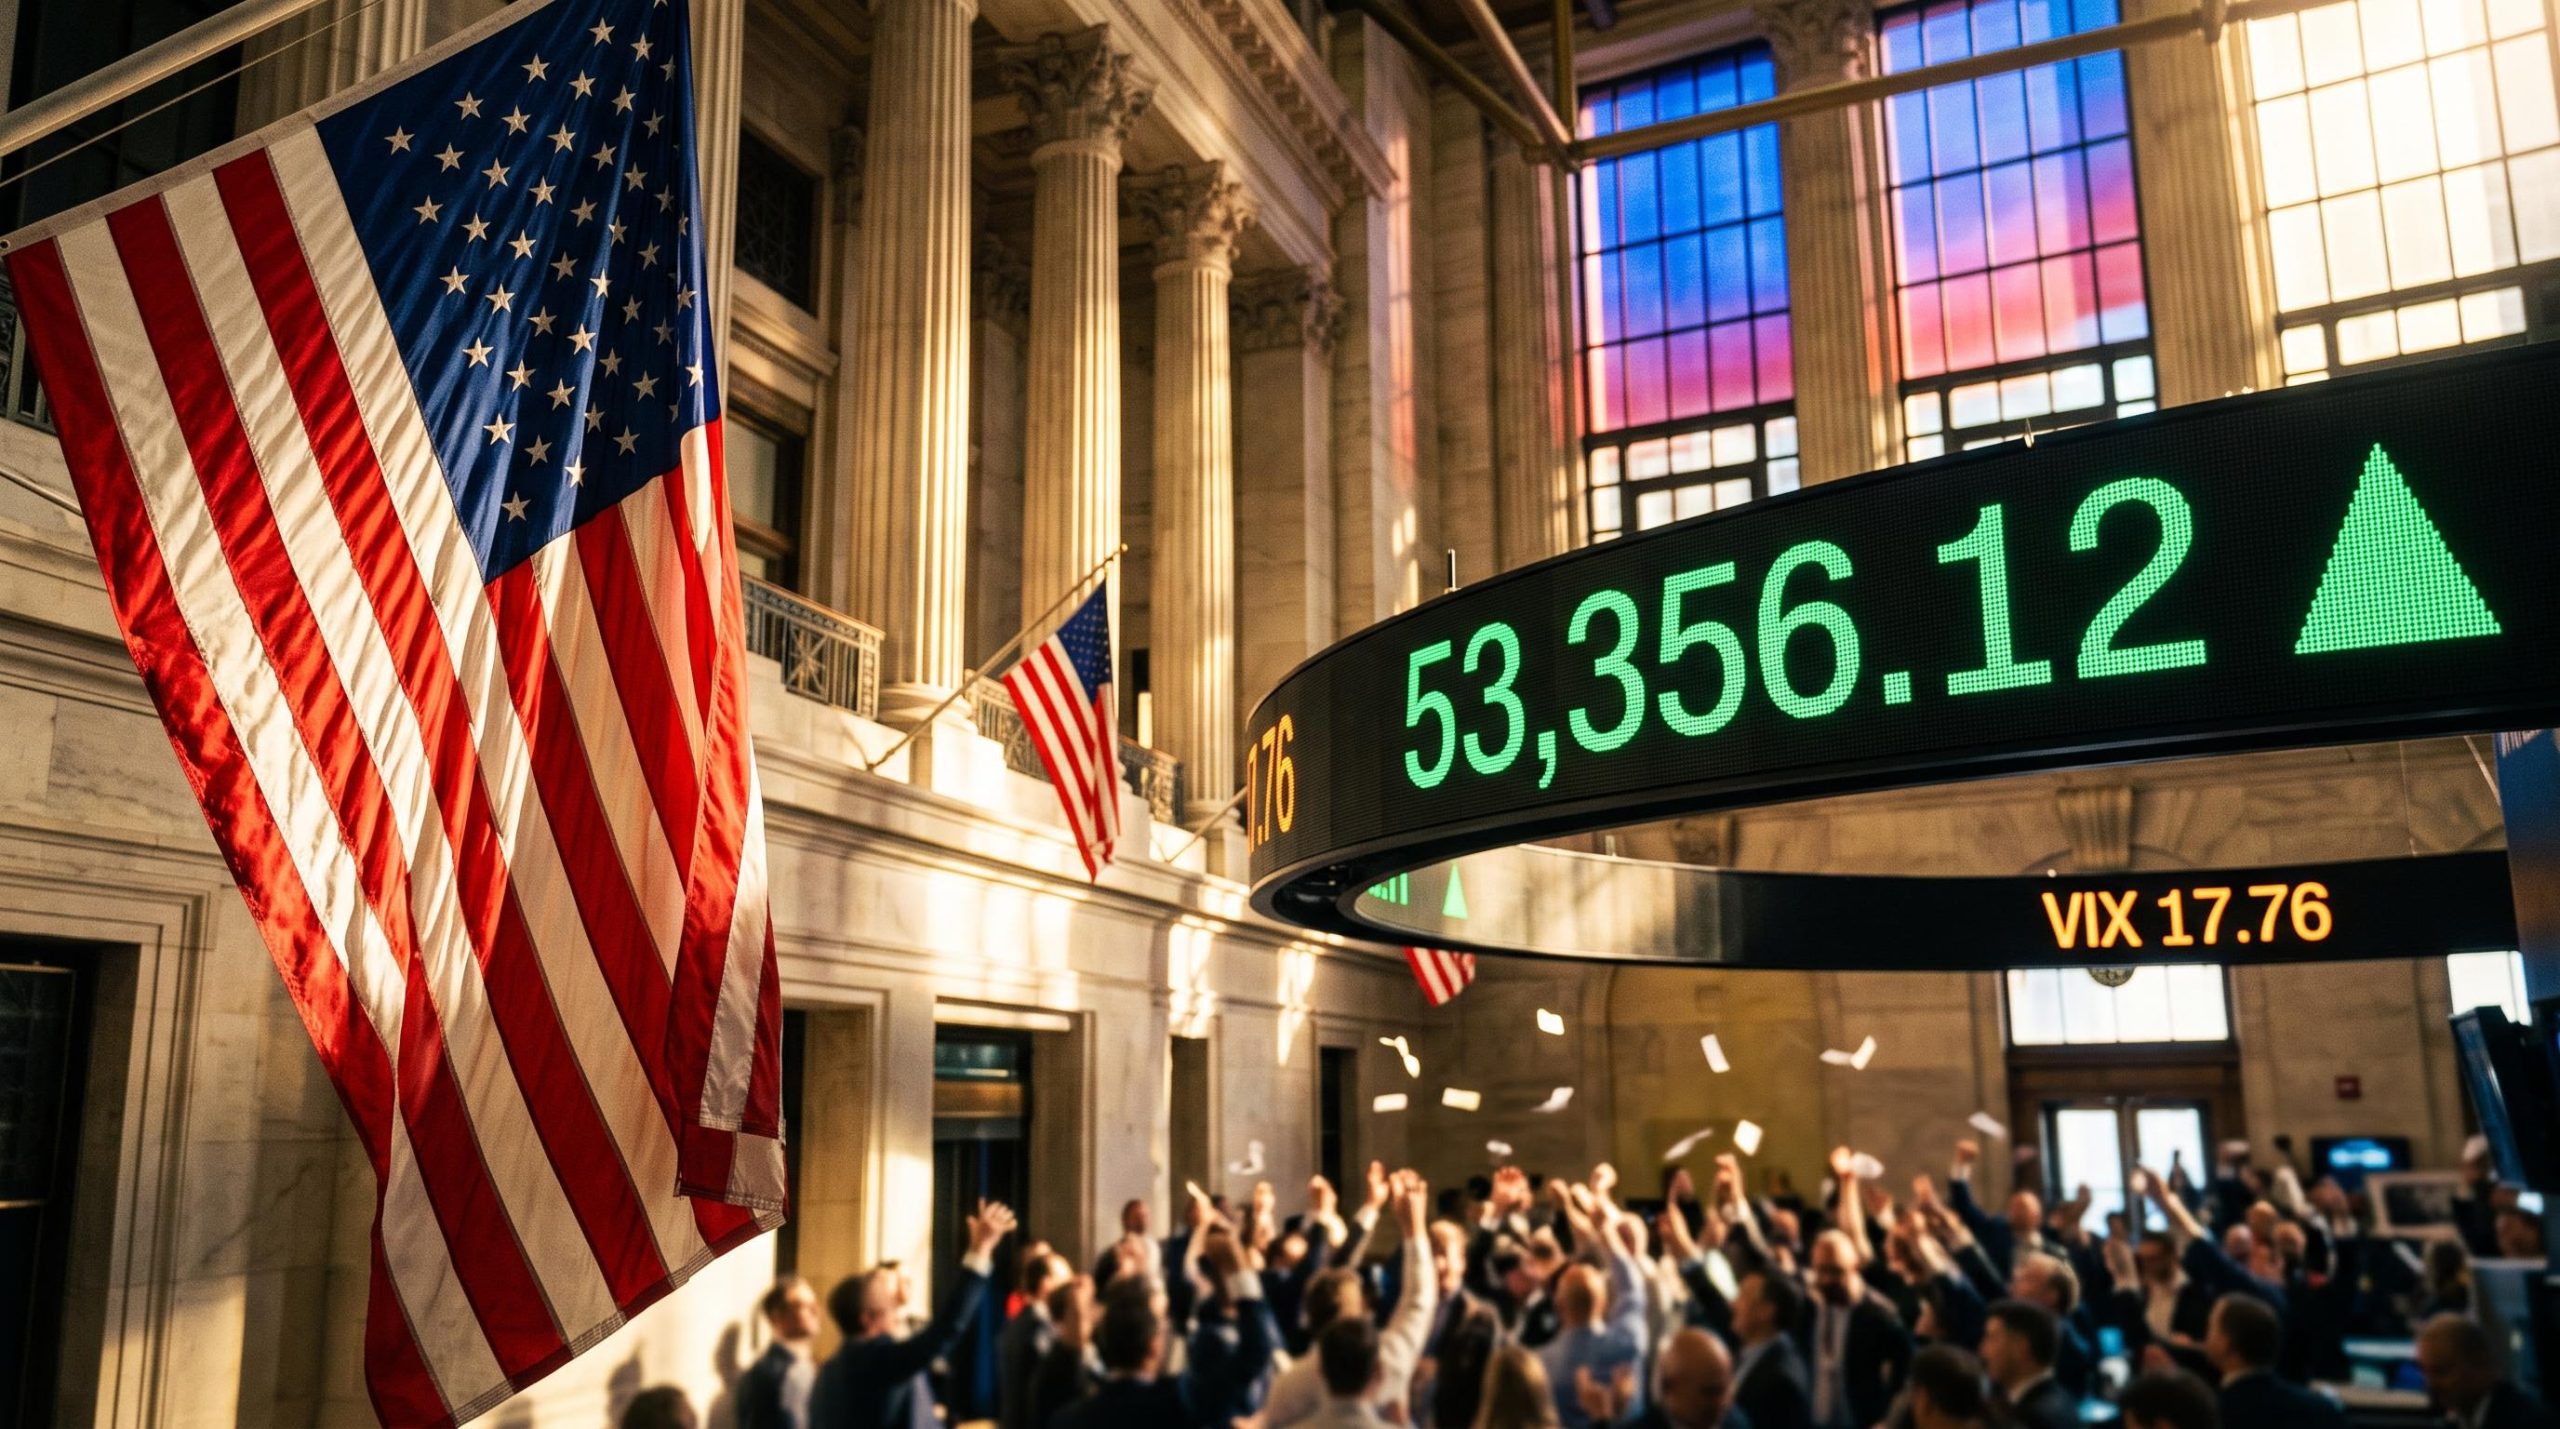
Reported closing figures, which have not been independently confirmed, show the S&P 500 at 7,688.62 (+1.58%), the Nasdaq Composite at 25,736.51 (+1.44%) and the Dow at 53,356.12 (+3.03%). The gap between the intraday and closing numbers is a matter of timing. The Nasdaq’s gain faded into the close while the Dow’s widened.
Part of the one-day jump likely reflects hedge unwinding, as dealers bought back short exposure built ahead of the vote and gamma amplified the move, which helps explain why Fed funds pricing barely shifted while equities surged.
Forecast versus outcome The original source said JPMorgan’s Democratic-sweep scenario anticipated an S&P move of at most 0.5%. Related coverage describes that scenario as roughly a 0.5% decline. The primary note was not accessible, but either reading puts the actual gain at more than triple the bank’s estimate.
Five forces explain the miss: the election uncertainty premium vanished, gridlock lowered the odds of abrupt policy change, tariff and geopolitical risk eased, the AI-regulation read favoured large platforms, and lower oil and Treasury yields supported growth valuations.
The split inside technology
Fundstrat’s Tom Lee had argued a sweep would not necessarily hurt tech. His reasoning was that tighter data-centre regulation could curb overbuilding, which would help cash-rich hyperscalers (the largest cloud computing platforms) by easing competitive pressure. Lee kept his year-end S&P 500 target above 8,200.
The tape agreed with him, but only for one side of tech. Reuters reported a Goldman Sachs estimate, not independently confirmed, that roughly 45% of planned US data-centre capacity could face moratoria or restrictions.
| Company | Group | Move (4 Nov) | Likely reason |
|---|---|---|---|
| Microsoft | Rallied | +6.7% | Less pressure to keep spending on capacity |
| Amazon | Rallied | +6.1% | Same hyperscaler logic |
| Apple | Rallied | About +5% to +6% | Mega-cap platform strength |
| Hut 8 | Fell | -23% | Permitting threat to growth plans |
| IREN | Fell | About -11% | Data-centre regulation risk |
| CoreWeave | Fell | About -9.5% | Infrastructure growth assumptions questioned |
Sources conflict on AMD, with one saying it fell after earnings and another reporting a gain, so its direction is left open here.
The index gain hid a sharp divergence. Check whether your own tech exposure sits with the platforms or the infrastructure builders, because on 4 November that distinction decided the outcome.
When big ASX news breaks, our subscribers know first
What do VIX, oil and breadth say about durability?
The platform-versus-builder split raises a bigger question: was this a calmer market, or just a relieved one? Three signals looked encouraging at first glance.
Volatility
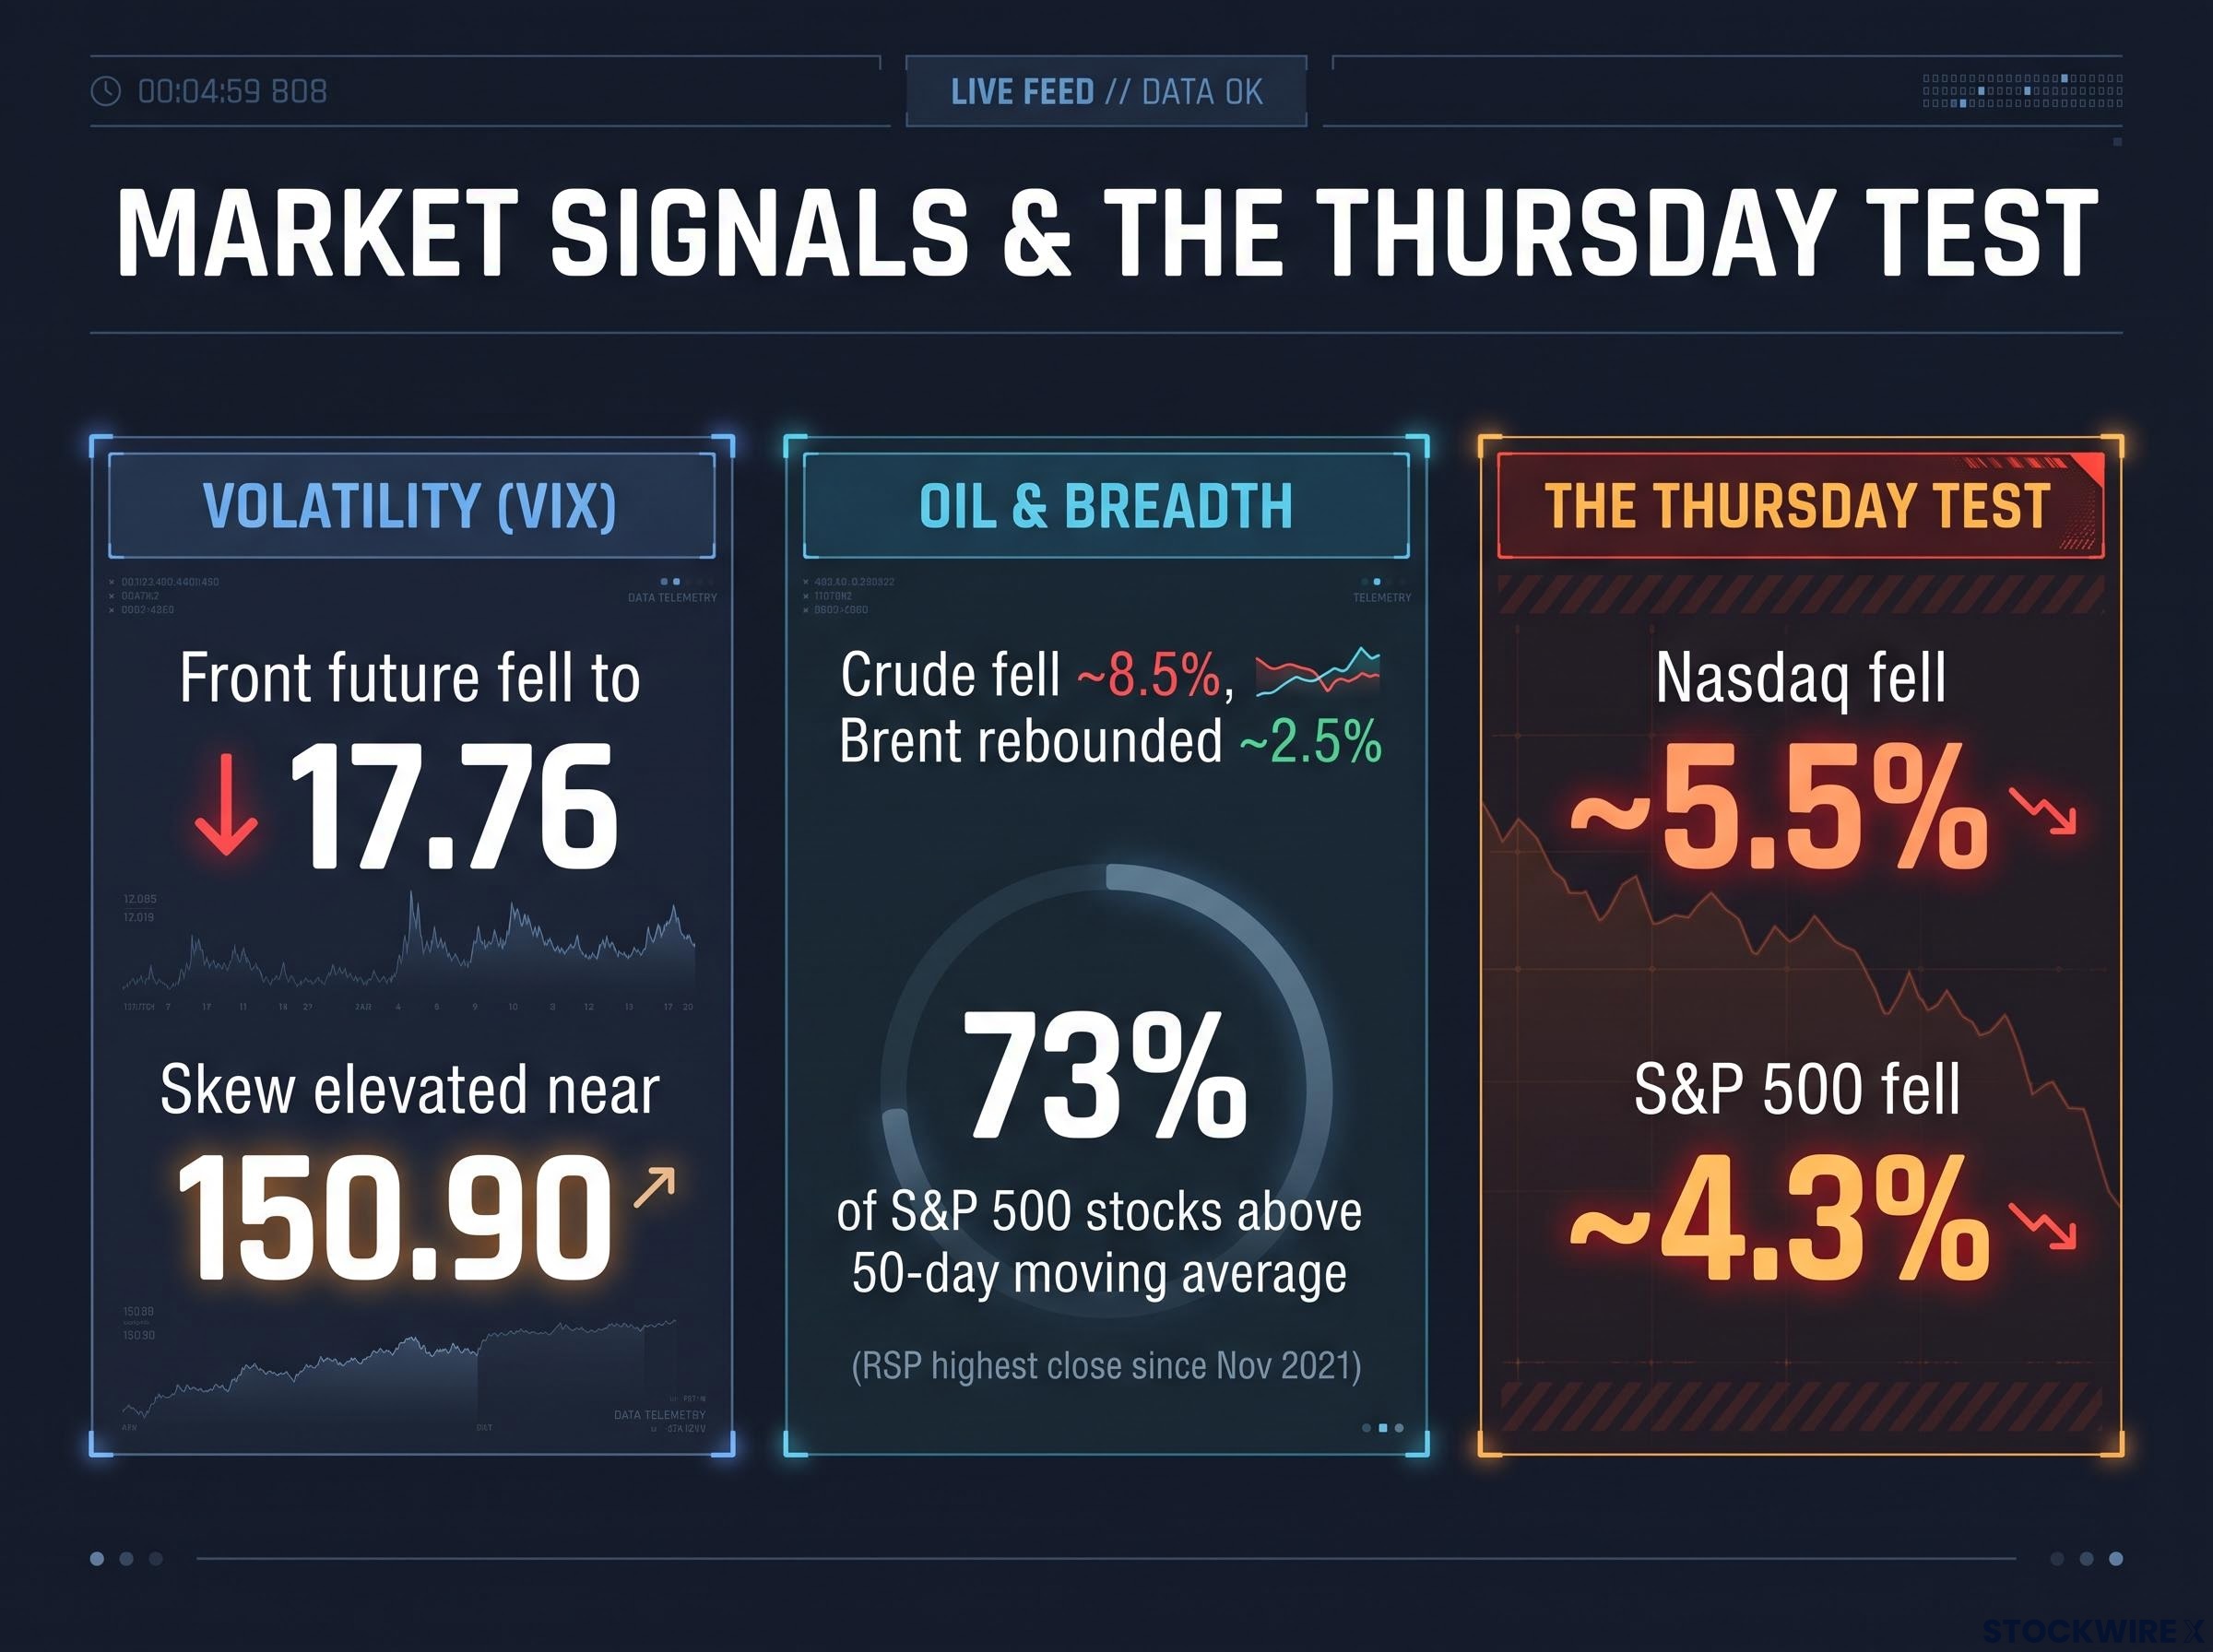
The VIX measures expected 30-day swings in the S&P 500, based on option prices. The front VIX future fell more than 10% to 17.76, below 18.02 for the next contract, and that upward slope persisted through the M27 contract.
That slope is called contango, which means later-dated futures cost more than near-dated ones. It usually signals that traders see no immediate threat. Later reports cite 17.90 and 18.11 for November and December contracts, which likely reflect different contracts and times, alongside VIX spot of 16.61 (unverified).
The qualifier is skew, near 150.90. That reading tells you downside protection was still expensive, so investors kept paying for crash insurance even as headline fear eased. Saxo Bank described the volatility regime as transitioning rather than definitively bullish (unverified).
Implied volatility skew compares what traders pay for downside puts with what they pay for equivalent calls, so an elevated reading signals anxiety about known catalysts rather than proof that a selloff is coming.
Oil and breadth
Crude fell about 8.5%, and its backwardation (near-term contracts priced above later ones, a sign of supply stress) largely disappeared. The May 2027 contract dipped toward 80. Brent reportedly fell to about $94.62, then rebounded about 2.5% on 5 November (unverified). That rebound shows how much the move depended on traders pricing de-escalation in the Iran conflict.
Breadth looked healthier. The equal-weighted S&P 500 fund RSP reportedly posted its highest close in data back to November 2021, and about 73% of S&P 500 stocks sat above their 50-day moving average.
Then came the test. Unverified reports say the Nasdaq fell about 5.5% and the S&P 500 about 4.3% on Thursday.
| Signal | Bullish reading | Limitation | Nov 5 test |
|---|---|---|---|
| VIX contango | Election hedge removed | Contango is normal; skew still elevated | Volatility returned quickly |
| Oil backwardation fading | Lower inflation and geopolitical risk | Relies on Iran de-escalation odds | Brent rebounded about 2.5% |
| RSP near record | Participation beyond mega-caps | One close is not a trend | Broad selloff followed |
Contango is normal and is not a buy signal. Treat these readings as conditions that permit a rally rather than proof that one is under way.
What do options say about the odds of SPX reaching 8,200 by year-end?
If the calming signals only permit a rally, options pricing shows how far the market thinks one might run. The number is smaller than most readers would guess.
Lee’s year-end target of 8,200 carried roughly a 5% in-the-money probability before the election. After the rally, it was about 7-8%. Lee has also reportedly floated a possible 8,200-8,400 range (unverified).
- What the probability measures: the options-implied chance of the S&P 500 finishing the year at or above 8,200, with the reported 7,688.62 close still more than 500 points short.
- Why it moved: the index rallied toward the strike, but falling volatility compresses such probabilities, which is why the figure was higher at the E-mini futures peak.
- What moves it next: another rally of about 130 points or more could push the probability toward roughly a one-standard-deviation range.
A doubling sounds dramatic. From a base of 5%, it still leaves the target as a long shot.
Read this before treating the odds as a forecast Options-implied probabilities are risk-neutral prices, not predictions. They are extracted from option prices, and skew, hedging demand, risk premia and liquidity can make them differ materially from a strategist’s view such as Lee’s.
The market is pricing Lee’s target as a tail outcome. Treat 8,200 as a scenario to monitor rather than your base case. These figures are speculative and subject to change based on market developments.
What does midterm-year history actually tell you?
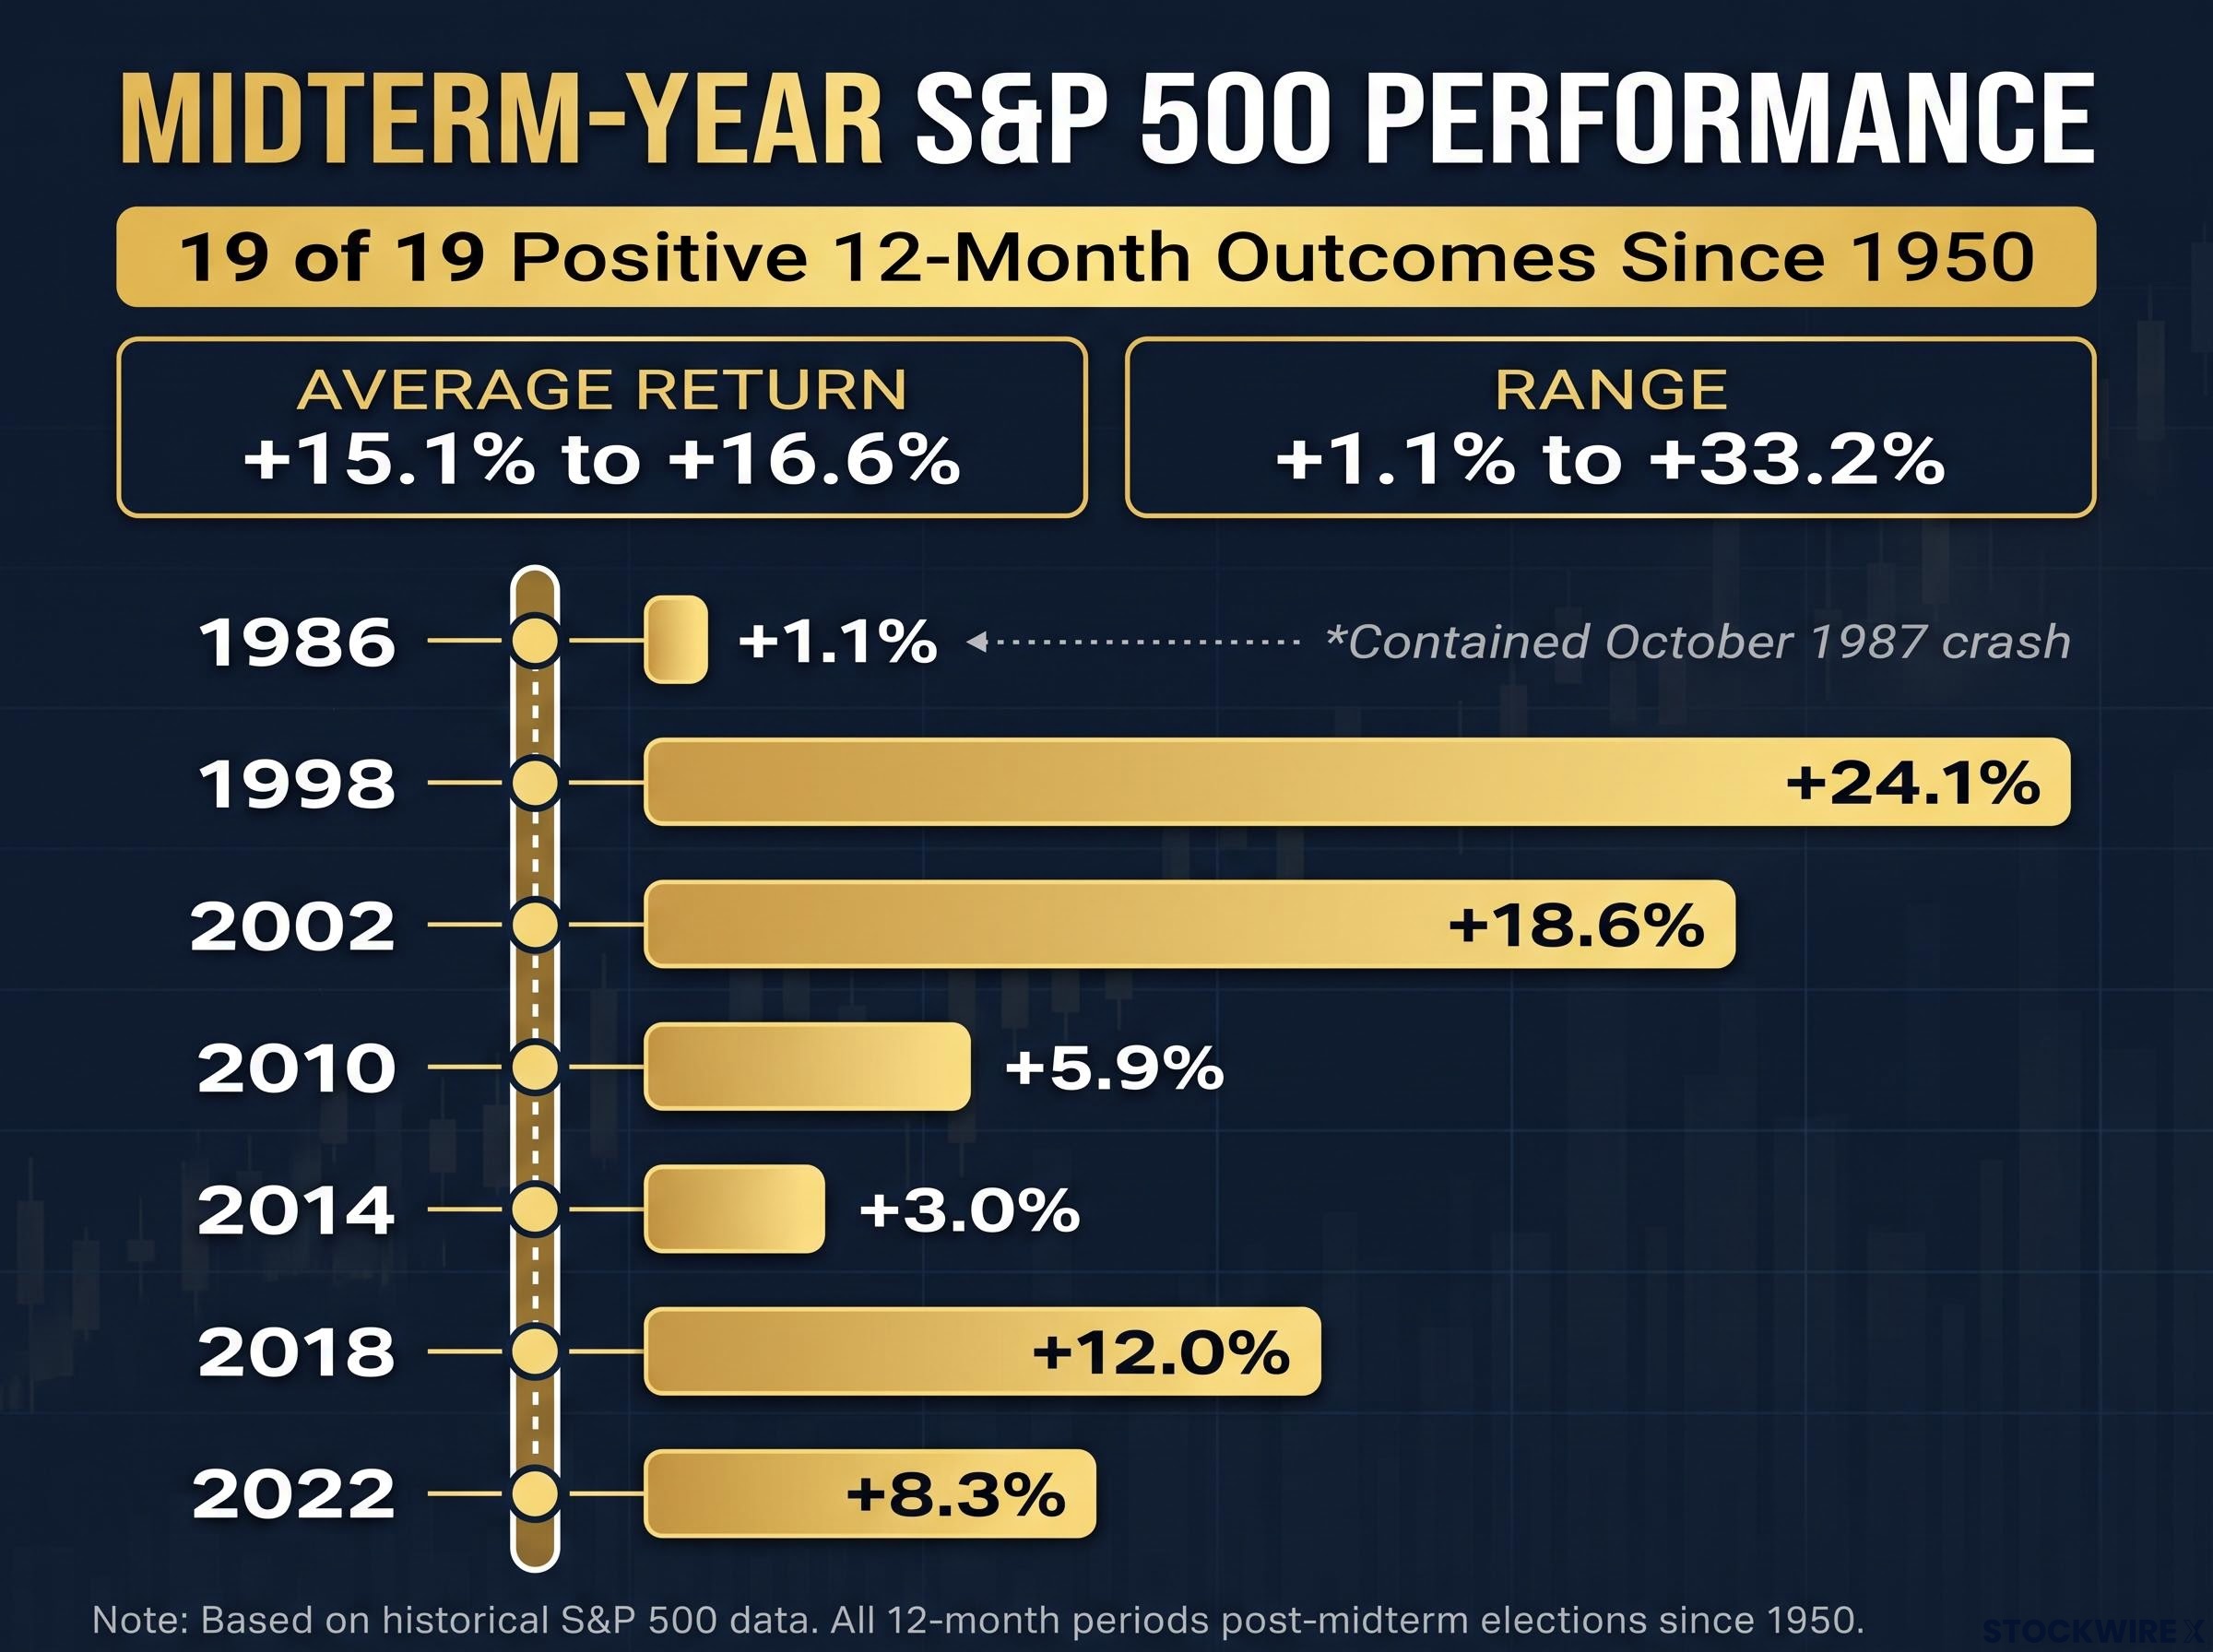
Options describe the next eight weeks. History offers a longer lens, and its headline is striking: since 1950, the S&P 500 has been higher 12 months after each of the 19 midterm elections, averaging roughly 15%.
Published averages range from about 15% to 17% because studies use different starting points. LPL Research data via Bloomberg measures from election-day closes, while the Stock Trader’s Almanac compilation measures from end-October levels.
| Measure | Result | Note |
|---|---|---|
| Positive 12-month outcomes | 19 of 19 | Since 1950 |
| Average 12-month return | +15.1% | LPL/Bloomberg, unverified |
| Alternative average | +16.6% | Stock Trader’s Almanac, unverified |
| Range | +1.1% to +33.2% | 1986 low, 1954 high |
| Average 3-month / 6-month | +6.3% / +12.8% | Approximate |
Selected years show the spread: 1998 returned 24.1%, 2002 18.6%, 2010 5.9%, 2014 3.0%, 2018 12.0% and 2022 8.3%. CNN compared Wednesday’s jump with 2018 as one of the largest post-midterm single-day gains since 1982 (unverified).
The 1986 figure deserves attention. A 1.1% positive year contained the October 1987 crash.
Analysts generally attribute the post-midterm pattern to uncertainty resolution rather than the winning party, since settled results let sidelined capital return to equities, though a strong first half in 2026 starts this cycle from an elevated base.
Hold the pattern loosely for three reasons:
- It is descriptive, not causal. Elections do not mechanically produce gains.
- The sample is small. Nineteen observations span very different rate, inflation and valuation regimes.
- The endpoint hides the path. The 1987 crash and 2022’s tight Fed policy both sat inside positive windows.
History tilts the odds toward a positive 12 months but says nothing about the route. Plan for drawdowns inside the year. Past performance does not guarantee future results.
What the sweep rally settles, and what it leaves open for the weeks ahead
Wednesday settled one thing: political relief was real. Falling uncertainty, cheaper oil and a gridlock read explained a move that beat the bank scenarios.
Thursday’s reported reversal settled something else. AI investment returns, tech concentration, valuation and chip demand still drive this market more than Congress does.
Four markers will show whether the relief becomes a trend:
- Breadth: whether RSP and the share of stocks above their 50-day average hold up.
- VIX: whether contango survives and skew eases.
- Oil: whether Brent resumes falling or keeps rebounding.
- Data-centre regulation: headlines that could widen the platform-builder split.
Treat options odds and midterm history as context for your decisions, not forecasts.
This article is for informational purposes only and should not be considered financial advice. Investors should conduct their own research and consult with financial professionals before making investment decisions.