The Philadelphia Semiconductor Index just hit an all-time high. S&P 500 earnings grew 29.3% in Q1 2026. SpaceX and an Apple–Intel chip partnership are dominating the financial headlines. And yet, two of the most consequential data releases of the year arrive next week: the Fed’s preferred inflation gauge and the final Q1 GDP estimate.
Markets priced for perfection are not simply exposed to bad news. They are exposed to the ordinary, because ordinary normalisation reads as disappointment when valuations assume everything will stay extraordinary. That is precisely the configuration U.S. equities occupy as of mid-June 2026, and the upcoming macro calendar is the pressure test.
What follows is an analysis of three specific macro risks that strategists are tracking beneath the AI euphoria: a sticky PCE print, a softer growth baseline, and a wealth-effect feedback loop that could turn a market pullback into a genuine economic shock. The risk is asymmetric, and the window in which it materialises is narrow.
A market priced for perfection has no margin for ordinary disappointment
The AI-driven catalysts behind the 2026 rally are real. The week ending 19 June 2026 delivered fresh evidence: the S&P 500 gained approximately 1%, with broad indices holding near all-time highs, while the Philadelphia SE Semiconductor Index reached a record, up roughly 7% over the same period.
Recent sentiment boosters have arrived in quick succession:
- Apple and Intel announced a domestic chip design and manufacturing partnership
- SpaceX began trading publicly, reinforcing AI and tech enthusiasm
- Astera Labs and CoreWeave were added to the Nasdaq, compelling index-tracking funds to buy into those names mechanically
Each of these is a legitimate structural development. None of them, however, changes the macro foundation those valuations sit on, and that foundation is only moderately strong.
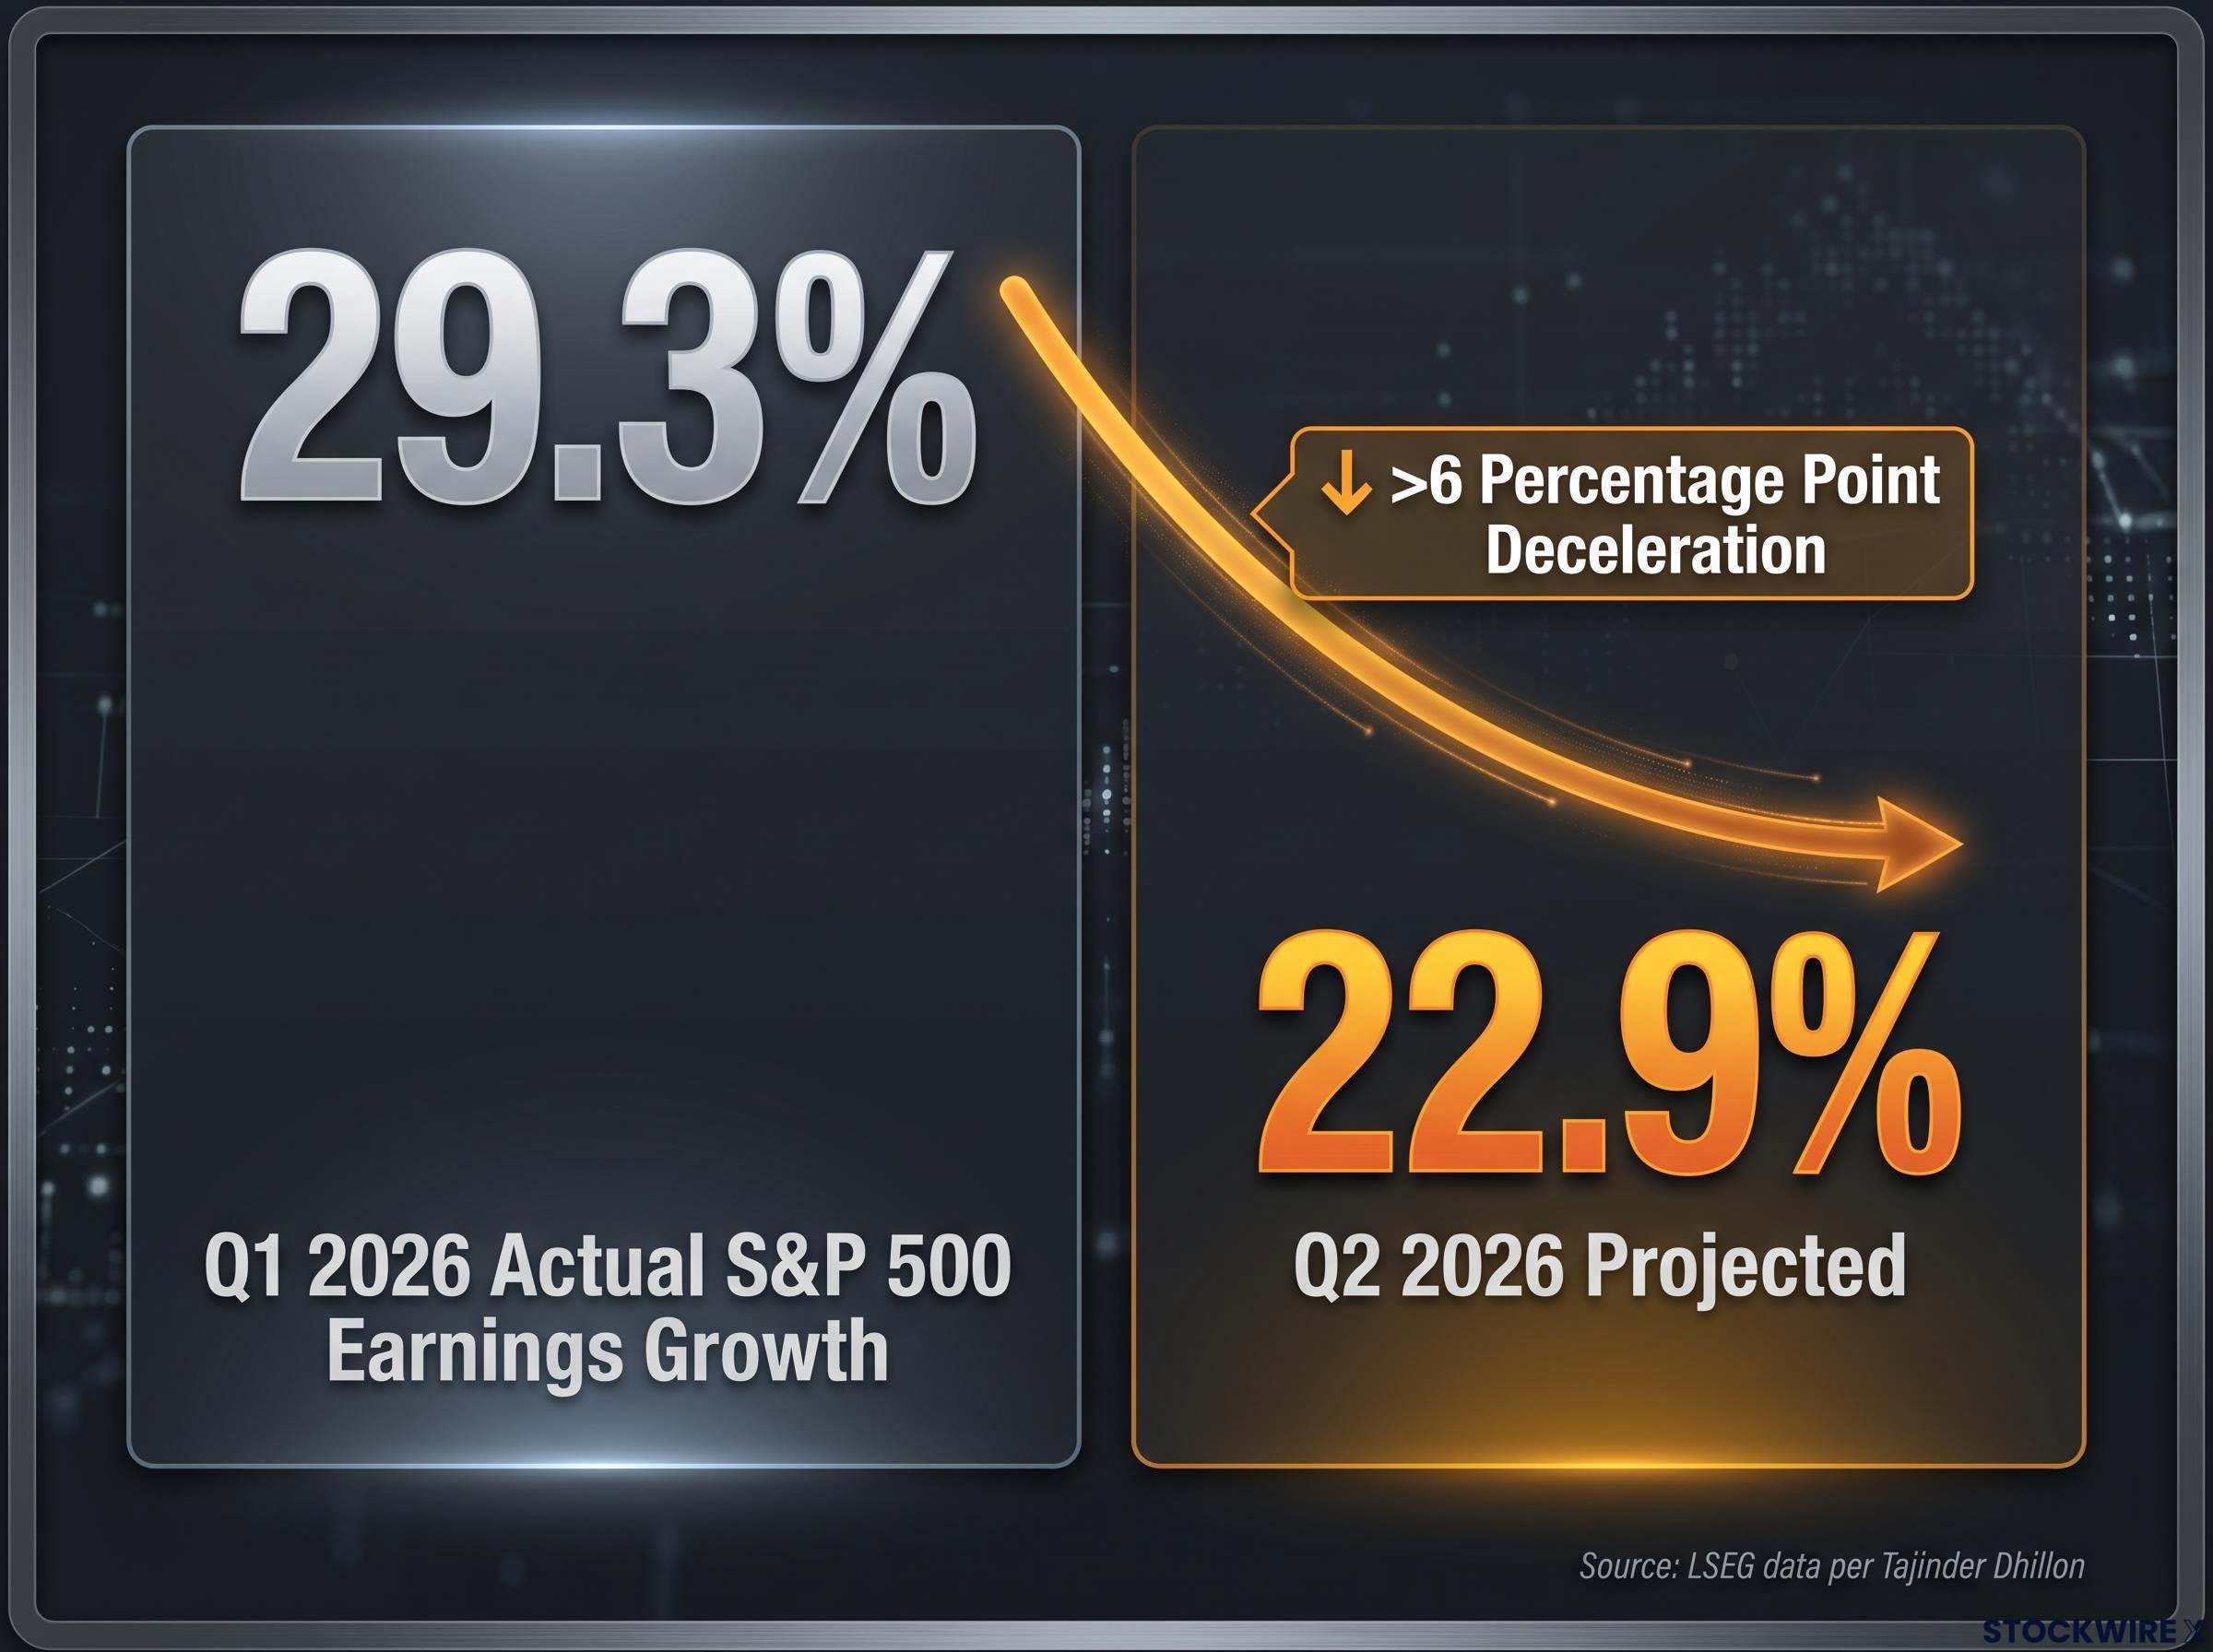
Earnings deceleration in focus: Q2 2026 S&P 500 earnings growth is projected at 22.9%, down from 29.3% in Q1 2026, according to Tajinder Dhillon, Head of Earnings Research at LSEG.
That deceleration matters because in a market priced for sustained hyper-growth, ordinary normalisation is not treated as healthy. It is treated as failure. The upcoming data releases carry asymmetric downside: benign numbers confirm what is already priced, while disappointing numbers challenge the entire narrative structure at once.
When big ASX news breaks, our subscribers know first
What the Fed’s inflation gauge will reveal about the rally’s foundations
The May PCE inflation print, scheduled for release on 25 June 2026, is the single most consequential number for U.S. equities in the near term. The Federal Reserve targets 2% inflation as measured by the Personal Consumption Expenditures (PCE) price index, not the more widely cited Consumer Price Index (CPI). On a 12-month basis, core PCE remains above that 2% target.
May CPI data published on 10 June 2026 already showed headline inflation at 4.2% year-over-year while core CPI held at a comparatively contained 2.9%, a 1.3 percentage-point gap that identifies the current inflation spike as geopolitical and energy-driven rather than broad-based domestic overheating, a distinction that will determine whether a firm PCE reading forces a genuine policy response.
The current rally is priced for a Goldilocks disinflation path: inflation cooling steadily toward target, clearing the way for rate cuts that would validate current multiples. A hotter-than-expected print breaks that specific narrative through a sequential chain of consequences:
- A firmer PCE reading would push out the timing and probability of rate cuts currently embedded in equity valuations
- That delay reprices discount rates upward across the curve
- Higher discount rates compress the present value of future cash flows, hitting long-duration growth stocks first
The second consequence is potentially more damaging: a hot print would reopen the question of whether current policy is restrictive enough at all, shifting the debate from “higher for longer” to “not high enough.”
Why long-duration AI stocks bear the most rate-repricing risk
The same AI-linked enthusiasm that inflated multiples across semiconductor, cloud infrastructure, and AI platform names also extended their duration profile. These companies are valued overwhelmingly on earnings projected years into the future. Any upward revision in rate expectations compresses those valuations disproportionately.
The names that drove the 2026 rally would absorb the sharpest repricing. Investors holding concentrated positions in those stocks face the most direct exposure to a single data print.
AI stock valuation risk is structurally obscured at the index level because large opposing moves by individual winners and losers cancel each other out, leaving passive investors exposed to single-stock concentration they believe they have diversified away, with the top five companies now controlling roughly 30% of total US market capitalisation.
How America’s real economic growth compares to what markets are assuming
Real U.S. GDP grew at a 1.6% annualised rate in Q1 2026, according to the Bureau of Economic Analysis. That figure represented an improvement from the 0.5% recorded in Q4 2025, but it fell below the advance estimate of approximately 2% published earlier in the quarter.
The Bureau of Economic Analysis Q1 2026 GDP estimate, published on 28 May 2026, confirmed real gross domestic product grew at an annualised rate of 1.6%, revising down the advance reading and establishing a weaker growth baseline than the equity market’s elevated valuations had assumed.
| Period | GDP Annualised Growth | Context |
|---|---|---|
| Q4 2025 | 0.5% | Near-stall speed, weakest quarter in two years |
| Q1 2026 (advance estimate) | ~2.0% | Initial reading suggested a recovery |
| Q1 2026 (second estimate) | 1.6% | Revised down, removing part of the recovery narrative |
The final third estimate of Q1 GDP is due during the week of 23 June 2026. A further downward revision would cement a weaker starting point than the equity market’s AI euphoria implies, leaving less cushion to absorb any subsequent negative shock.
The genuinely dangerous scenario is the combination of sticky PCE and softer GDP: inflation too high for the Fed to ease, growth not strong enough to justify elevated multiples. That is a mild stagflationary echo, and it would narrow the path to the soft landing that current equity valuations depend on.
The wealth effect: why a market correction would not stay in the markets
There is a feedback mechanism that most investors underweight: the rally itself has become structurally load-bearing for the real economy.
Drew Matus, Chief Market Strategist at MetLife Investment Management, has explicitly flagged this concern.
“Any reversal in equity market gains could diminish consumer wealth and have broader economic consequences beyond just market impacts.”
The mechanism is straightforward. Rising equity values boost household net worth, which in turn supports consumer confidence and spending. Central-bank research estimates that a 10% rise in real net financial wealth can lift consumer spending by approximately 0.7% over the long run. The effect operates in both directions.
NBER research on the stock market wealth effect estimates that each dollar of increased equity wealth raises consumer spending by approximately 2.8 cents annually, a modest marginal rate that nonetheless aggregates to a substantial consumption drag when equity values fall across an entire household sector.
Consumption accounts for approximately two-thirds of U.S. GDP. An equity correction of meaningful size would transmit through multiple channels:
- Discretionary spending would contract as households perceive diminished wealth
- Housing turnover would slow as the confidence that supports large purchases erodes
- Small-business risk-taking would pull back as founders and operators see portfolio values decline
- Financial conditions would tighten indirectly, even without a Fed move, as collateral values fall
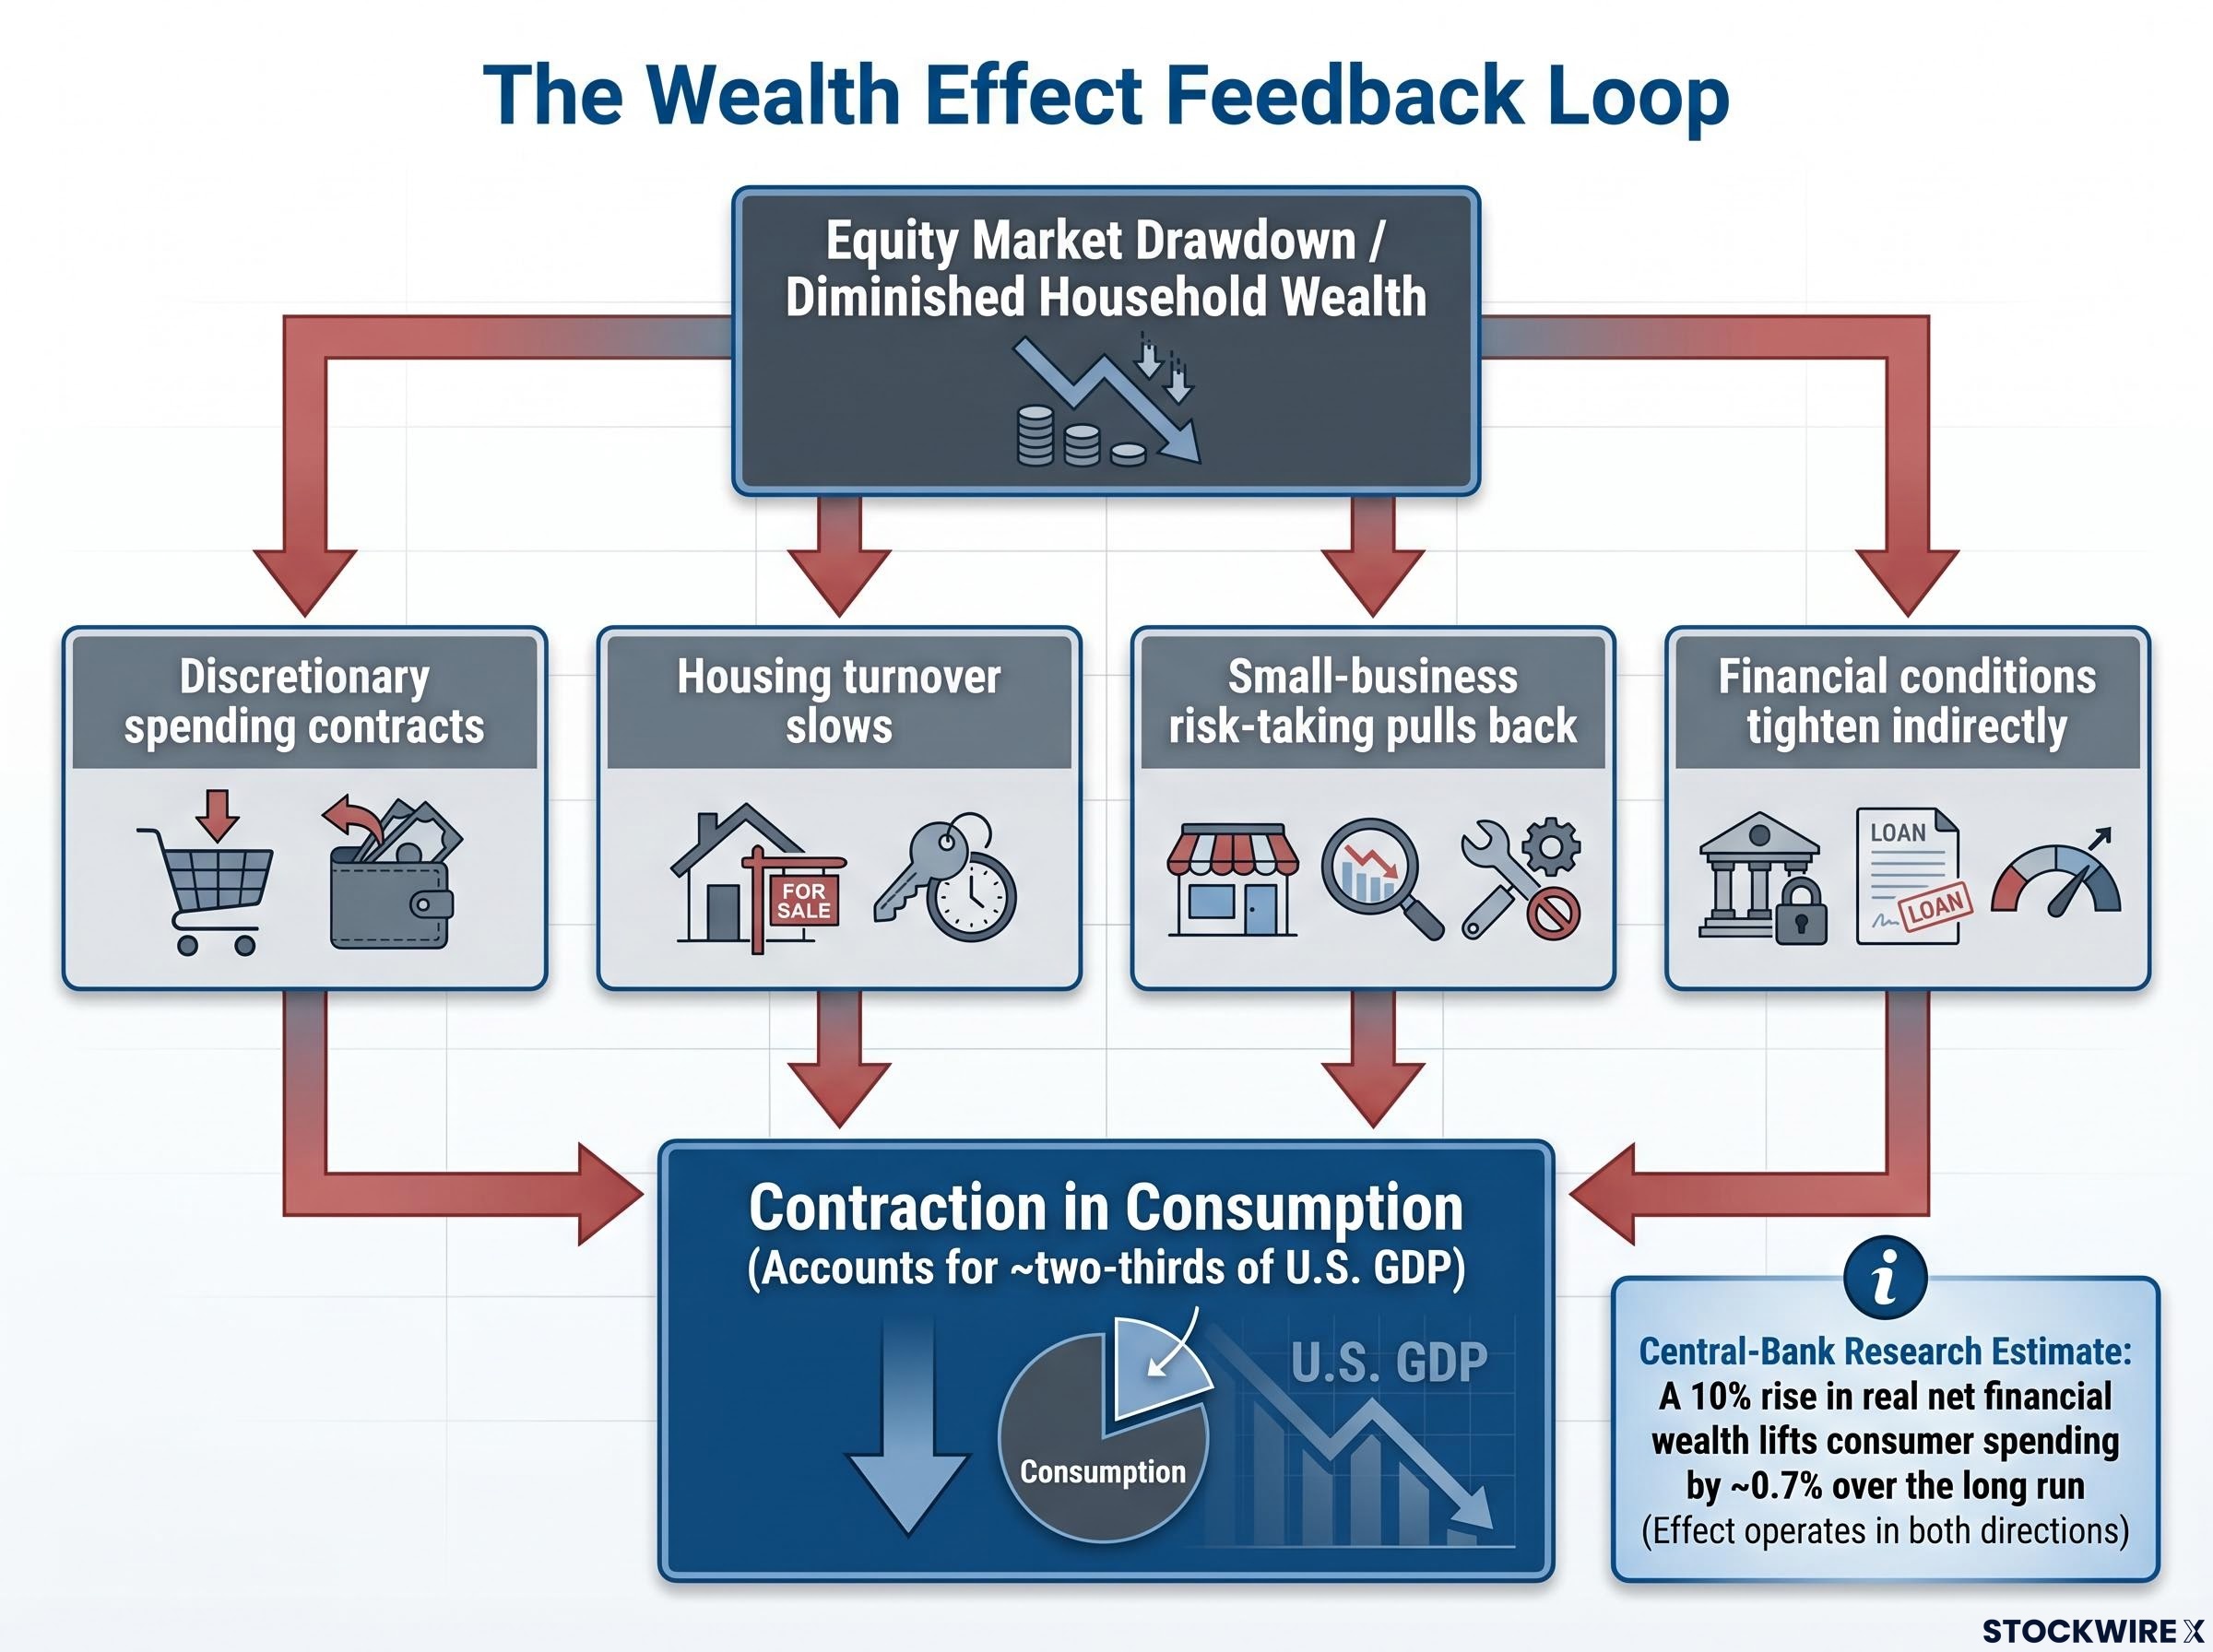
This reframes the stakes. A market pullback is not a self-contained portfolio problem. If equity gains are now supporting consumption, a correction becomes a macro event that feeds back into the very earnings those equities are priced on. The feedback loop is circular, and in a stretched-valuation environment, it does not need an exogenous shock to accelerate.
What the earnings deceleration signals before the market has priced it in
S&P 500 earnings growth of 29.3% in Q1 2026 was, in absolute terms, strong by any historical standard. The Q2 2026 projection of 22.9%, per LSEG data from Tajinder Dhillon, is also strong in level terms.
The problem is direction.
Forward guidance signals rather than backward-looking headline beats have become the primary market mover in a stretched-valuation environment, a dynamic visible in the divergent reactions to Q1 2026 results, where companies that beat EPS estimates but offered cautious outlooks were sold while those with accelerating revenue guidance were rewarded regardless of current margins.
Markets in stretched-valuation environments respond to the rate of change and the surprise factor, not just the headline number. A move from 29.3% to 22.9% is a deceleration of more than six percentage points in a single quarter. A further glide from approximately 23% toward mid-teens growth in subsequent quarters would be entirely consistent with a healthy corporate environment, yet could still compress multiples.
The core tension: earnings remain strong in level terms, but markets price direction and surprise. In a stretched-valuation regime, good news that merely matches expectations carries no upside, while any miss carries disproportionate weight.
Priced for perfection means the bar keeps moving higher
A “priced for perfection” market redefines what counts as an earnings beat. It requires not just better results, but accelerating results. When growth decelerates, even from an elevated base, the algorithmic and systematic strategies that dominate short-term price action do not distinguish between healthy normalisation and genuine deterioration. The response is the same: sell.
Nasdaq index inclusions of Astera Labs and CoreWeave will mechanically push index-tracking funds into these names, concentrating the multiple-compression risk further. If AI-linked growth disappoints even modestly, the forced buying that index inclusion creates will have positioned capital precisely where the repricing would be sharpest.
For investors wanting to stress-test the earnings foundation beneath current valuations in detail, our full explainer on Q1 2026 earnings and S&P 500 valuation covers Morgan Stanley’s earnings expansion thesis, the 84% beat rate, and the distinction between multiple expansion risk and genuine earnings deterioration risk, providing the quantitative baseline against which the deceleration from 29.3% to 22.9% should be measured.
Three data points, two weeks, one convergence that investors cannot ignore
The three risk threads analysed above converge on a single window. The May PCE inflation print arrives on 25 June 2026. The final Q1 GDP estimate is due during the same week. And the earnings deceleration from 29.3% to 22.9% forms the backdrop against which both data points will be interpreted.
The convergence scenario unfolds in sequence:
- A hotter-than-expected PCE print pushes out rate cut expectations, repricing discount rates upward
- A softer final GDP revision removes the growth cushion that justified holding through stretched valuations
- The resulting equity drawdown activates the wealth-effect feedback loop, turning a market event into a consumption and earnings shock
| Risk Factor | Trigger | Market Impact |
|---|---|---|
| PCE inflation | May print firmer than expected (25 June 2026) | Rate cuts delayed; long-duration AI names repriced |
| Q1 GDP revision | Final estimate revised lower (week of 23 June 2026) | Growth narrative weakened; soft-landing path narrowed |
| Wealth-effect reversal | Equity drawdown following macro disappointment | Consumption drag feeds back into earnings and GDP |
The asymmetry is clear. Benign data merely confirms what is already priced into record-high valuations. Disappointing data challenges the policy path, the earnings narrative, and the consumption assumption simultaneously. That is not symmetric risk; it is a setup where downside carries materially more consequence than upside.
The quiet risks that outlast the headlines
The AI-driven 2026 rally has real structural supports. The Apple-Intel partnership, SpaceX’s public listing, and sustained corporate AI investment are not fabricated catalysts. But those supports sit on a macro foundation that is neither as strong nor as inflation-free as the price action implies.
Three risks converge on the same two-week window: sticky inflation that could delay rate relief, a softer growth baseline that removes the cushion markets have quietly assumed, and a wealth-effect feedback loop that would transmit any drawdown directly into the real economy. Each is individually manageable. Together, they represent a stress test that record-high valuations have left no margin to absorb.
The PCE and GDP releases arriving the week of 23 June 2026 are not isolated data points. They are a joint test of whether the macro foundation can bear the weight the market has placed on it. Investors with concentrated exposure to AI-linked, long-duration equities have the highest near-term sensitivity to both prints, and the least room for error.
This article is for informational purposes only and should not be considered financial advice. Investors should conduct their own research and consult with financial professionals before making investment decisions. Past performance does not guarantee future results, and financial projections are subject to market conditions and various risk factors.