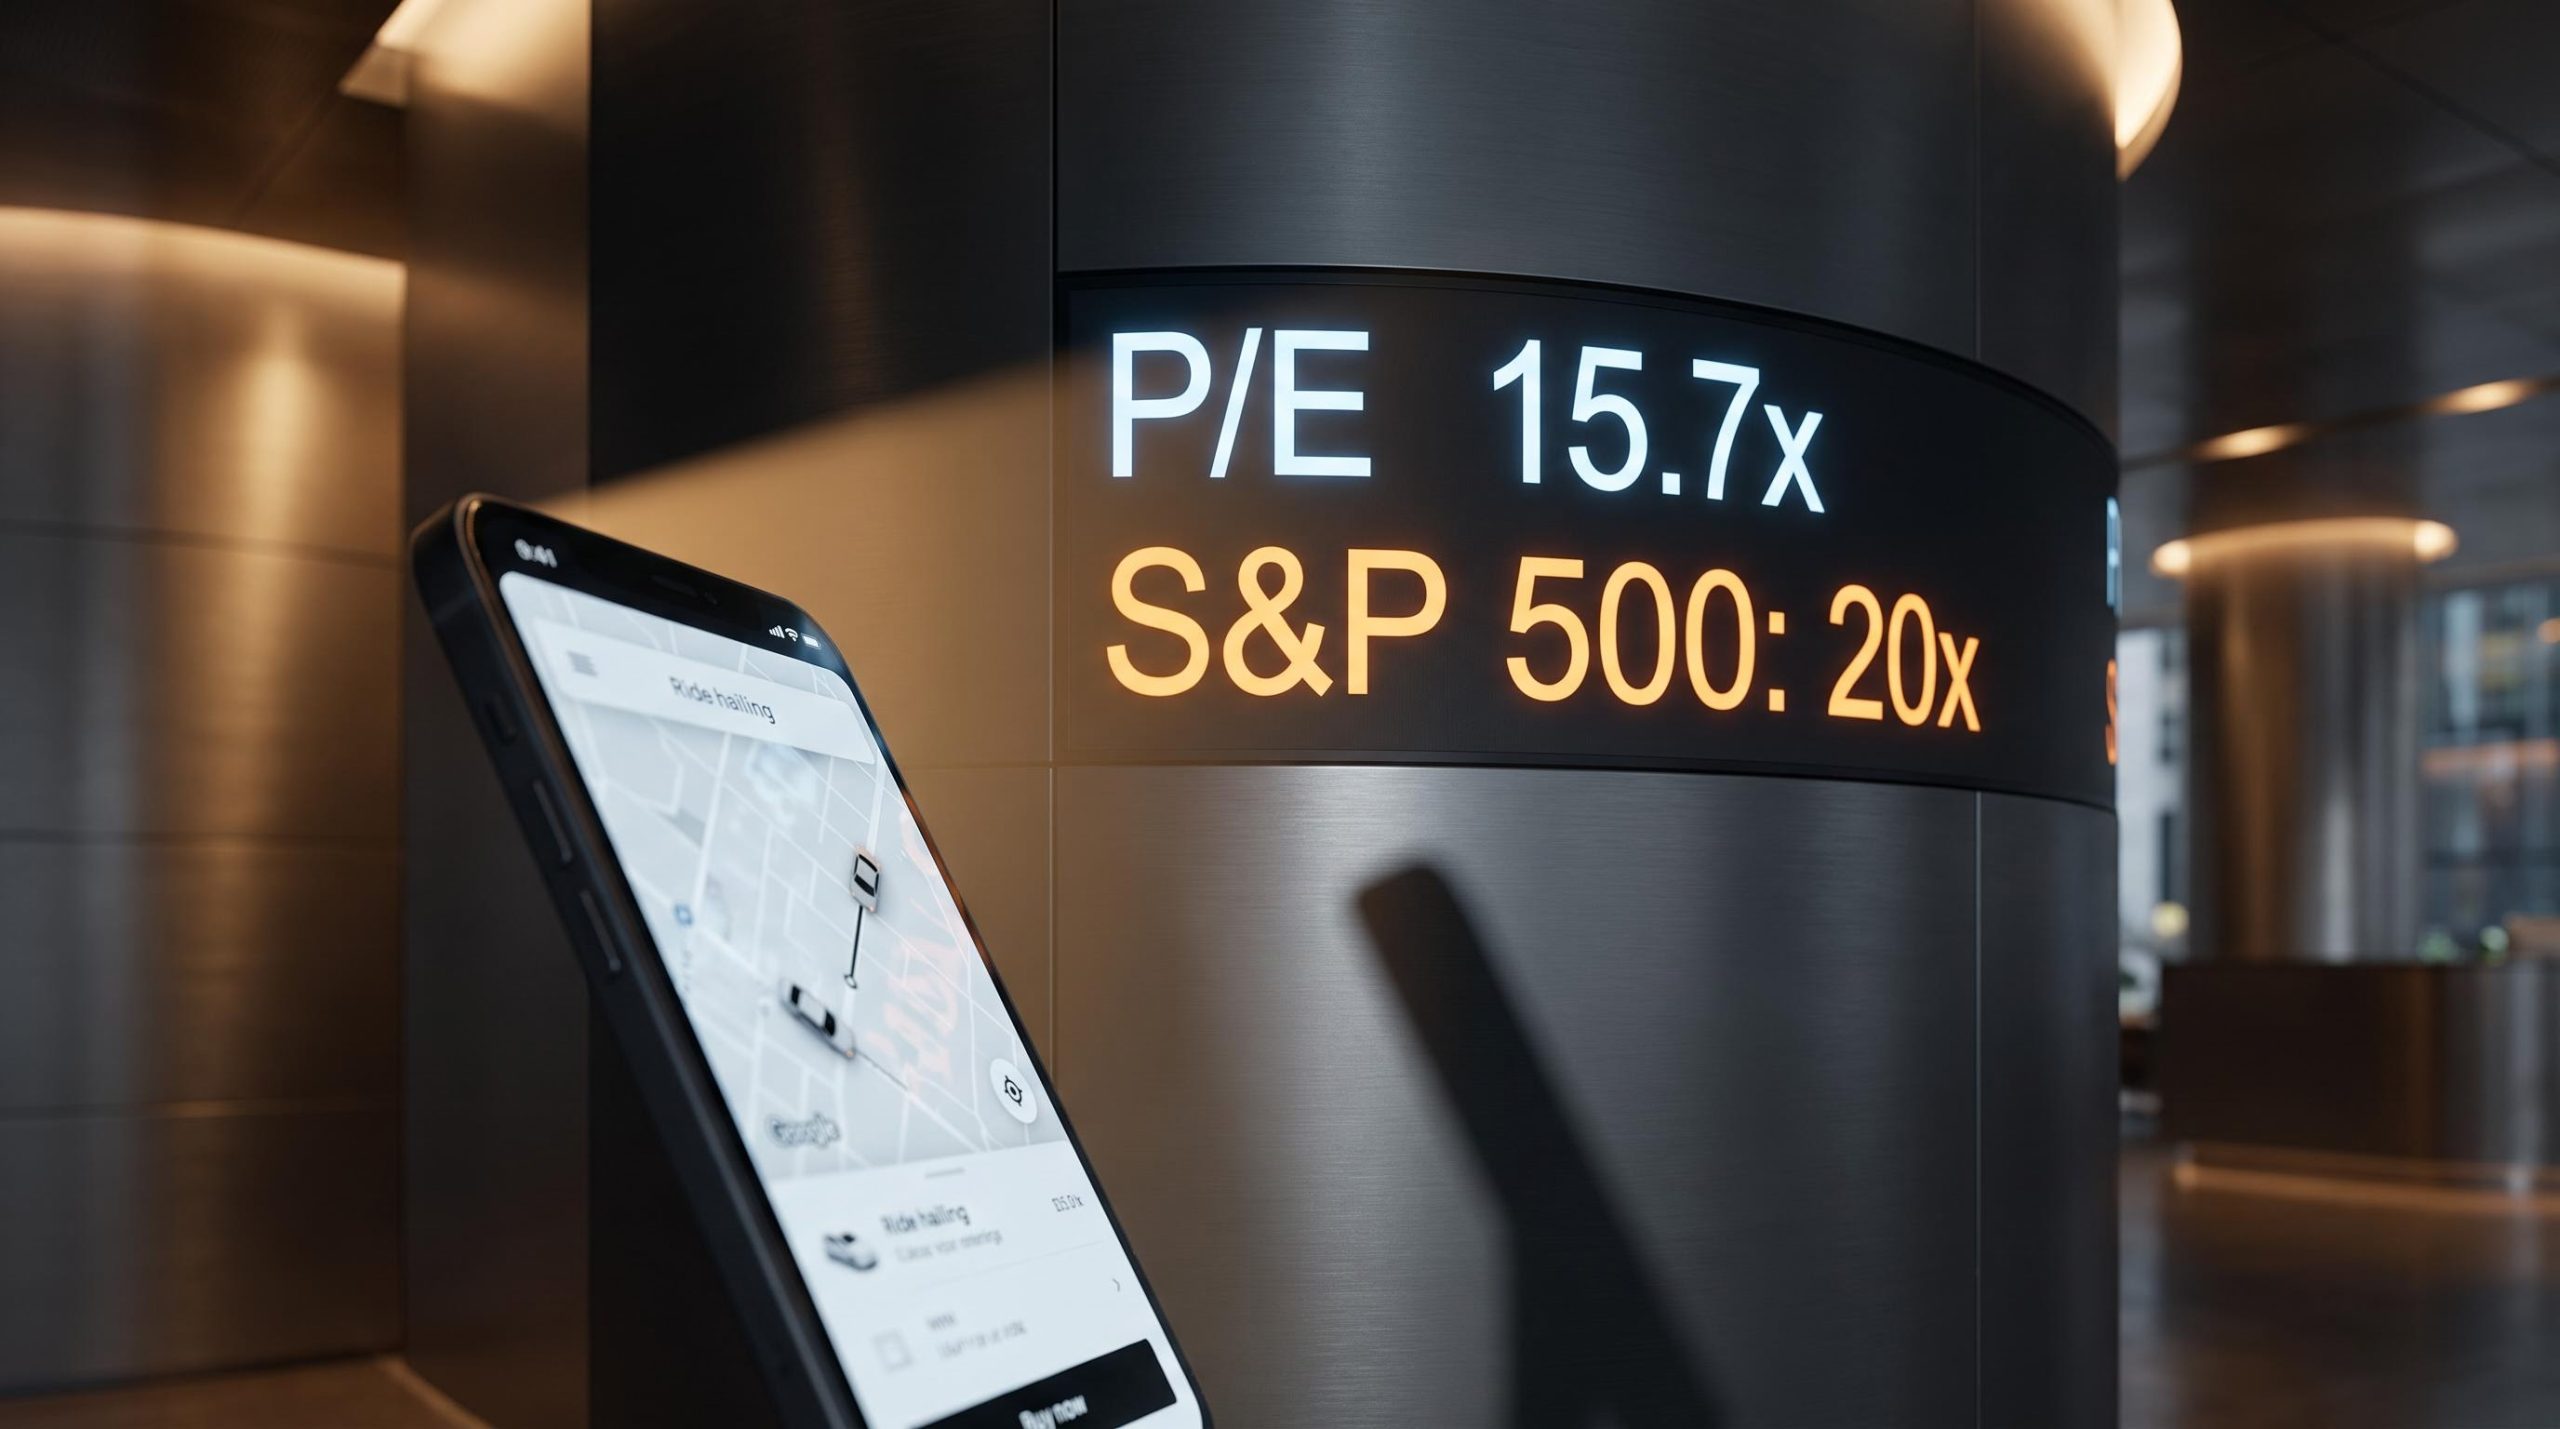
Uber trades at roughly 16 times trailing earnings. The S&P 500 trades at about 20. That would be unremarkable, except the company doing the trading runs a two-sided marketplace with more than 200 million monthly active users, an advertising arm at a $2 billion annualised run rate, and equity stakes across roughly 30 autonomous vehicle operators.
That is the dissonance worth sitting with. A commodity multiple is being applied to a business that increasingly resembles a distribution platform with leverage across several industries, and as of September 2026 the stock sits roughly 25% below its 52-week high. The gap between what Uber is priced as and what it is becoming has rarely been wider.
The persistent question this raises is whether that discount is an inefficiency or a warning. What follows here maps the three structural advantages the market is not fully pricing, the risks that could invalidate the case, and the single variable that will decide whether this valuation gap closes or deepens. Treat it as a decision framework, not a verdict.
What the market keeps getting wrong about Uber’s valuation
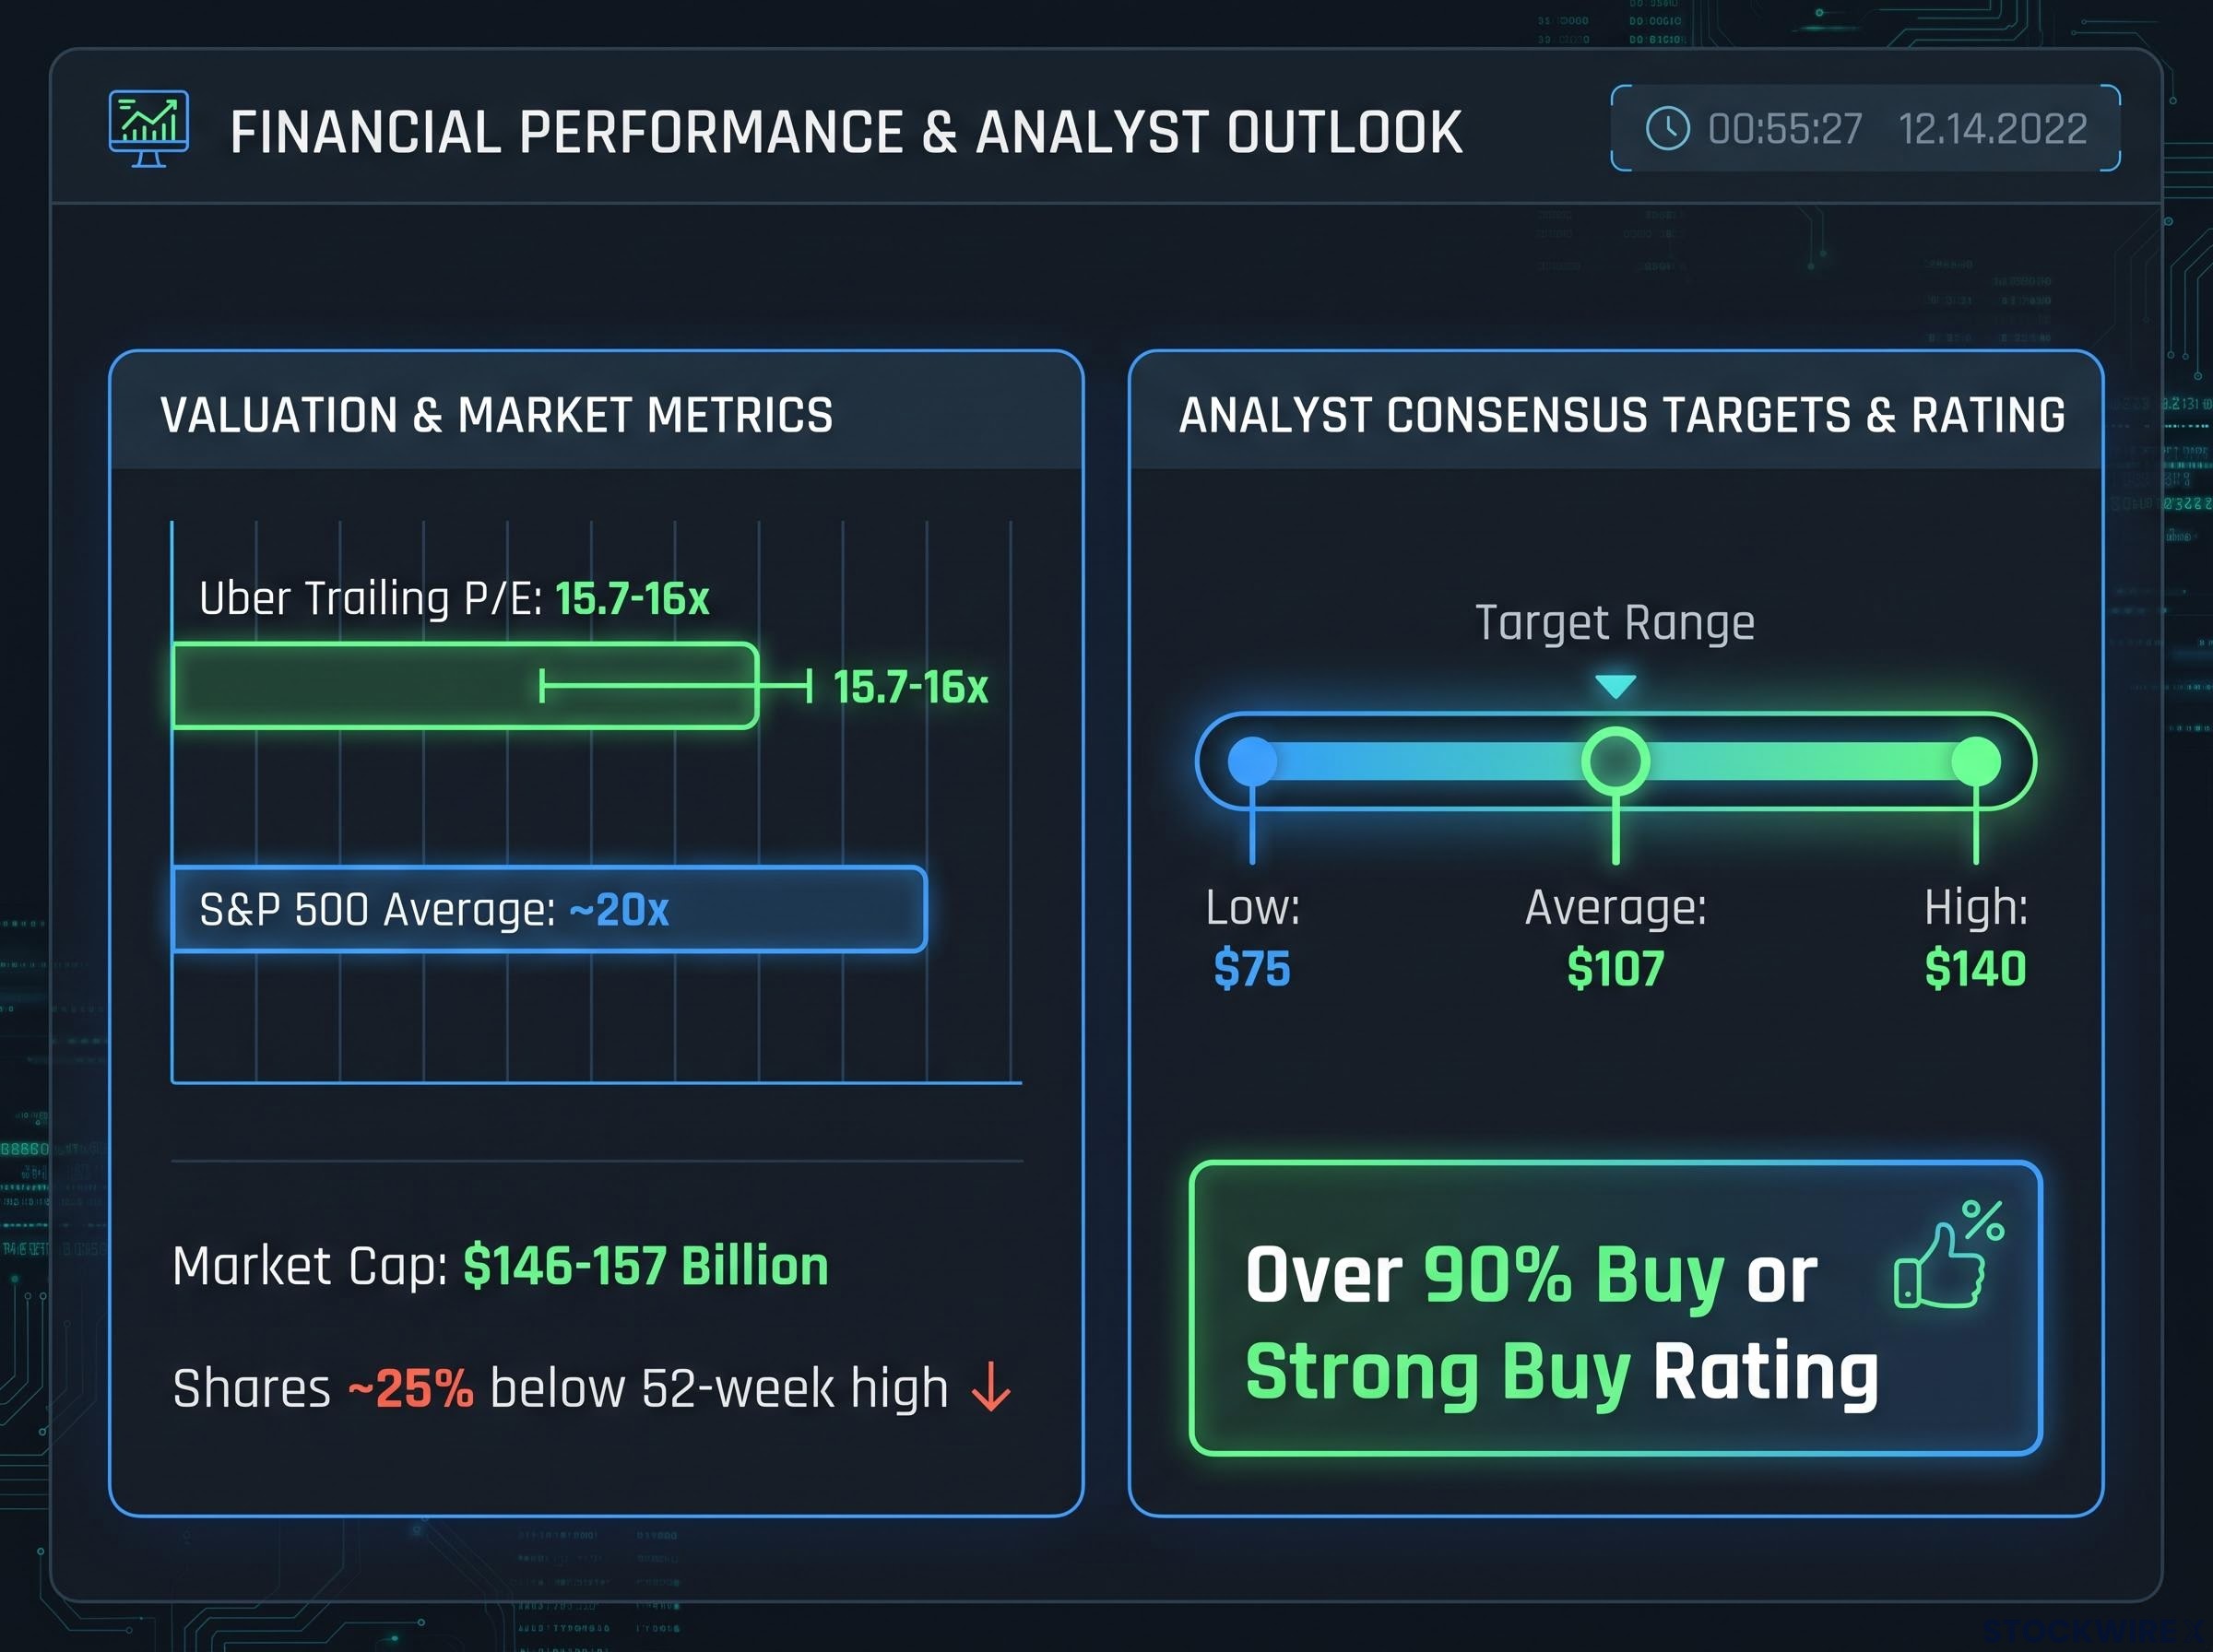
Start with the number that generates the tension. According to CNBC data from 11 September 2026, Uber’s trailing price-to-earnings ratio (P/E, the number of years of current profit an investor pays for a share) sat at roughly 15.7 times, with trackers across early September ranging between 15.7x and 17x. The S&P 500 baseline is approximately 20x.
A ride-hailing operator trading below the market average would be entirely reasonable. The problem is that Uber stopped being only a ride-hailing operator some time ago.
Here is why share price alone misleads. Market capitalisation relative to earnings is the operative measure of what a company is worth, not the sticker price of a single share. Meta and Uber illustrate the point: two companies can carry wildly different share prices while their total market values tell a completely different story about scale and profitability. The headline number on a brokerage screen is close to meaningless without the earnings behind it.
The three data points that frame the undervaluation case:
- Trailing P/E of roughly 15.7-16x against an S&P 500 average near 20x
- Market capitalisation of approximately $146-157 billion, depending on the September 2026 reference date
- Shares trading about 25% below the 52-week high
Analyst positioning sharpens the picture. A 61-analyst consensus points to meaningful upside from the low-$70s trading range.
Analyst consensus price target Low: approximately $75. High: $140. Average: approximately $107, implying roughly 45-50% upside from September 2026 levels. Over 90% of covering analysts rate the stock Buy or Strong Buy, and institutional ownership exceeds 80%.
The read you should take is this. A P/E of 16 on a company with this user base and this revenue diversification is not a comment on Uber’s quality; it is a comment on the market’s mental model. Wall Street is still pricing the company it knew in 2019. The distance between that outdated framing and the business Uber actually operates today is precisely where the opportunity lives, and it is a discount you pay for accepting the analytical shortcut rather than doing the work.
When big ASX news breaks, our subscribers know first
The advertising business Wall Street has not priced in
The clearest evidence that the market is mis-categorising Uber sits in its advertising line. It crossed a $2 billion annualised run rate in FY2025, up from a $1.5 billion run rate in Q1 2025, growing more than 50% year-over-year. This is not a rounding error inside a delivery business. It is a structurally different kind of revenue.
What makes it different is the margin. Retail media businesses of this type, advertising placed inside a platform people already use to shop, run at 70-80% gross margins because the audience and the payment infrastructure already exist. Uber holds first-party user data and stored payment credentials, which is exactly the targeting asset advertisers pay premiums for.
That asset has attracted serious distribution partners. Uber has extended connected ad formats across Meta, Google Shopping, Google’s Display & Video 360 (DV360), and The Trade Desk, turning its customer base into inventory that advertisers can reach through the channels they already buy on.
The Delivery Hero acquisition, adding 50 markets and approximately $42 billion in gross bookings, illustrates the platform expansion economics that make Uber’s advertising business more valuable over time: a larger delivery footprint means more first-party transaction data, which widens the targeting advantage advertisers pay premiums to access.
The value chain works in three connected steps:
- First-party data capture: Uber knows what its 200-plus million users order, where they travel, and how they pay.
- Third-party platform distribution: That data extends across Meta, Google, DV360, and The Trade Desk, widening the advertiser pool without Uber building the demand side from scratch.
- EBITDA margin accrual: Because incremental ad revenue carries 70-80% gross margins, most of it drops toward the bottom line rather than being consumed by cost growth.
The math is where this stops being a footnote. Analysts estimate that a $2-3 billion ad run rate could add $1.5-2.5 billion in incremental EBITDA (earnings before interest, tax, depreciation and amortisation, a proxy for operating profitability) without proportionate cost growth.
| Metric | Current Figure | Growth Rate | Margin Implication |
|---|---|---|---|
| Advertising run rate | $2B annualised (FY2025) | 50%+ YoY | High-margin, asset-light revenue |
| Active advertising merchants | 550,000+ | Expanding | Broad, diversified demand base |
| Delivery ad penetration | Above 2% of gross bookings | Early stage | Significant headroom before saturation |
| Estimated EBITDA uplift | $1.5-2.5B | Tied to ad scaling | 70-80% gross margins |
Put those pieces together and the conclusion writes itself. A business running at 70-80% gross margins, growing 50% a year, sitting inside a company priced at 16 times earnings, is not ancillary to the thesis. It is the thesis, and its near-total absence from the market’s valuation framing explains more of the discount than any other single factor.
How the delivery media peers validate Uber’s ceiling
The obvious objection is that this is a speculative new business line. The peer data says otherwise. DoorDash, Uber Eats, and Instacart together generate more than $4 billion in annualised advertising revenue, which establishes that monetising a delivery distribution network through advertising is a proven pattern, not a bet.
That comparison also tells you where Uber sits on the curve. With delivery ad penetration still above just 2% of gross bookings, Uber has considerable room before it approaches the saturation levels its peers are moving toward. The ceiling here is not theoretical; it is being demonstrated by companies already further up the same path.
Uber’s autonomous vehicle position: infrastructure layer, not just partner
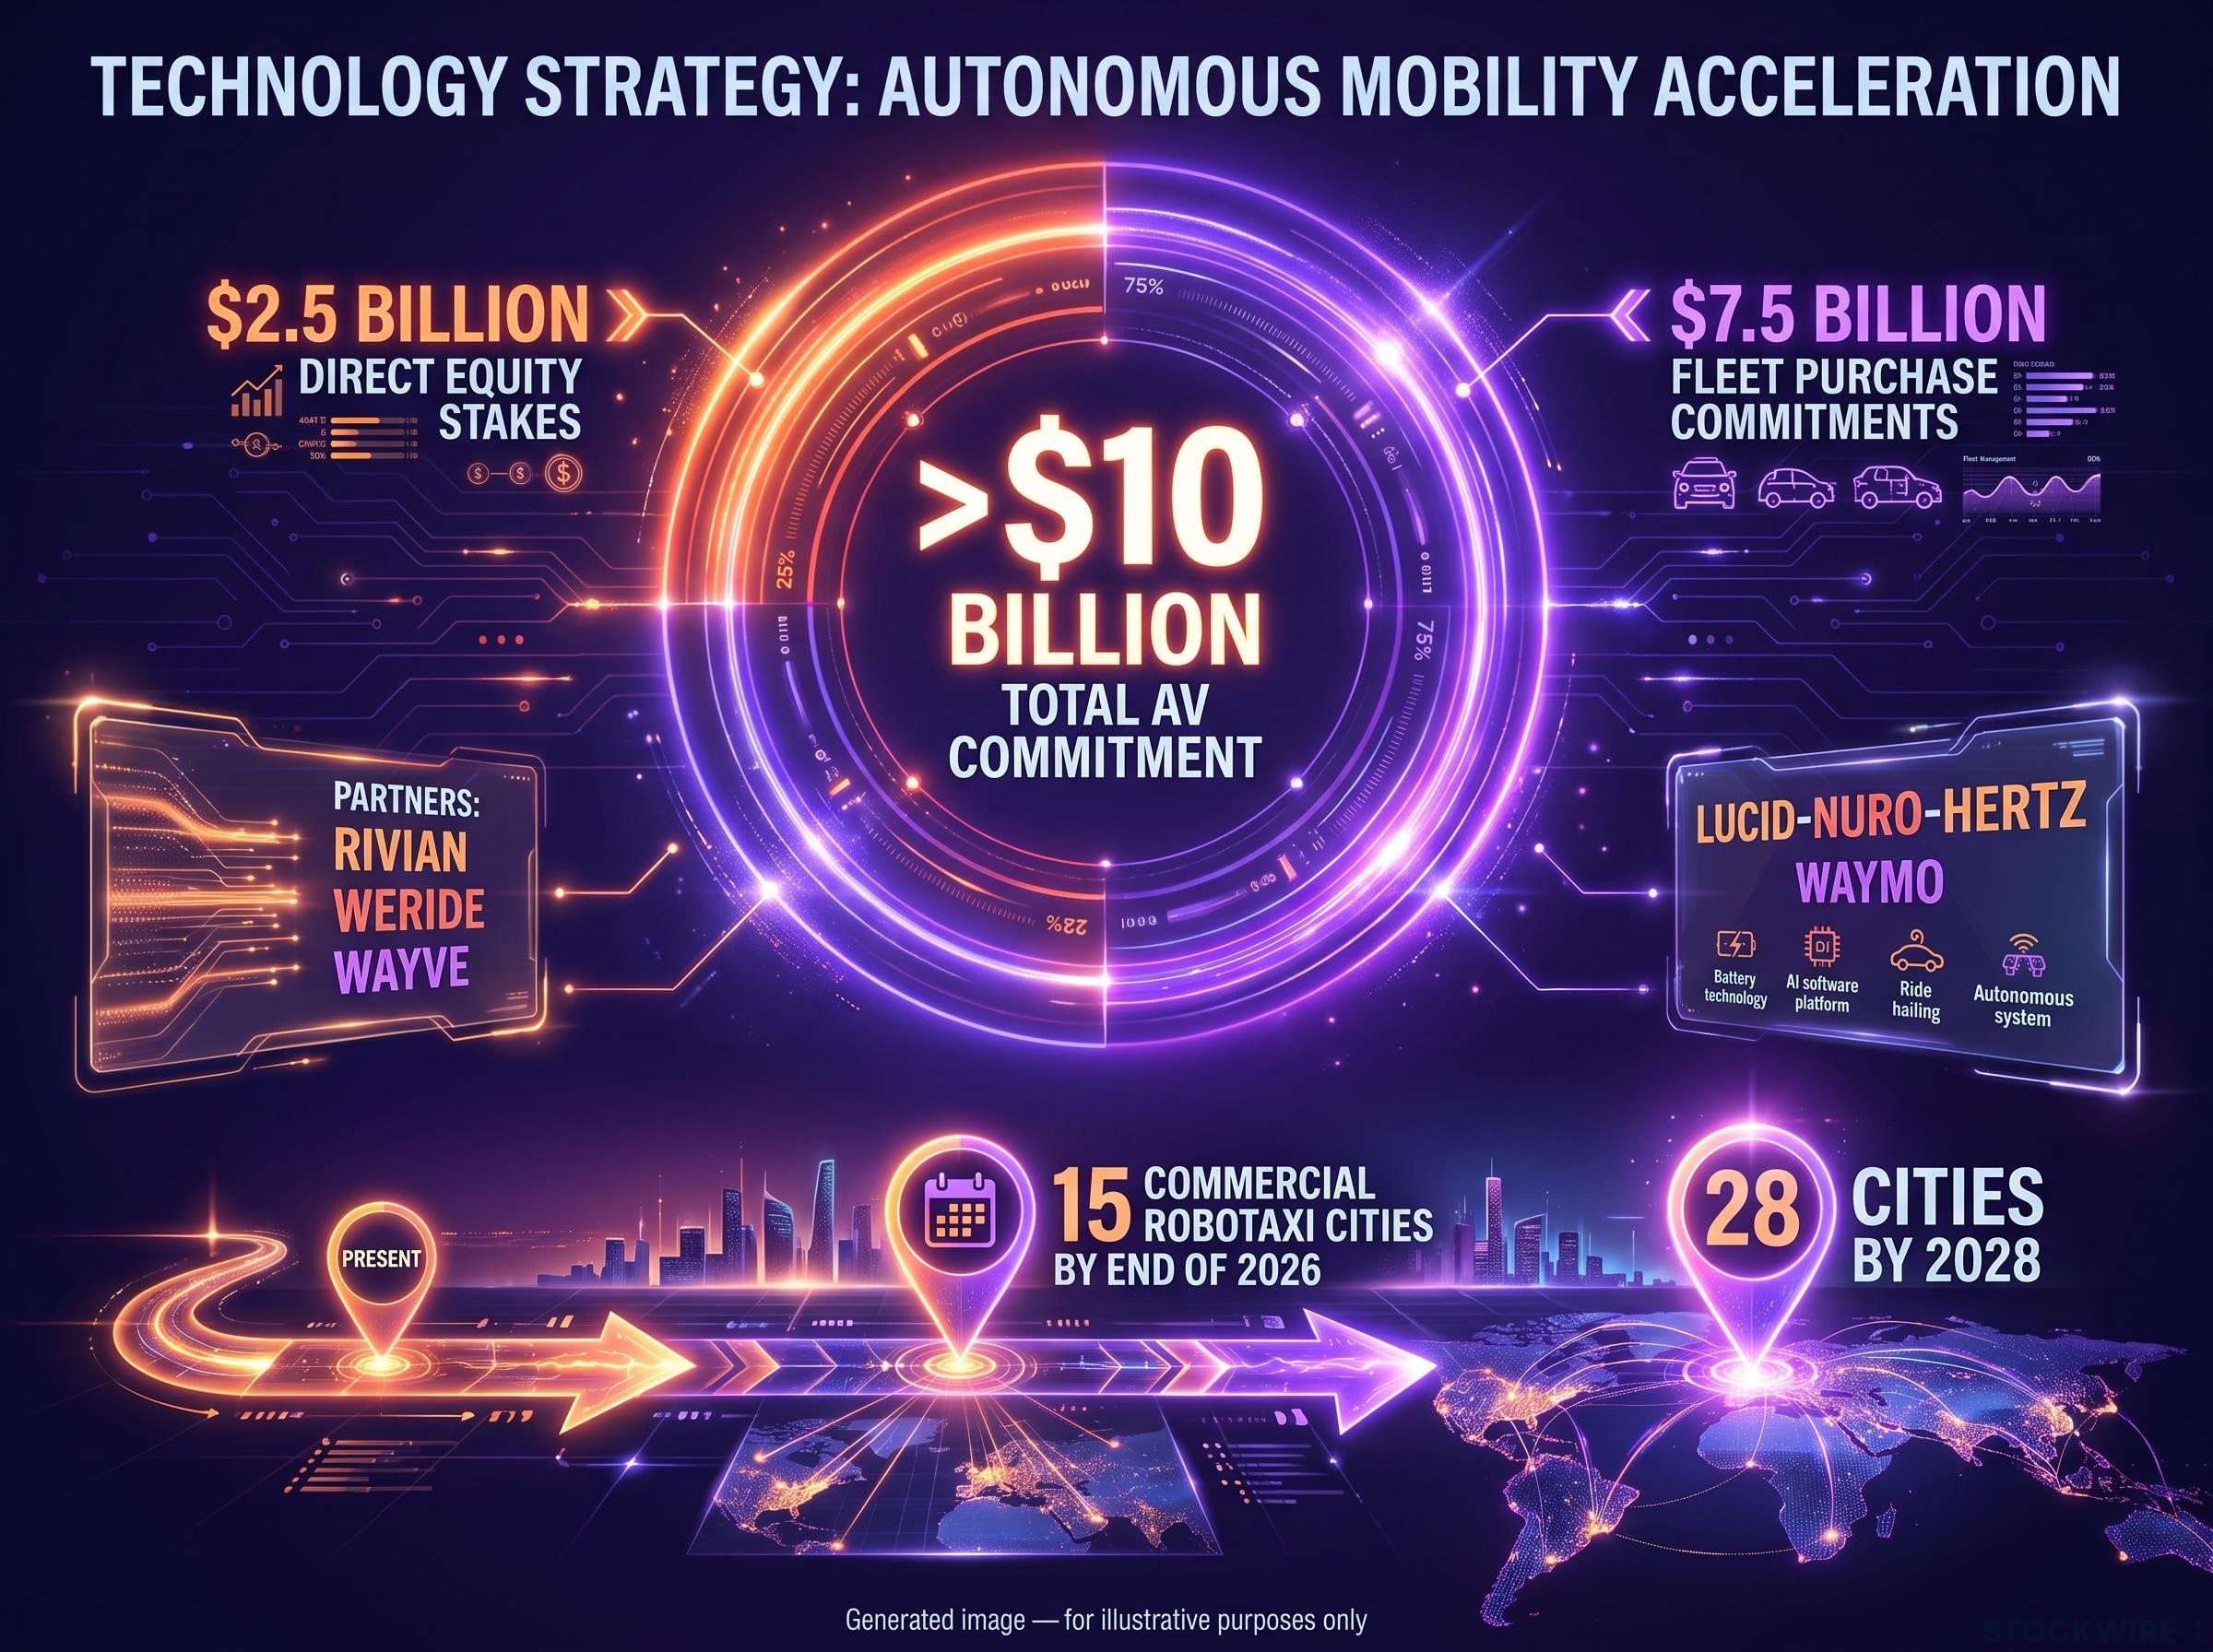
Uber has committed more than $10 billion to autonomous vehicles, and the structure of that commitment reveals the strategy. Roughly $2.5 billion goes to direct equity stakes in AV developers, and $7.5 billion is tied to fleet purchase commitments contingent on deployment milestones. This is a company choosing to own the distribution layer rather than the vehicle technology.
The logic behind that choice is the aggregator thesis. Building an autonomous vehicle is a hard engineering problem; building a consumer-facing mobility brand from scratch is arguably harder. Uber already has the second thing.
The aggregator thesis in fragmented AV markets draws a direct parallel to how LLM orchestration platforms gained value when AI supply fragmented across OpenAI, Anthropic, and Google: distribution layers become more valuable, not less, as the number of underlying technology providers grows, which is precisely the dynamic Uber’s 30-operator partner network is designed to exploit.
The bull case rests on that distribution moat:
- More than 200 million monthly active users with stored payment credentials represent a consumer acquisition cost that AV operators building direct brands cannot easily replicate.
- Uber can handle fleet operations such as cleaning and charging while collecting a platform fee.
- AV fleets plugged into Uber gain immediate, high utilisation, which makes scaling capital-efficient for both sides.
The partner footprint spans roughly 30 operators across multiple continents.
| AV Partner | Commitment Type | Scale and Timeline |
|---|---|---|
| Rivian | Up to $1.25B investment | Up to 50,000 R2 robotaxis; first 10,000 in San Francisco and Miami from 2028 |
| WeRide | Fleet deployment | 1,200+ robotaxis across Abu Dhabi, Dubai, Riyadh by 2027; driverless Dubai fares from 31 March 2026 |
| Wayve | Technology partnership | UK’s first supervised autonomous ride, launched in London |
| Lucid-Nuro-Hertz | Integrated fleet arrangement | Premium Lucid EVs with Nuro autonomy; Hertz affiliate Oro Mobility runs the fleet |
| Waymo | Utilisation partnership | Off-peak utilisation now; direct-to-consumer app planned for Austin and Atlanta, January 2028 |
The geographic ambition is concrete. Uber is targeting commercial robotaxi launches in at least 15 cities by the end of 2026, expanding to at least 28 cities by 2028. The user base is scaling underneath it, growing from 180 million monthly active platform consumers at 30 June 2025 to roughly 202-208 million a year later, a rise of about 16%.
The interpretive point is the one that matters most. Uber does not need to win the AV technology race to profit from it; it needs to remain the default consumer interface for autonomous mobility. That is a narrower and more achievable bet, but its durability is exactly what the bear case attacks.
The Waymo and Tesla threat to Uber’s middleman position
Two names complicate the aggregator story. Waymo currently uses Uber to improve fleet utilisation during off-peak hours, which creates short-term alignment. The medium-term risk is that Waymo has signalled it may phase out that exclusivity and launch its own direct-to-consumer app in Austin and Atlanta from January 2028.
Tesla is a cleaner rival. CEO Elon Musk has declined to integrate Tesla’s robotaxis into Uber’s network, pursuing a direct-to-consumer Cybercab model on Tesla’s own app, with reported fares at roughly half of Uber’s comparable pricing in early markets.
This is the single most contested element of the entire bull thesis. The Waymo defection timeline effectively puts a clock on it: Uber has until early 2028 to prove its distribution layer is genuinely difficult to bypass, and that is the date you should watch above all others.
The risk map every Uber investor needs before committing
The risks here are not disclaimers. Each one describes a specific condition under which the thesis breaks, and knowing them is how you decide what you are actually betting on.
- Regulatory and permitting friction. Uber’s most immediate constraint is a permit problem, not a technology problem. California is the clearest example: paid AV services face uncertain state timelines and backlash over Uber-backed ballot measures on robotaxi liability, meaning Uber cannot control the pace of its own revenue ramp in a high-value market.
- Competitive pricing pressure. Tesla’s direct model is undercutting Uber and Lyft at roughly half-price fares in early markets, and Musk’s refusal to integrate keeps Tesla a structural rival on both price and platform.
- Advertising execution. The margin story depends on continued hyper-growth in ads. If ad density degrades the user experience or measurement effectiveness declines, the projected EBITDA uplift stalls.
California’s AV permitting framework, administered by the CPUC, governs which operators can charge fares for autonomous rides and under what conditions, making it the single regulatory choke point most likely to determine the pace of Uber’s high-value market revenue ramp.
There is also a revealing contradiction in Uber’s own conduct. The company is deploying AV partnerships aggressively while simultaneously lobbying in New Jersey and Washington D.C. for rules requiring human drivers to handle at least 85% of rides during pilot periods. That tension tells you Uber is acutely aware of driver-displacement risk as both a reputational and operational exposure.
The institutional counterweight to the buy-side enthusiasm comes from Morningstar.
Morningstar’s narrow moat designation Against a consensus where over 90% of analysts rate Uber a Buy, Morningstar assigns only a “narrow moat,” reflecting the view that if advertising growth falters, Uber risks becoming a margin-constrained frontend for AV operators it does not control.
One further data point deserves a caveat: Simply Wall St has assessed the stock at more than 50% below its estimated fair value, though this figure is flagged as unverified in the underlying research and should be treated as one input among many rather than a confirmed valuation.
What holds all of this together is the balance sheet. Uber is projected to generate more than $7 billion in free cash flow in 2026, which buys the company time to absorb setbacks in any single area. The read for you is that these risks are not a reason to avoid the stock; they are a checklist of the specific news events that tell you whether the thesis is intact or eroding.
What the thesis actually requires to close the valuation gap
Strip the case down and it rests on three pillars. First, platform mispricing: a P/E below the market average despite genuinely multi-segment revenue. Second, advertising margin expansion: a 70-80% gross-margin business growing 50% a year inside a 16-times-earnings stock. Third, AV distribution leverage: owning the consumer interface rather than the vehicle technology.
The gap between a 16 P/E and the consensus average target of roughly $107 closes when the market updates its category for Uber from ride-hailing operator to platform business. Nothing else will do it.
The variables that would confirm that re-rating is beginning, over the next 12-24 months:
- Advertising run rate progression toward $3 billion-plus, the most legible leading indicator of the margin thesis.
- Commercial robotaxi launches hitting the 15-city target by the end of 2026, on the way to 28 cities by 2028.
- Waymo’s direct-to-consumer timeline either stalling or accelerating ahead of its January 2028 plan.
The durability anchor A projected $7 billion-plus in free cash flow in 2026 means that even if AV revenue ramps slowly and advertising growth moderates, Uber has the balance-sheet runway to wait for the market to reprice its category.
Free cash flow quality matters here because Uber’s projected $7 billion-plus in 2026 FCF is doing the analytical work that the P/E ratio cannot: a company priced at 16 times earnings but generating that level of cash has a margin-of-safety buffer that accrual-based earnings multiples systematically understate.
You do not need to call the exact timing of a re-rating to benefit from one. Knowing what triggers it tells you what to monitor and, just as usefully, how to size a position against the uncertainty you are willing to hold.
This article is for informational purposes only and should not be considered financial advice. Investors should conduct their own research and consult with financial professionals before making investment decisions. Past performance does not guarantee future results, and financial projections are subject to market conditions and various risk factors. Forward-looking statements are speculative and subject to change based on market developments and company performance.