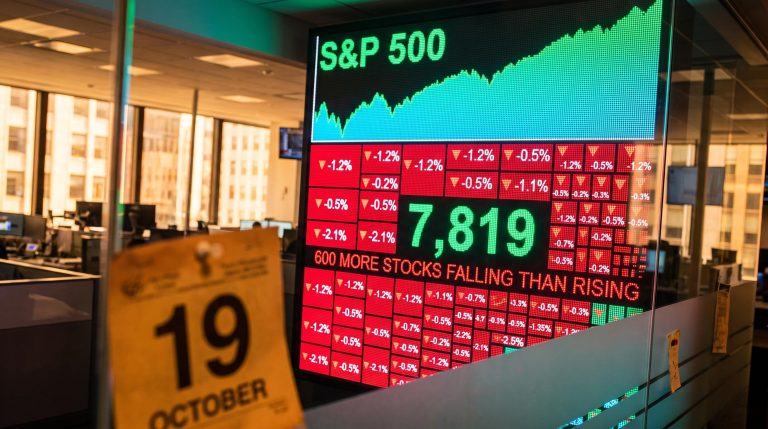
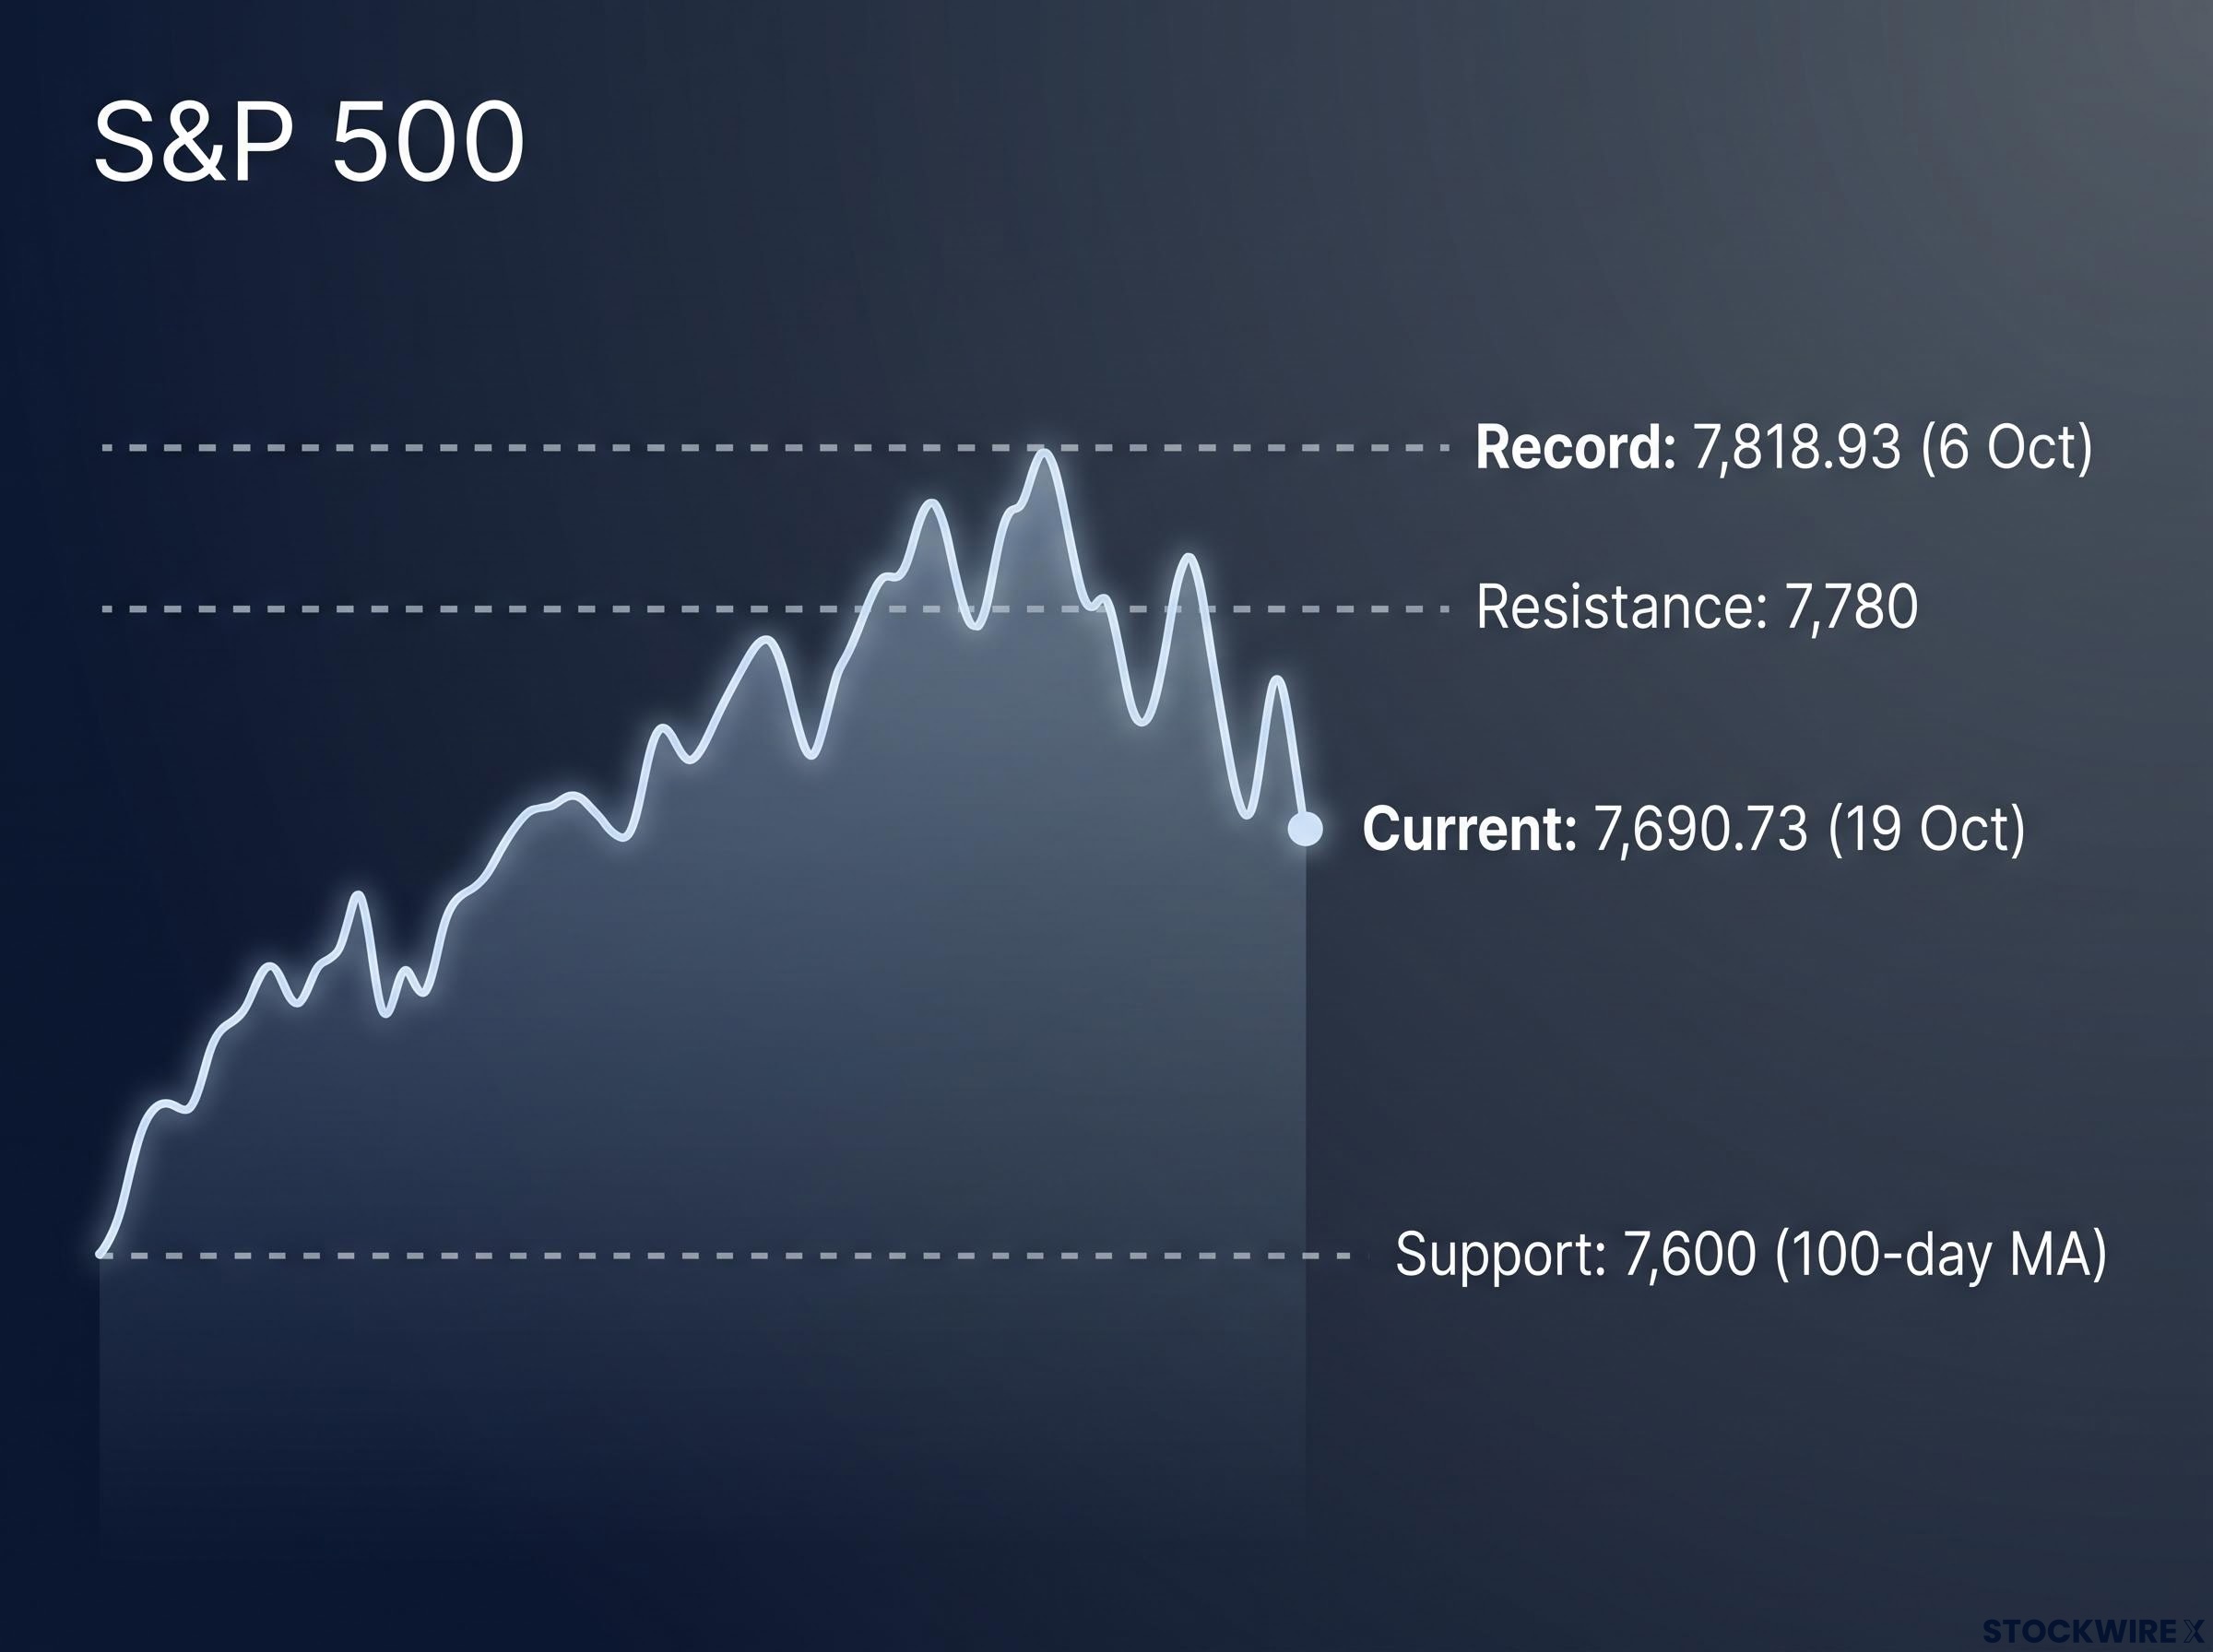
The S&P 500 finished Monday at 7,690.73, roughly 1.64% below its 6 October record of 7,818.93. On a quick glance, the stock market outlook looks steady. Yet on Friday 16 October, the VIX jumped 21.45% in a single session, and several major indexes broke the trend lines that had carried them higher.
A market that sits near a record can still be structurally weak. This week, that gap matters more than usual.
The Nasdaq Composite fell 4.48% in the week to 16 October. SpaceX reports tomorrow and Tesla follows on Wednesday. The bearish case examined here comes from one trader’s opinion-based technical read, with independent support from Charles Schwab‘s technicians. It is not advice.
Here is a clear map of what that bearish case claims, the chart concepts it relies on, how the bulls respond, and which levels and events would confirm or undermine it.
Where the stock market outlook looks weakest beneath record-high headlines
Start with the numbers most people check, because on the surface they look fine.
| Index | Level | Move | Note |
|---|---|---|---|
| S&P 500 | 7,690.73 (19 Oct) | Down 1.09% on 16 Oct to 7,659.44 | About 1.64% below the 7,818.93 record |
| Nasdaq Composite | 26,140.03 (16 Oct) | Down about 2.14% on the day | Down 4.48% on the week |
| Dow Jones | 51,966.03 (19 Oct) | Down 0.07% | Little changed |
| VIX | 18.44 (19 Oct) | Up 21.45% to 19.99 on 16 Oct | Above 22 intraday on 15 Oct |
The presenter’s thesis is that this rally is decaying. Since the sharp “Liberation Day” drop and the rebound that followed, each rally has been weaker and shorter than the one before it.
The latest bounce came after Treasury Secretary Scott Bessent said the Iran war would end within a day or two. The presenter reads that move as a possible final burst of optimism, a return to resistance that is likely to fail.
That view would be easy to dismiss if it stood alone. It does not.
Schwab’s technical read, 19 October Charles Schwab’s technicians said the S&P 500 and Nasdaq broke important support. They rate the Nasdaq neutral/bearish and the Russell 2000 bearish. They place S&P support near 7,600 (the 100-day moving average) and resistance near 7,780.
Once you line up those broken levels, the “near record” framing becomes the least useful fact on the screen.
Why a low VIX is not a low-risk signal
The VIX measures how much volatility options traders expect from the S&P 500 over roughly the next month. It does not measure the risk of a longer decline.
Saxo described October as a “low volatility bull” market, with the VIX near 15 before it lurched toward 20. A VIX near 18 tells you the options market expects little near-term turbulence. It does not give you an all-clear, and last week showed how quickly that reading can change.
A calm VIX can also be manufactured mechanically, since large pools of short-volatility exposure from systematic strategies and structured products suppress the headline reading without reducing the underlying economic risk.
When big ASX news breaks, our subscribers know first
Support, gaps and channel midlines: the technical ideas behind the bearish case
On a chart, the pattern looks simple. Price climbs, stalls at a line, falls through another line and then struggles to get back above it. Four concepts explain why traders give that picture weight:
- Support turned resistance: a price floor that, once broken, acts as a ceiling on later rebounds. Bullish (BLSH) gained about 100% before failing at resistance, and Newsmax slid from about 12 to about 8.
- Price gaps: a jump between one session’s trading range and the next, leaving no trades in between. The presenter argues that a break below the gap just under Friday’s lows would start meaningful selling.
- Channel midlines: the centre line between two parallel trend lines that contain price. The semiconductor index’s latest push stalled at its midline.
- Trend decay: a sequence of rallies that each reach less far and fade faster.
These are chart constructions, not laws of physics. They matter because many traders watch the same lines and act around them, which can make the levels self-reinforcing for a time.
A caution on gaps A gap may fill, but it can also mark a genuine change in trend. Not every gap must close.
What these tools cannot tell you
Indicators lag. They describe what price has already done, and they cannot separate a normal correction from a bear market.
False breakdowns are also common. The 2025 tariff selloff and its sharp rebound showed that even a severe break can reverse quickly.
Knowing these terms lets you test a chart-based claim yourself. A broken level raises the odds of further weakness, but it does not guarantee it.
Conflicting technical signals are common near key support, where a bullish momentum reading can sit beside a trend-break warning, so price behaviour around the structural floor is usually the most informative data point.
Chips, bonds, utilities and gold: leadership is thinning and rates are the pressure point
If the index charts show the damage, the individual assets help explain it. Treat each one as a separate clue.
Semiconductors: a stalled leader
According to the presenter, the semiconductor index peaked in late June after a surge driven by AI demand and South Korean chipmakers. It has bounced since, but it remains below key trend lines, and its latest push stalled at the channel midline.
Chips led the Nasdaq lower in the week to 16 October amid concerns about competition from China. Schwab separately flagged that technology is weakening relative to the broader market.
Bonds, utilities and gold: the rate squeeze
The 10-year Treasury yield sat around 5.09-5.10% on 15-16 October, after recently reaching about 5.33%. The 30-year yield touched about 5.62% on 29 September, its highest reported level since 2002.
The Treasury announced a buyback of up to $6 billion in debt maturing in 10-20 years. That operation aims to help markets function smoothly. It is not Federal Reserve quantitative easing, and bonds kept falling anyway: TLT slipped about two-thirds of a percent, its third straight down day.
Utilities took a harder hit. XLU fell about 2%, and Societe Generale’s Manish Kabra said utilities have dropped to all-time relative lows against the S&P 500. The presenter discloses a large XLU put position, so his view on utilities comes with skin in the game.
Gold has held up better. The LBMA PM price was $4,189 on 16 October, and spot traded around $4,156-$4,165. The World Gold Council notes that renewed bond demand can compete with gold for safe-haven money.
| Asset | Latest reading | Presenter’s read | Key level or caveat |
|---|---|---|---|
| Semiconductors | Below late-June peak | Stalled at channel midline | Below key trend lines |
| 10-year yield | 5.09-5.10% | Bond bear market intact | Buyback is not QE |
| Utilities (XLU) | Down about 2% | Bearish, holds puts | All-time relative lows (Kabra) |
| Gold | $4,189 LBMA PM | Softening | $4,000; $3,500 if broken |
Put the clues together and a single thread appears: higher yields. Rising rates reduce the present value of growth stocks whose profits lie far in the future, and they make utility dividends look less attractive next to bonds.
With bonds, utilities and credit all declining together, rate-sensitive assets offer little hiding place, because defensive status does not shield dividend payers from valuation compression as the risk-free rate rises.
Index concentration lets a handful of mega-caps hold the S&P 500 near a record while chips, utilities and small caps weaken. If you own a broad index fund, your exposure may rest on fewer companies than the headline level suggests.
Speculative stocks and credit stress: reversals at the edge of risk appetite
Traders watch the riskiest corners of the market because they tend to crack first. The presenter’s examples follow the same pattern of support turning into resistance:
- Bullish (BLSH): roughly doubled, then slumped after failing at resistance.
- Newsmax: fell from about 12 to about 8.
- “Cabris” IPO: peaked on listing day and dropped from near 400 to 122. The presenter suggests it could reach single digits, which is his opinion.
Taken one at a time, these look like anecdotes. Together, they show a pattern.
Analyst targets on “Cabris” sit around 380, still uniformly bullish while the price collapses. When targets sit that far above a falling price, you should treat them as a lagging signal rather than protection.
The warning extends into credit markets.
AI credit stress CoreWeave bond yields near 15% point to refinancing and profitability risk for leveraged AI infrastructure firms.
The presenter is openly bearish and positioned accordingly. He is short Caterpillar (already down 30%), IonQ, Lemonade and Carvana, along with China and South Korea through FXI and EWY. These positions illustrate one view, but Schwab’s finding that high-beta stocks are weakening relative to low-volatility stocks gives that view outside support.
A heavy earnings week and the bull case: what could prove the bearish view wrong
The next few days could speed up the bearish case or blunt it.
- Tuesday 20 October: SpaceX Q3 results after the close, with a webcast around 4:30 p.m. ET. This is its second report since the June IPO.
- Wednesday 21 October: Tesla Q3 after the close. Bloomberg consensus via Pepperstone sits at about $12.89B revenue, $6.62B adjusted EBITDA (earnings before interest, tax, depreciation and amortisation) and adjusted EPS near $0.15. Reuters cites about $12.74B and $0.14.
- Date unconfirmed: the Anthropic IPO. No firm filing date, valuation or timetable has been found. The presenter’s comparison to WeWork is his opinion only.
The case for the bulls
Goldman Sachs‘ Christian Mueller-Glissmann upgraded global equities to overweight for three months. Goldman also upgraded bonds to overweight over 12 months. GSAM puts the S&P 500’s forward P/E (price divided by expected earnings) at about 21x, down from 25x a year earlier, and expects roughly 36% earnings growth in 2026.
Morgan Stanley’s Dan Simkowitz argues that multiples have not risen this year because profits keep improving. That is the core distinction from 2000, when the market’s leaders lacked today’s earnings. 2021, however, showed that even profitable growth stocks can fall when rates climb.
| Bearish evidence | Bullish evidence |
|---|---|
| S&P 500 and Nasdaq broke support (Schwab) | Forward P/E fell to about 21x from 25x |
| Semiconductors stalled below trend lines | About 36% EPS growth expected in 2026 |
| 10-year yield above 5% | Goldman overweight on equities and bonds |
| CoreWeave bonds yielding near 15% | Leaders have real profits (Morgan Stanley) |
| Speculative names reversing | 2025 tariff break reversed quickly |
The risks of acting on a bearish read
Short selling carries potentially unlimited losses. Leverage through futures, margin or options can force you out during a countertrend rally, and short squeezes are possible around Tesla, SpaceX or AI earnings.
Even the presenter declined to raise his exposure on the bounce. Any call, this one included, can be right on direction and still lose money on timing or leverage, so you should size positions for the possibility of being wrong.
Past performance does not guarantee future results. Forecasts and forward-looking statements here are speculative and subject to change with market conditions.
Weighing the signals before the next move
Prices near records, broken support, thinning leadership and rate pressure sit alongside strong earnings forecasts. The evidence supports caution, but not certainty.
Other technicians have framed similar setups as a contest between a bearish diamond top pattern and a bullish continuation, with neither confirmed until price breaks the range and breadth data weighs in.
Three variables will do most of the work in deciding which side is right:
- S&P 500 at 7,600: a sustained break would strengthen the bearish case, while a move back above 7,780 would weaken it.
- The 10-year yield: further gains would add pressure on growth stocks and utilities.
- Gold at $4,000, plus reactions to Tesla and SpaceX: these will show whether risk appetite holds.
Treat this as one opinion-based read and test it against your own time horizon and tolerance for risk.
This article is for informational purposes only and should not be considered financial advice. Investors should conduct their own research and consult with financial professionals before making investment decisions.