Traders are now pricing in more than a 40% chance the Federal Reserve hikes interest rates before year-end. That probability more than tripled in a single week, even as the central bank has spent the better part of two years trying to engineer a soft landing.
Three forces converged in May 2026 to revive inflation fears that many investors had assumed were fading. Brent crude climbed to $109 a barrel. The 10-year Treasury yield hit a 16-month peak of 4.687%. And CME FedWatch data showed the probability of a 50-basis-point December hike jumping from 4.2% to 13.7% in seven days. Each development is significant on its own. Together, they are reshaping how Wall Street thinks about the stock market outlook for the second half of 2026.
What follows breaks down each force in plain terms, explains how they amplify one another, and translates the macro picture into concrete portfolio implications for U.S. investors.
Why oil at $109 is an inflation problem, not just an energy story
Brent crude sat at $109.14 per barrel on 20 May 2026, down roughly 2% on the day after former President Trump’s public statements about Iran. That single-session pullback grabbed headlines. It did not change the structural supply picture.
Brent has been trading in the $108-$111 range for weeks, according to CNBC and Trading Economics data, a band sustained by forces that a diplomatic comment cannot unwind overnight.
Three supply-disruption mechanisms are holding prices at these levels:
- Red Sea rerouting. Attacks on commercial shipping in the Red Sea and Gulf of Aden have forced tankers around the Cape of Good Hope, adding time and cost to crude flows from the Middle East to Europe and the U.S. East Coast.
- Infrastructure threats. Missile and drone activity in the Gulf has periodically threatened Saudi and Iraqi export terminals, including facilities near Ras Tanura and Basra. War-risk insurance premiums and freight rates remain elevated for tankers crossing high-risk zones.
- OPEC+ supply discipline. Producers have maintained voluntary supply cuts and signalled no urgency to offset conflict-related disruptions, arguing that geopolitical risks and fragile demand justify cautious production policy.
These are not temporary disruptions waiting to resolve. They feed directly into headline CPI through the energy component and indirectly through freight costs, goods prices, and services. Oil above $100 is a monetary policy variable as much as an energy one, and that distinction matters for everything that follows.
The IEA has characterised the Middle East geopolitical tension as a persistent structural inflation risk from oil rather than a transient spike, meaning the risk premium embedded in current prices is expected to decompress slowly over months rather than unwind on any single diplomatic development.
When big ASX news breaks, our subscribers know first
Where inflation stands right now, and why the Fed cannot declare victory
The Bureau of Labor Statistics released April 2026 CPI data on 12 May 2026. The Bureau of Economic Analysis published March 2026 core PCE on 30 April 2026. Together, these two releases form the inflation picture the Fed is actually reacting to.
| Measure | Period | Reading | Fed Target |
|---|---|---|---|
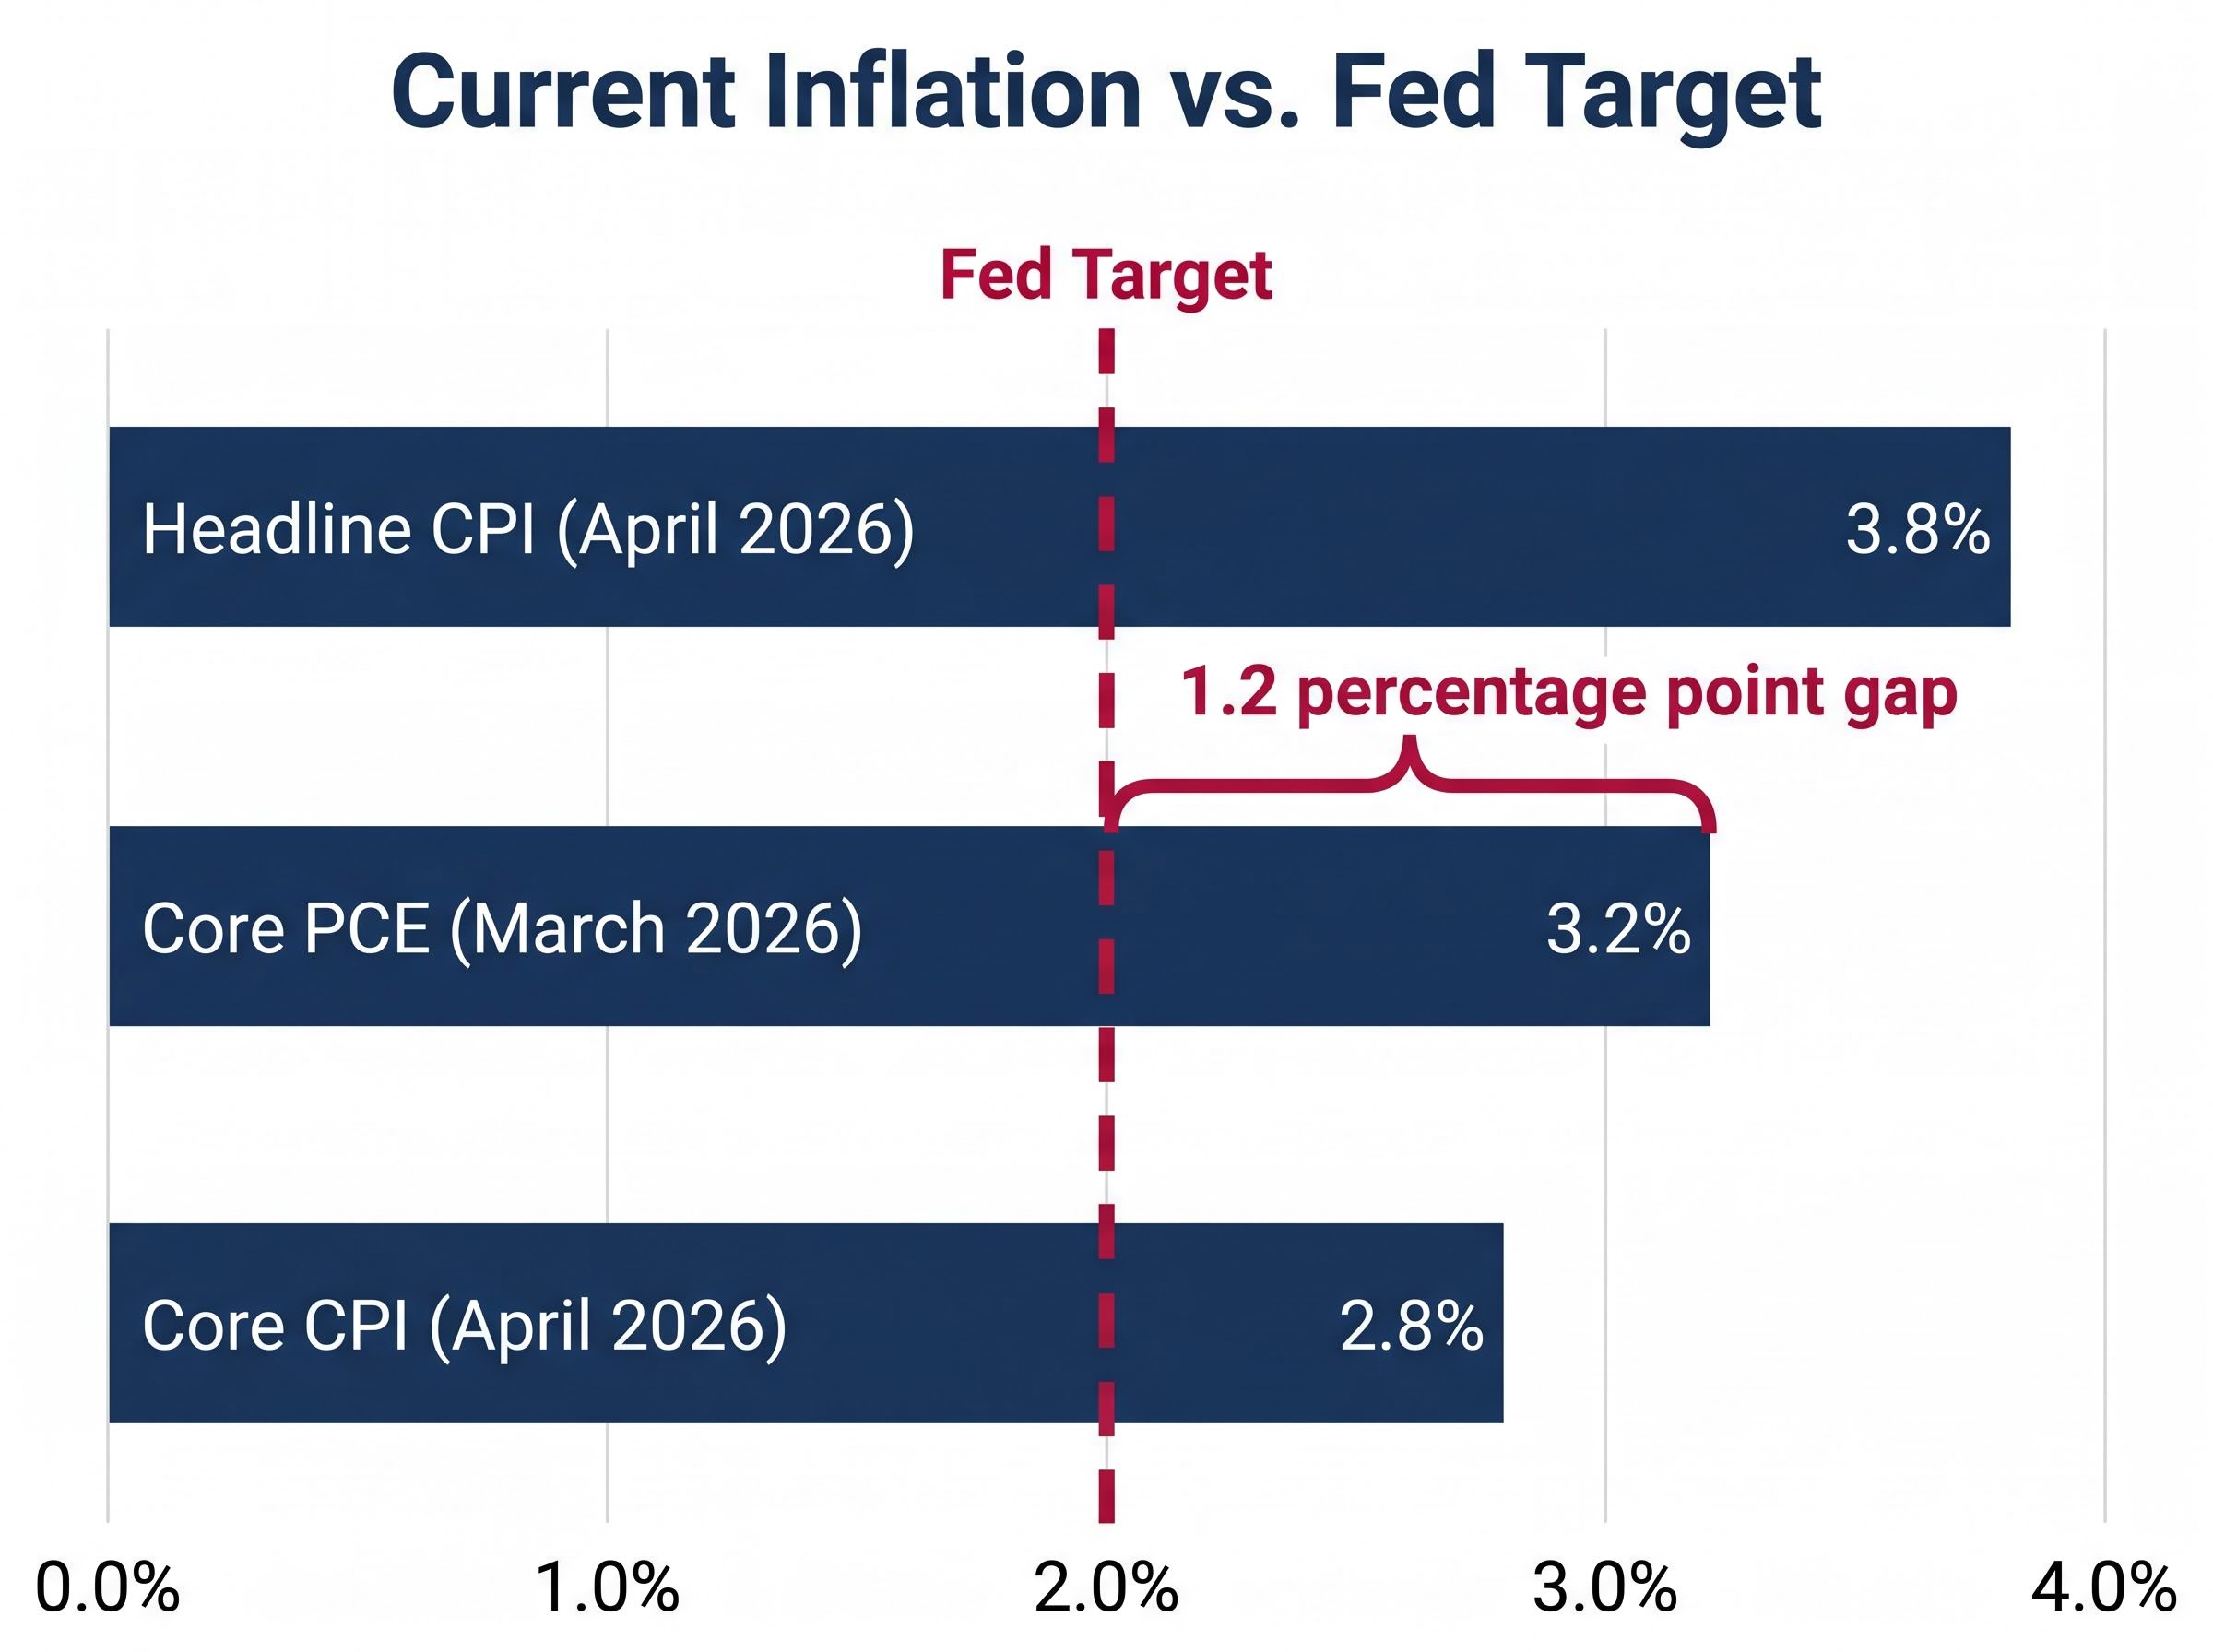
| Headline CPI (YoY) | April 2026 | +3.8% | 2.0% |
| Core CPI (YoY) | April 2026 | +2.8% | 2.0% |
| Core PCE (YoY) | March 2026 | +3.2% | 2.0% |
The gap between the rightmost column and the readings beside it is the story. Headline CPI is nearly double the target. Core PCE, the measure the Fed watches most closely, is running 1.2 percentage points above where it needs to be. Progress has occurred since the 2022 highs, but the distance remaining is still substantial.
The BEA’s March 2026 Personal Income and Outlays report is the primary source for the 3.2% core PCE figure cited above, and its detailed breakdowns of consumer spending and price pressures across goods and services categories show why the Fed characterises the remaining distance to target as substantive rather than marginal.
What analysts are saying about the path ahead
The characterisations from major financial outlets converge on a single word: gradual. Reuters described inflation as “stuck well above the Fed’s 2% target.” Bloomberg called the pace of disinflation “frustratingly gradual,” noting that core services excluding housing remain sticky. The Financial Times said the April reading “keeps alive discussion of a possible rate increase if price pressures re-accelerate.”
Gradual progress is not stalled progress. But it is not enough for the Fed to ease policy, and it leaves the door open for a reversal if energy costs push headline numbers higher in the months ahead.
How Treasury yields became the stock market’s biggest headache
The 10-year U.S. Treasury yield hit 4.687% in the session preceding 20 May 2026, before retreating to 4.635% on the day. For investors who own equities, that number reaches directly into their portfolios through a mechanism worth understanding step by step.
- The yield rises, reflecting expectations for higher rates or persistent inflation.
- The discount rate increases. Investors use the risk-free rate (anchored to Treasury yields) to calculate what future corporate earnings are worth in today’s dollars.
- The present value of future earnings falls. The further out those earnings sit, the more the discount compounds against them.
- Growth stocks reprice. Companies valued on profits expected years from now, many in technology, see their valuations compress the most.
- Investors rotate to value and income. Sectors generating near-term cash flows become relatively more attractive.
This is not theoretical. It is already happening.
Multiple research teams, including Wolfe Research, Apollo, and Mohamed El-Erian, have concluded that Treasury yields as a policy lever on White House decision-making have displaced the S&P 500, meaning bond market stress is now the primary forcing mechanism on fiscal and monetary pivots rather than equity selloffs.
Goldman Sachs noted in a 16 May equity strategy piece, cited by the Wall Street Journal, that the yield near 4.6% had driven the equity risk premium close to post-2007 lows, “leaving less cushion for earnings disappointments.”
The equity risk premium is the additional return investors demand for holding stocks instead of risk-free Treasuries. When that premium shrinks, any earnings miss or macro shock hits harder because the margin for error has been compressed.
Bank of America’s equity team, quoted by CNBC on 14 May, said clients were adding to financials and energy while trimming large-cap growth and unprofitable tech. The bank’s May 2026 Global Fund Manager Survey, summarised by Bloomberg on 15 May, found cash levels had ticked up, managers had reduced exposure to long-duration growth equities, and the top tail risk cited was “higher for longer rates.”
The Financial Times observed on 18 May that at yields near 4.7%, “investors increasingly see Treasuries as a viable alternative to equities.” That competition for capital is what turns a bond market story into a stock market problem.
What a Fed rate hike would actually mean, and why the odds jumped
The consensus base case among major Wall Street institutions remains that the Fed is done hiking. A prolonged hold at current rates, not another increase, is what most strategists expect. That context matters, because the probability data is more alarming without it.
CME FedWatch data, reported by Reuters on 19 May, showed traders assigning more than a 40% chance of at least one additional hike by December 2026. The probability of a 50-basis-point December hike specifically rose from 4.2% to 13.7% in a single week. A month ago, a hike scenario sat at the far edge of market pricing. It no longer does.
| Strategist / Institution | Position on Hike Risk | Key Condition for a Hike |
|---|---|---|
| Goldman Sachs (Jan Hatzius) | Still expects cuts, not hikes | “A material upside surprise” in inflation |
| BlackRock (Wei Li) | Base case is prolonged hold; hike “cannot be ruled out” | Inflation data reaccelerates |
| JPMorgan AM (David Kelly) | “Non-trivial” probability of a hike | Upside risks from energy and housing |
| Morgan Stanley (Ellen Zentner) | Base case is no hike | Core PCE moves back toward 3% on a sustained basis |
| William Dudley (former NY Fed president) | Fed “may well have to hike again” | Inflation drifts higher; policy less restrictive than assumed after adjusting for term premia |
The one condition that changes everything
A common thread runs through every view in that table. The trigger is the same: a sustained move in core PCE back toward or above 3%. Goldman requires it. Morgan Stanley requires it. BlackRock and JPMorgan frame the risk around it. William Dudley’s concern is that current policy may not be restrictive enough to prevent it.
The Fed leadership transition adds a further layer of institutional uncertainty to the rate outlook: Kevin Warsh was confirmed as Chair on 13 May 2026 with three regional Fed presidents already calling publicly for hikes by Q3, while Jerome Powell remains on the Board of Governors through 2028, creating an internal dynamic with no modern precedent.
What would push core PCE in that direction? Oil prices staying above $100 would feed through to goods and services inflation over the next two to three monthly prints. If core services excluding housing, already described as sticky by Bloomberg, fail to decelerate alongside, the combination could bring the 3% threshold within reach. That is the scenario that would force the Fed’s hand.
The next major ASX story will hit our subscribers first
What the macro convergence means for portfolios in the second half of 2026
Oil above $100, Treasury yields near 4.7%, and rising rate-hike probability are not three separate stories. They form a single feedback loop: elevated energy prices sustain inflation, which keeps yields high, which in turn raises the probability that the Fed tightens further. The portfolio implications follow from that loop rather than from any one piece of it.
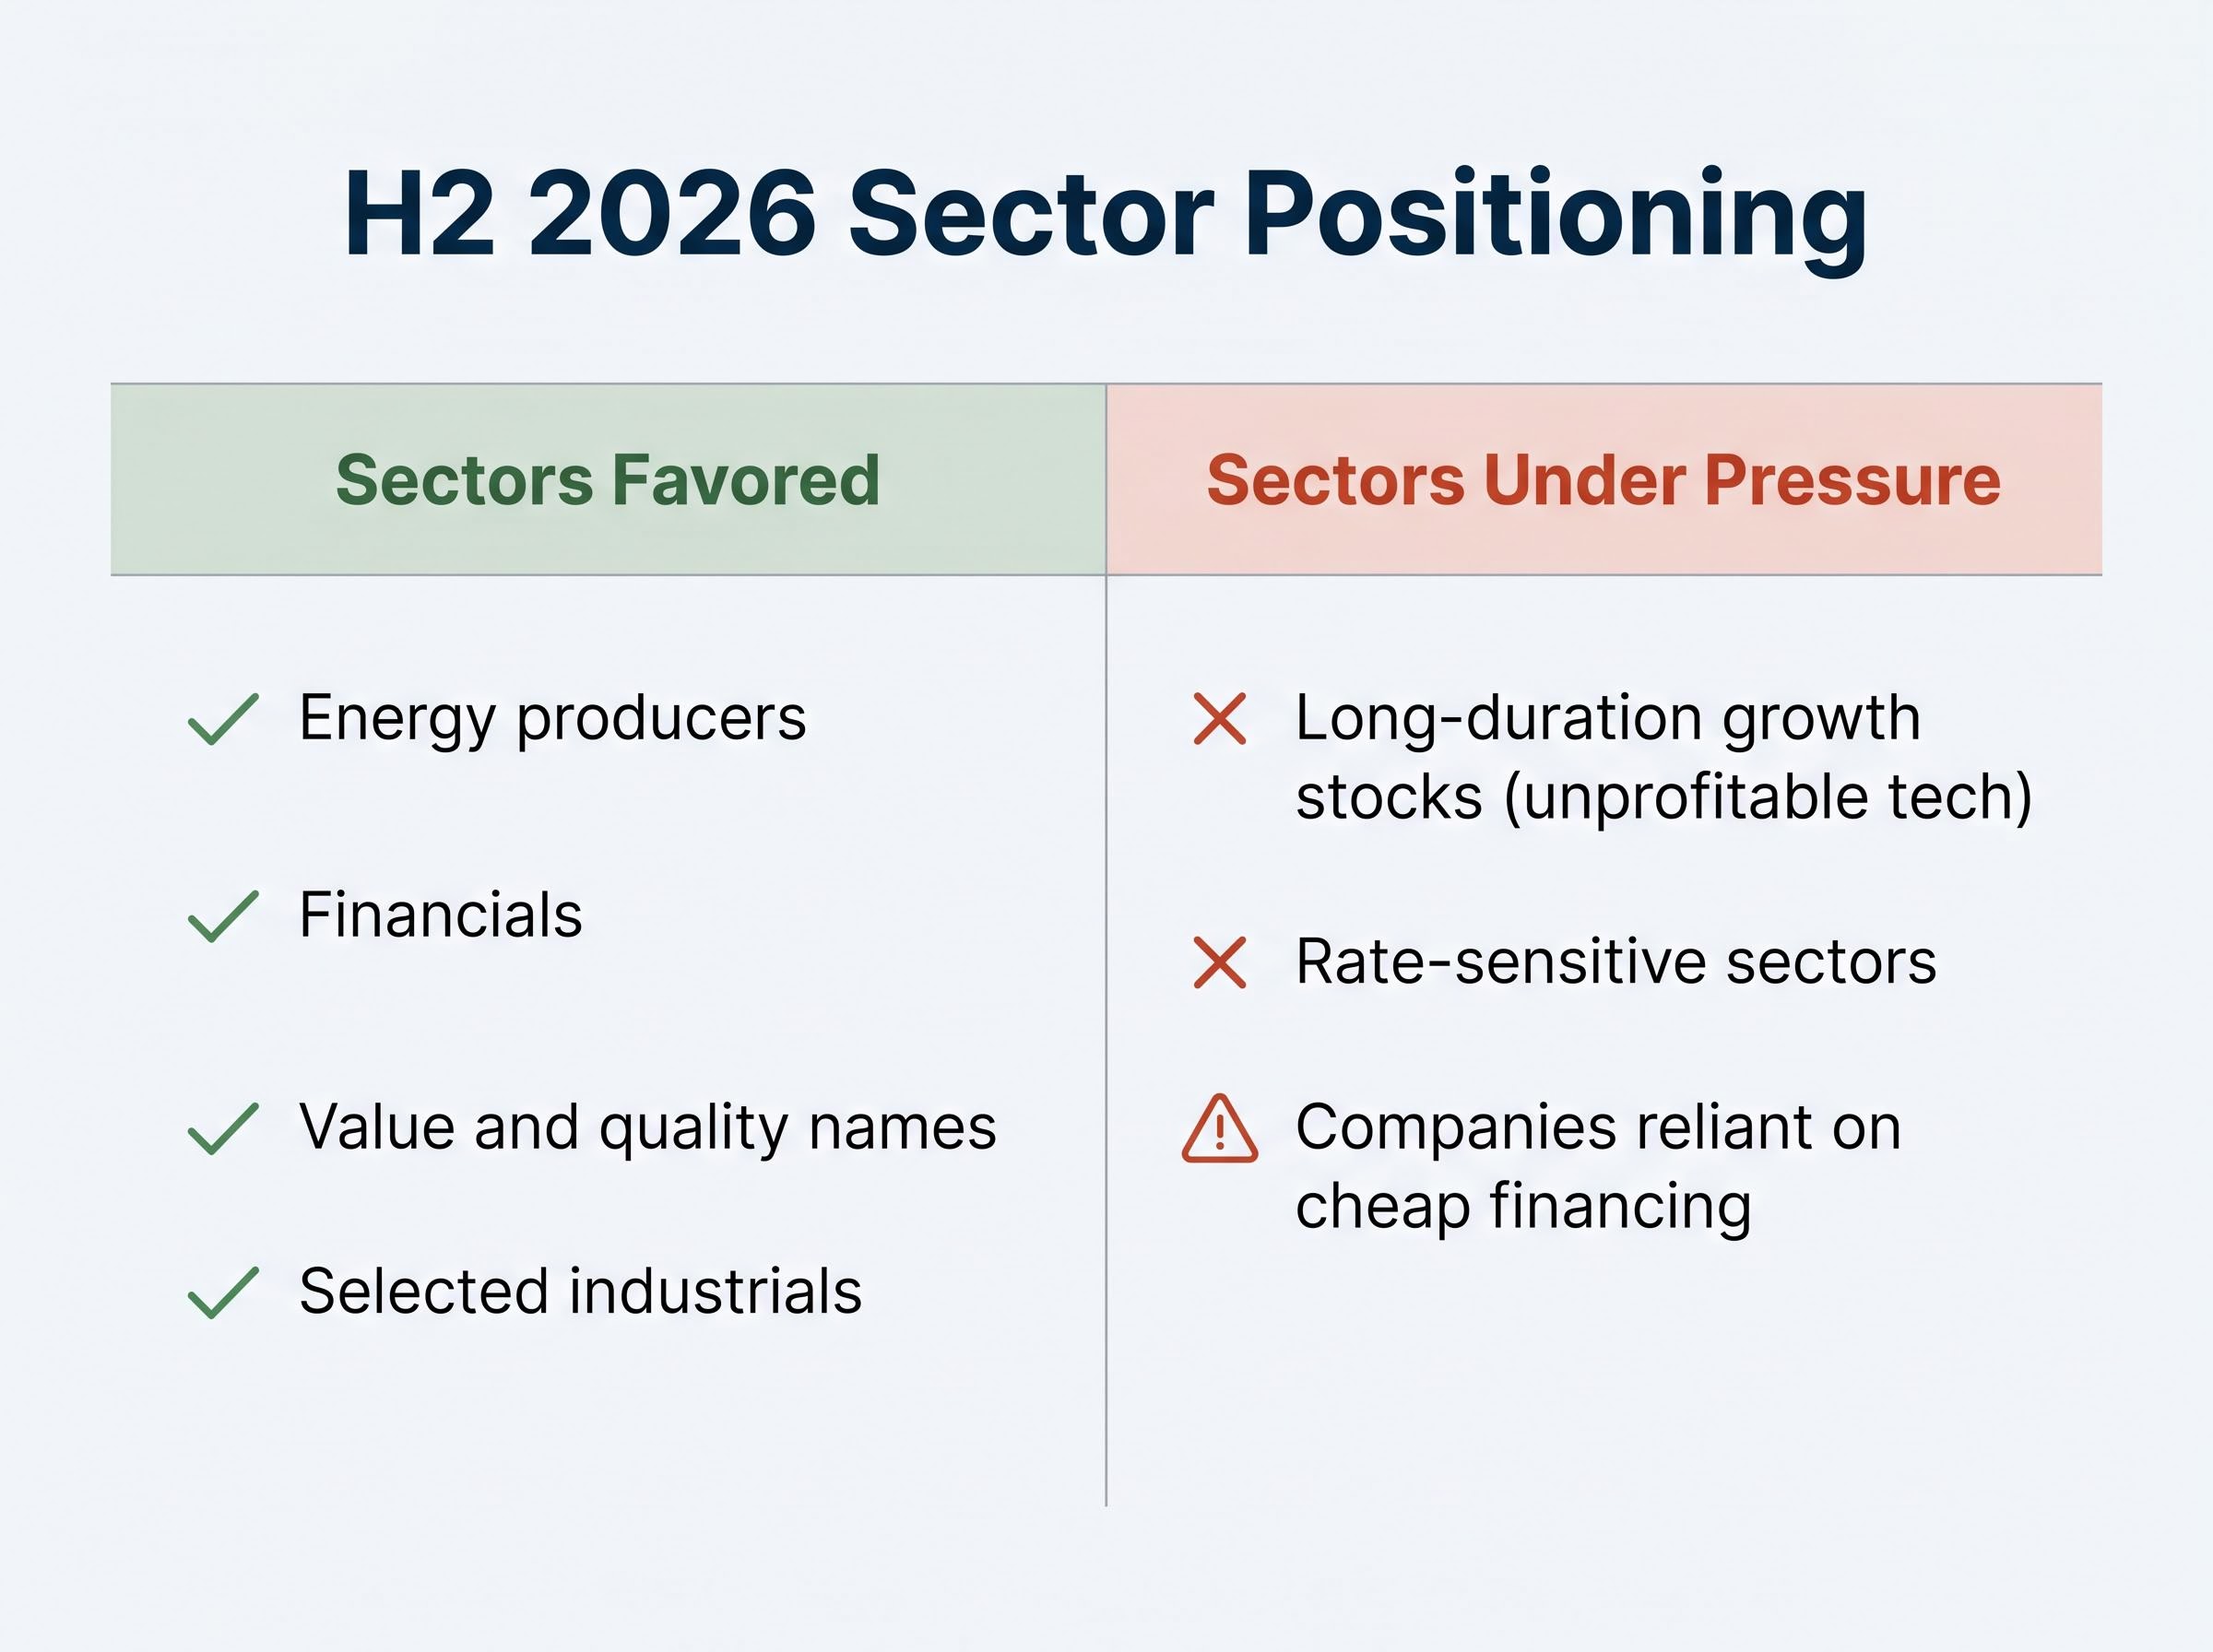
The directional consensus across major firms is unusually consistent. Sectors favoured:
- Energy producers that benefit directly from high oil prices
- Financials, which tend to earn wider net interest margins when rates stay elevated
- Value and quality names with strong free cash flow and near-term earnings
- Selected industrials with pricing power
Sectors under pressure:
- Long-duration growth stocks, particularly unprofitable tech
- Rate-sensitive sectors exposed to higher discount rates
- Companies reliant on cheap financing for expansion
Goldman Sachs forecast “modest positive returns” for the S&P 500 in the second half of 2026, led by energy, quality tech, and selected industrials. Bank of America expects a “choppy, range-bound” market and recommends overweighting value, financials, and energy. BlackRock sees “mid-single-digit” total return potential in the base case, with a tilt toward quality free-cash-flow companies. Morgan Stanley’s Mike Wilson cited “limited upside” given higher real yields and elevated oil, with downside risk if the Fed is forced to hike.
JPMorgan’s equity strategy team warned of a “negative skew” to equity returns in late 2026 if oil remains above $100 and pushes headline inflation higher while earnings margins compress, a scenario where the Fed tightens conditions just as corporate profitability comes under pressure.
The base case is modest, range-bound returns. The downside tail is a Fed hike coinciding with margin pressure. Investors calibrating risk tolerance for the months ahead are weighing those two scenarios against each other.
The second half of 2026 will be decided by one number
Three forces, oil prices, Treasury yields, and Fed rate expectations, have dominated the stock market outlook for the past month. They appear distinct but link to a single variable: core PCE inflation. If core PCE decelerates toward 2.5%, the base case holds, yields stabilise, and the hike scenario fades. If it drifts toward 3%, the tail risk that every strategist in this article acknowledged becomes the central scenario.
The base case remains no hike. But the tail risk has moved from negligible to material within weeks, and the next core PCE release will either confirm or challenge that shift.
Two data points will determine whether the current anxiety resolves or intensifies: the next monthly core PCE print and any escalation in Middle East shipping disruptions that could push oil prices above the current $108-$111 range. Monitoring CME FedWatch probabilities alongside those releases offers the most direct real-time signal of how this story develops. Reviewing portfolio duration and energy exposure against the positioning consensus outlined above, before the next inflation print, is a practical step for investors navigating this environment.
For investors who want a structured framework for acting on the positioning consensus rather than tracking individual analyst calls, our comprehensive walkthrough of sector rotation strategy covers business cycle phase classification, the cyclical versus defensive sector map, and how Relative Rotation Graphs and fund flow data can reveal where institutional capital is moving before official economic data confirms it.
This article is for informational purposes only and should not be considered financial advice. Investors should conduct their own research and consult with financial professionals before making investment decisions. Past performance does not guarantee future results. Financial projections are subject to market conditions and various risk factors.