
How Hormuz Closure at $104 Oil Is Reshaping Every Asset Class
9 hrs ago

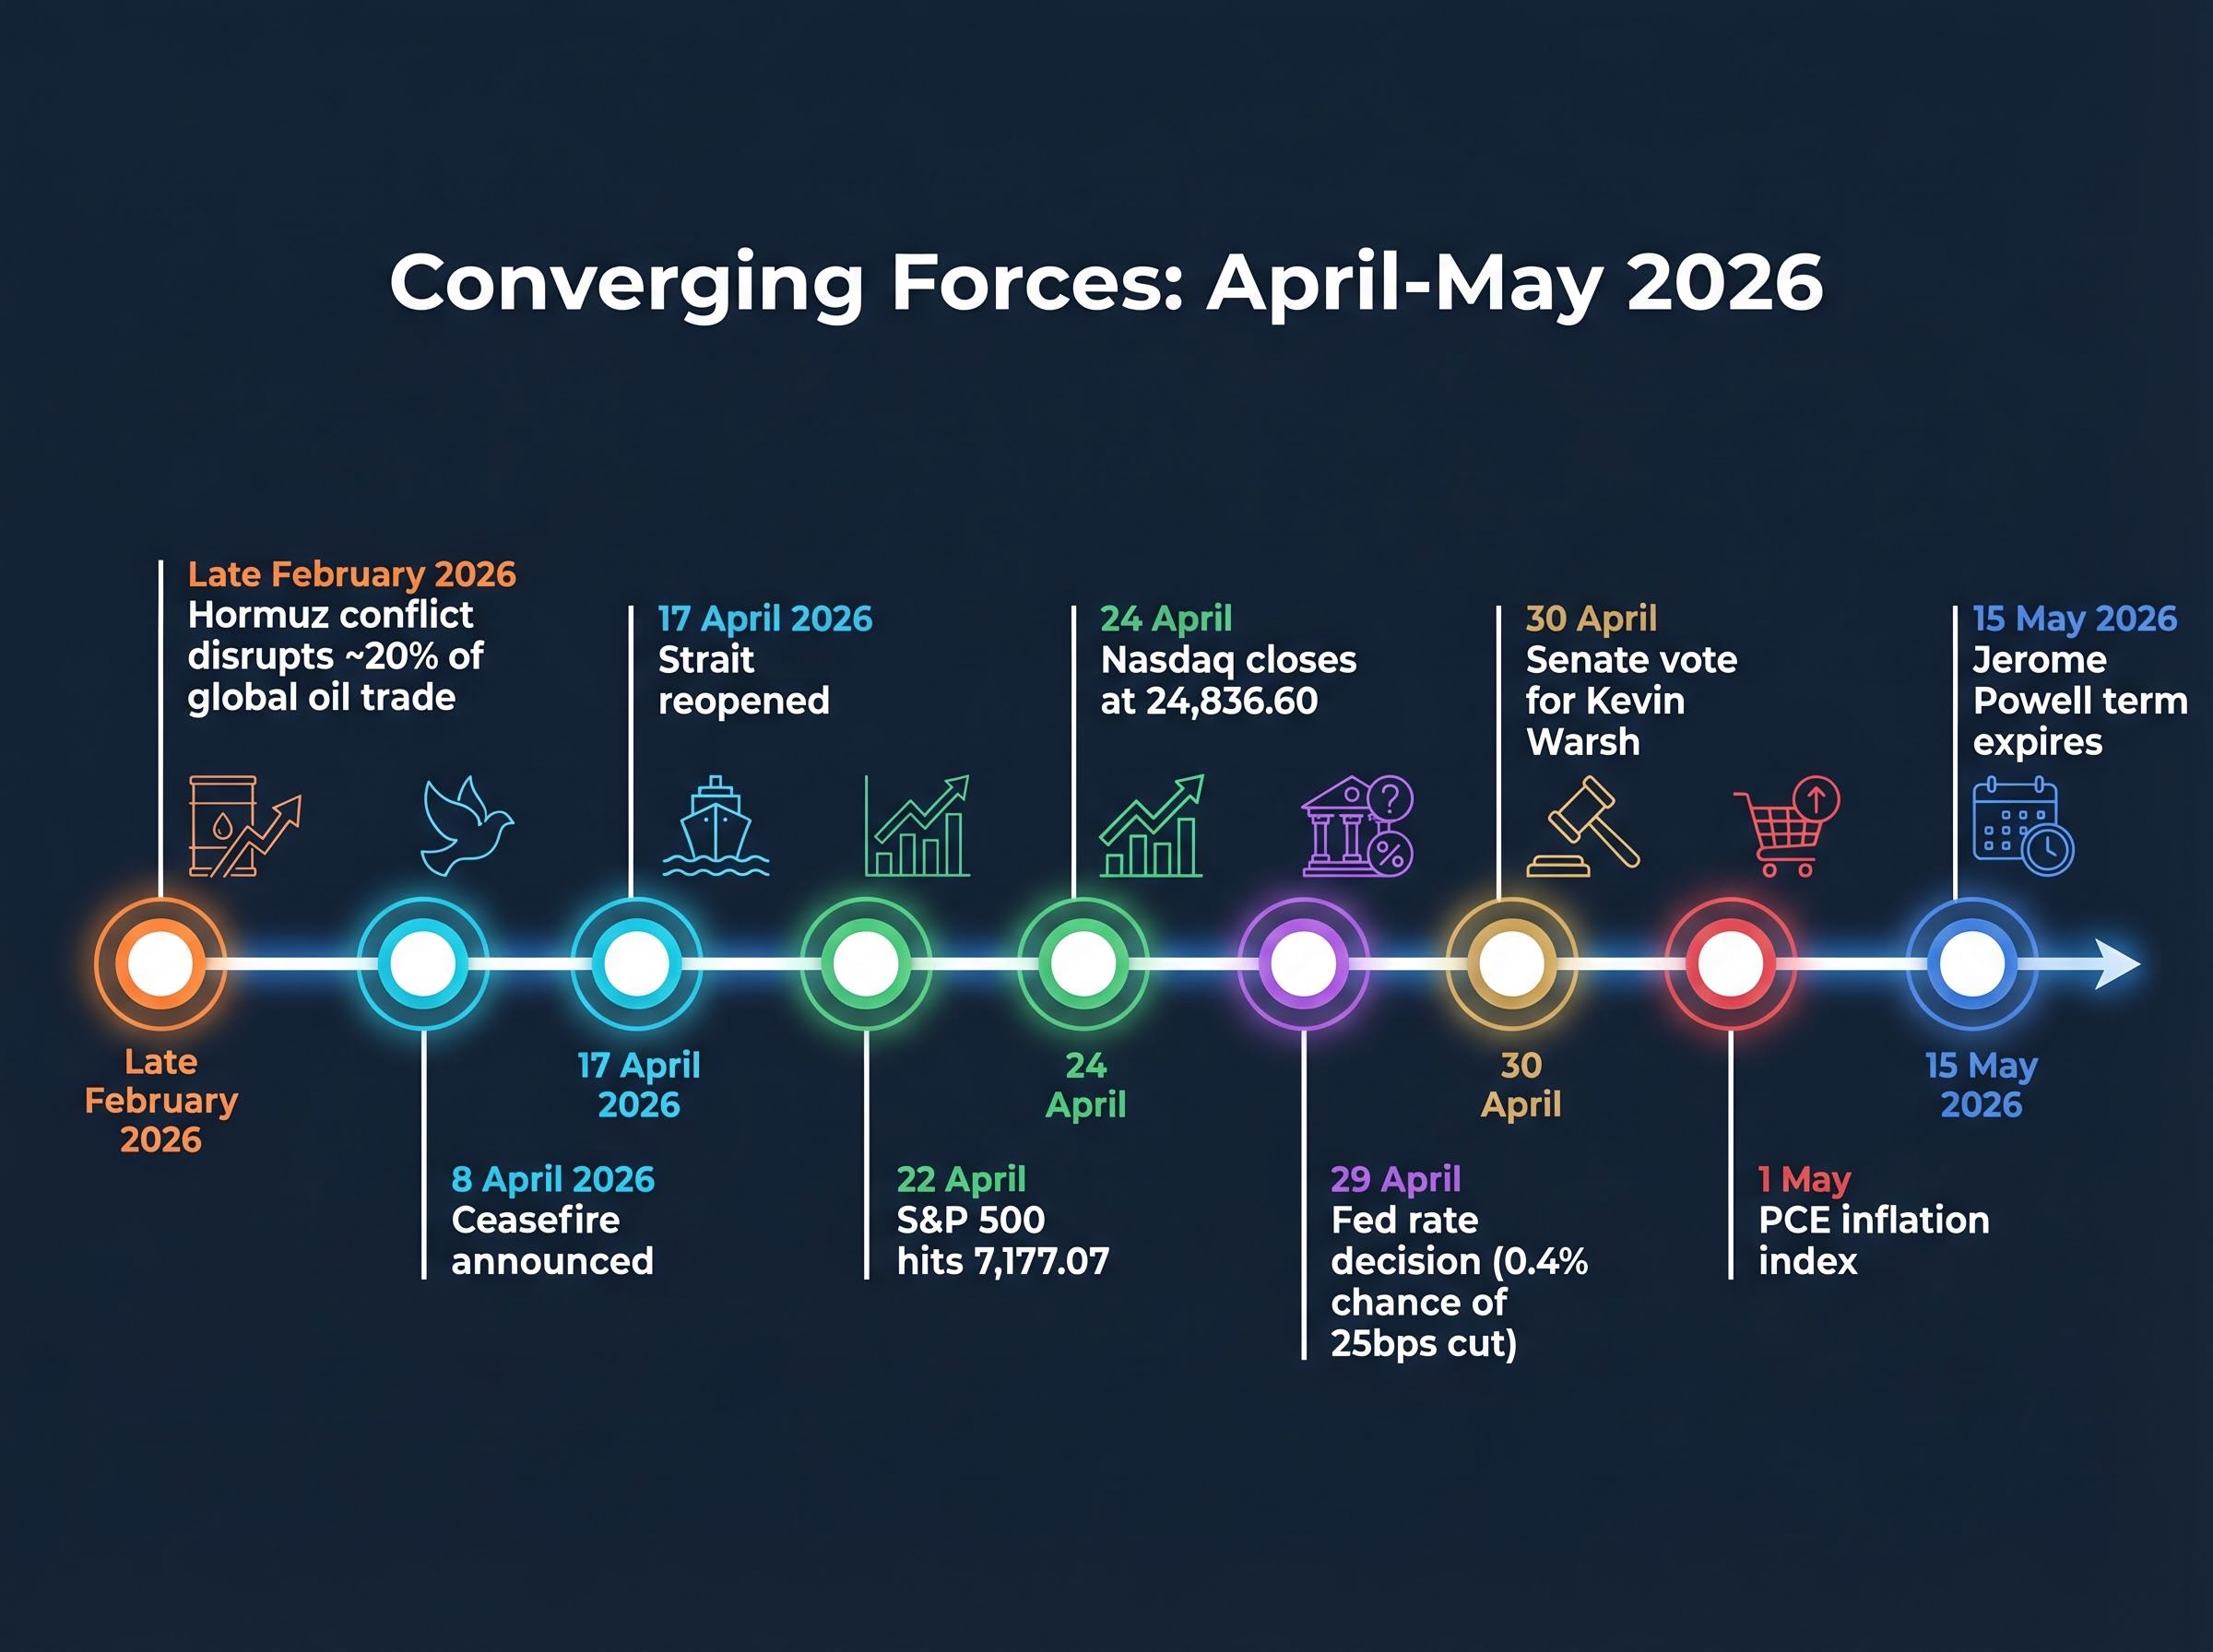
“`json { “fact_checked_full_article”: “The stock market outlook for the week of 28 April 2026 hinges on a convergence that has no recent precedent. Five companies controlling roughly one-quarter of the S&P 500’s total market capitalisation are reporting earnings within days of one another. The Federal Reserve delivers its rate decision on 29 April. And the Strait of Hormuz, closed for weeks by military conflict, reopened only ten days ago with no formal peace agreement underpinning the ceasefire. Markets arrived at this juncture near all-time highs: the S&P 500 touched 7,177.07 on 22 April, and the Nasdaq closed at 24,836.60 on 24 April after a 12-session winning streak, its longest since 2009. The momentum is real. Whether it survives a week loaded with binary outcomes across earnings, monetary policy, and geopolitics is the question that defines the current stock market outlook. What follows breaks down each converging force, explains the semiconductor rally providing the bullish backdrop, and maps three scenarios for how markets may resolve once this week’s data clears.\n\n## How residual oil risk and unresolved diplomacy keep energy inflation in play\n\nThe geopolitical timeline of the past two months has moved quickly, and most of the relief has already been priced into equities. A brief chronology:\n\n1. Late February 2026: Military conflict involving Iran disrupted shipping through the Strait of Hormuz, which handles approximately 20% of global oil trade.\n2. 8 April 2026: A ceasefire was announced, easing immediate supply fears.\n3. 17 April 2026: The Strait of Hormuz officially reopened to commercial shipping.\n4. 24 April 2026: Reuters reported no US-Iran peace talks in sight, despite earlier Pakistani mediation efforts.\n\nBy late April, the equity rally was being driven by tech earnings rather than fresh geopolitical developments. The relief trade from the ceasefire and Strait reopening had largely run its course.\n\n### Why the Hormuz reopening has not fully removed the oil risk premium\n\nOil markets price expectations of future supply disruption, not just current flows. A reopened strait without a confirmed diplomatic resolution still supports elevated prices because traders factor in the probability of re-closure.\n\nWTI crude stabilised above $92 per barrel in the week of 27 April, with prices extending gains rather than declining. That persistence feeds directly into the inflation data the Fed is watching. Producer prices (PPI) rose 4.0% year-over-year in March 2026, the largest increase since February 2023, with energy and gasoline costs contributing to the acceleration.\n\nThe connection matters: elevated oil keeping PPI sticky limits the Fed’s room to signal rate cuts, meaning Hormuz stability is not merely a risk-off consideration. It is a direct input into monetary policy expectations.\n\n## Market concentration at its peak as AI earnings season reaches its decisive moment\n\n> Five companies, Microsoft, Alphabet, Meta Platforms, Amazon, and Apple, represent approximately one-quarter of the S&P 500’s total market capitalisation. All five are reporting Q1 2026 results this week.\n\nThat concentration means the index’s near-term direction is being determined, in practical terms, by a handful of earnings calls. The Roundhill Magnificent Seven ETF gained approximately 15% in April 2026, outpacing the broader S&P 500’s roughly 10% advance over the same period. The gap between the mega-caps and the rest of the market has widened rather than narrowed.\n\nThe specific metrics that will move each name differ, but the overarching question is the same: whether AI-driven capital expenditure is translating into revenue growth at scale.\n\n
| Company | Key metric to watch | Why it matters |
|---|---|---|
| Microsoft | Azure cloud growth rate | Direct measure of enterprise AI adoption |
| Alphabet | Cloud revenue, AI capex guidance | Validates Google Cloud’s AI infrastructure spend |
| Meta Platforms | Ad revenue growth, AI capex trajectory | Tests whether AI investment is driving ad targeting returns |
| Amazon | AWS revenue, margin expansion | AWS profitability signals cloud demand durability |
| Apple | Services revenue, device cycle momentum | Consumer-facing AI integration progress |
\n
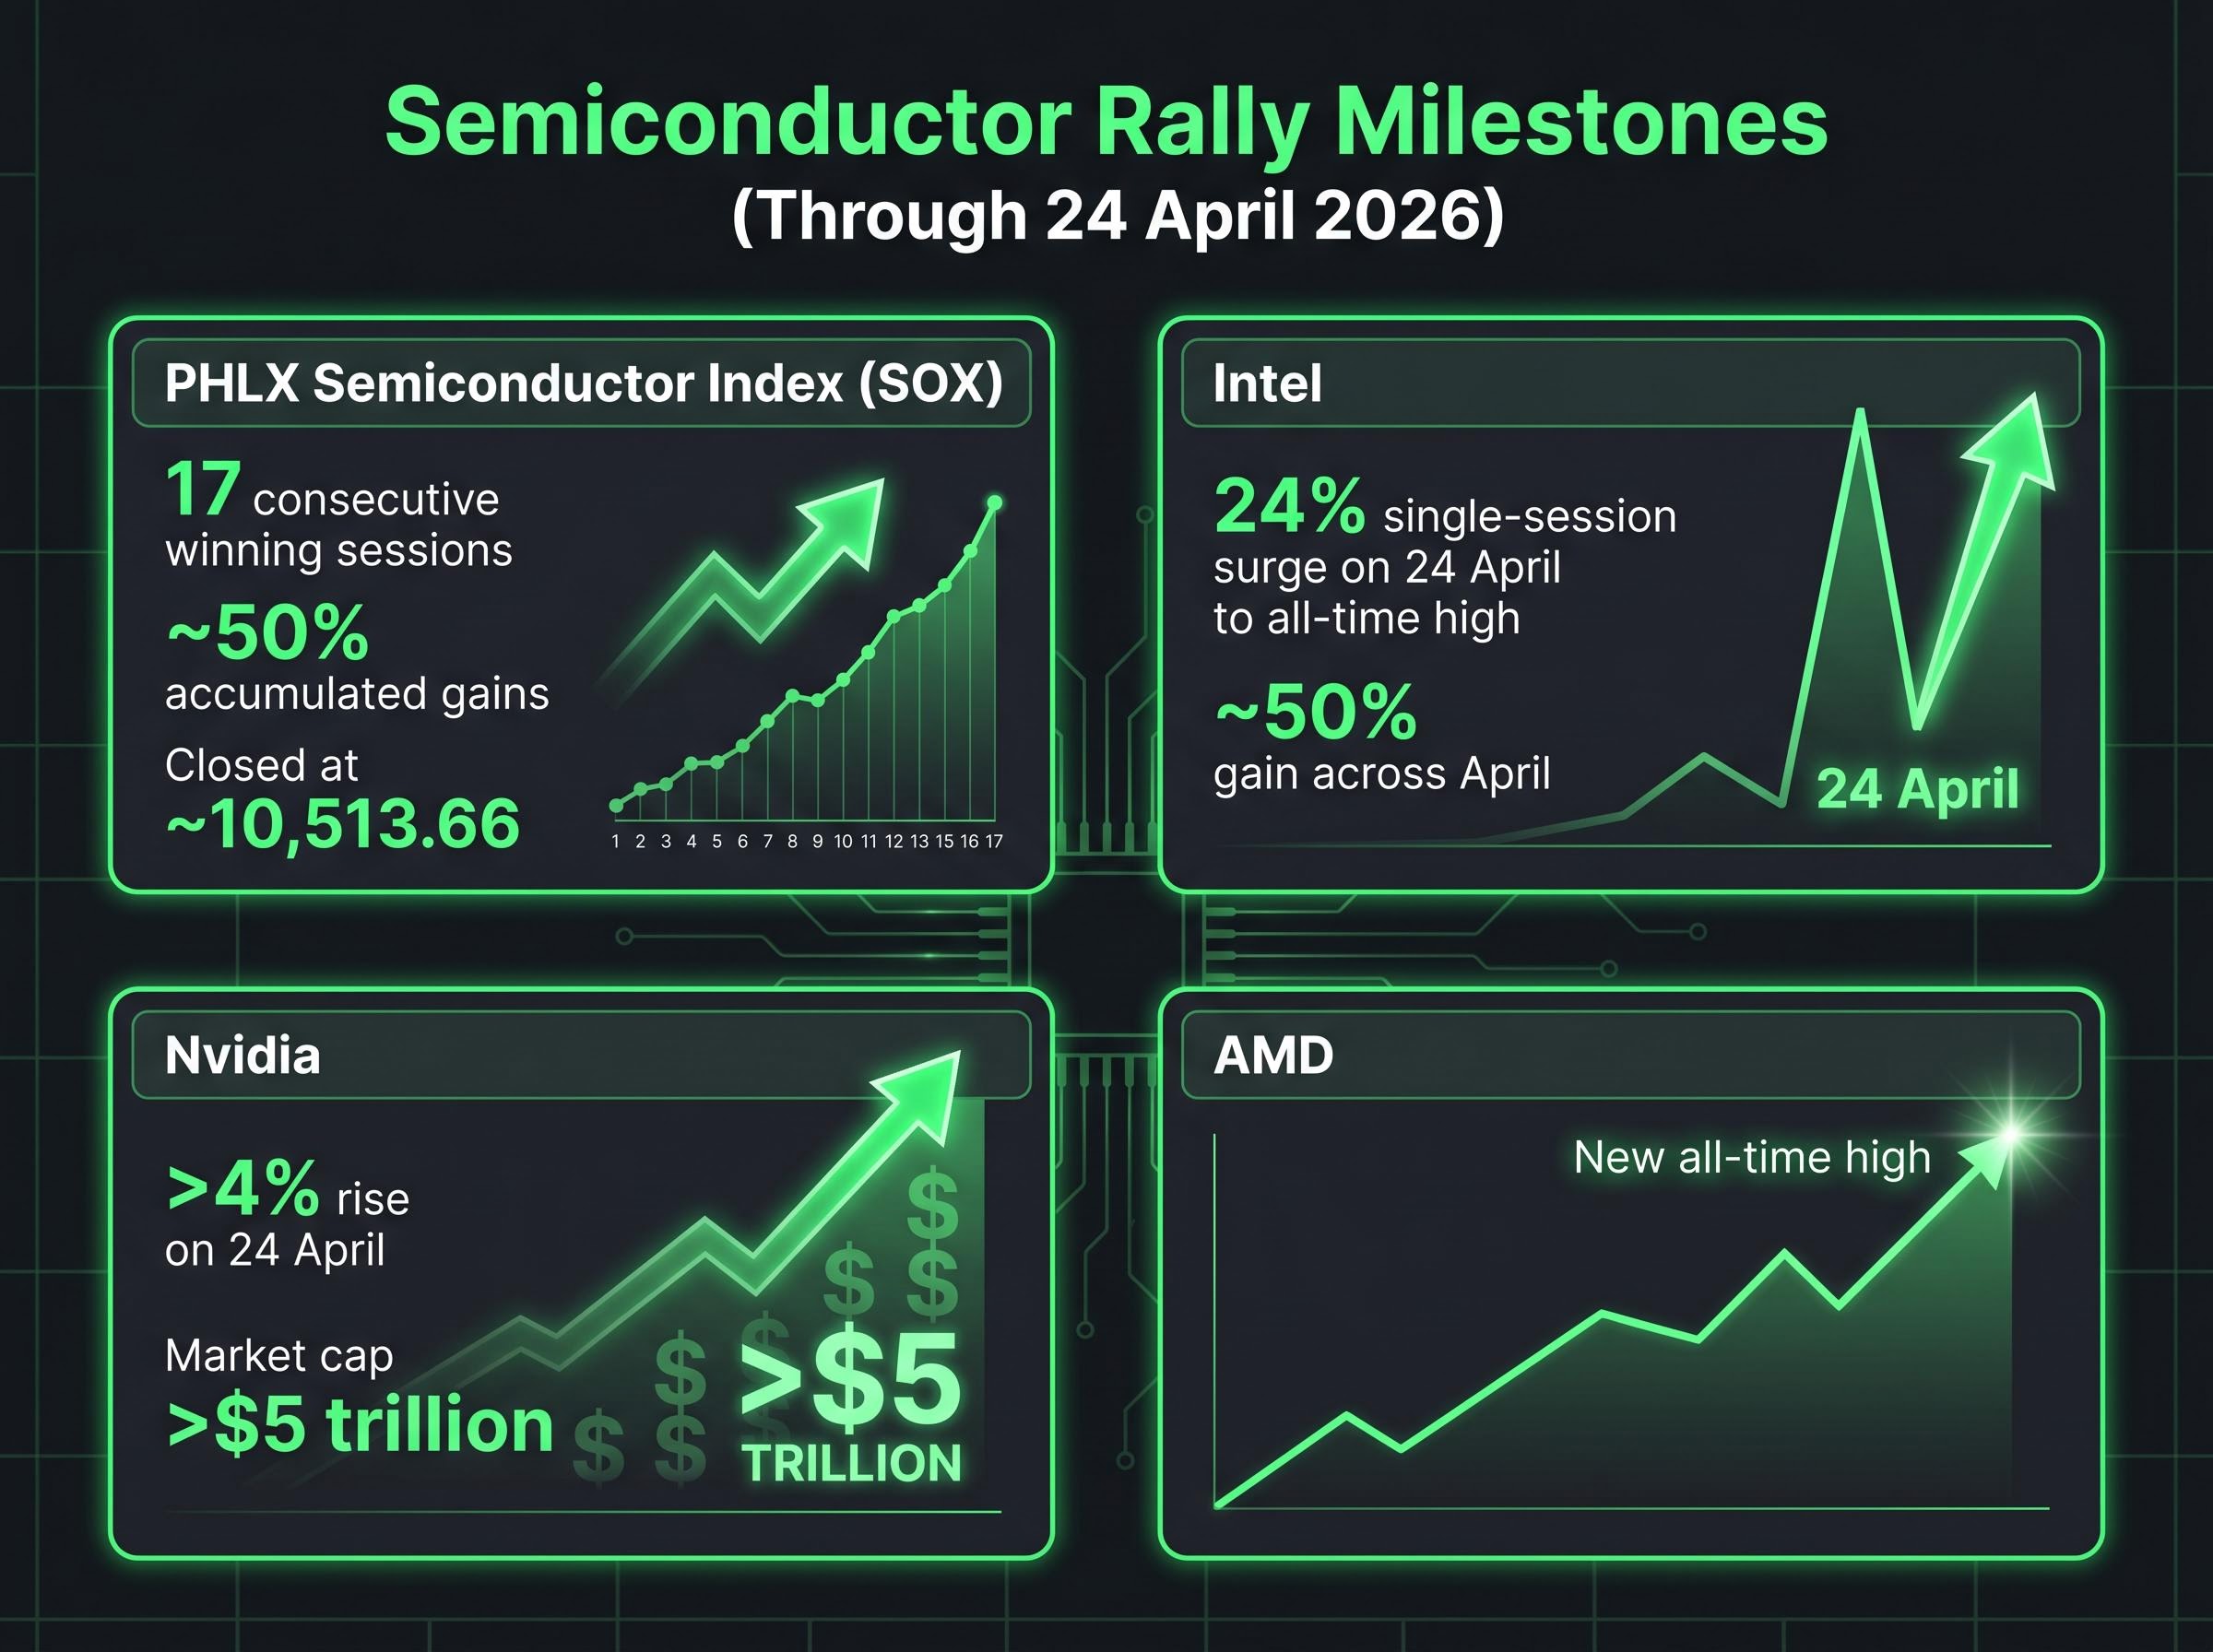
\n\nThere is no neutral outcome from this week. These five names either validate the AI spending thesis that has powered the market to all-time highs, or they introduce doubt into a narrative that currently supports one-quarter of the index’s value.\n\n## How 17 sessions of chip sector gains reflect institutional confidence in AI infrastructure\n\nThe PHLX Semiconductor Index (SOX) advanced for 17 consecutive trading sessions through approximately 24 April, accumulating roughly 50% in gains over that stretch. The index closed at approximately 10,513.66 during this period. Winning streaks of this length are not noise; they reflect sustained institutional buying across sessions, not a single catalyst.\n\nThree individual milestones within the streak illustrate its breadth:\n\n- Intel surged 24% in a single session on 24 April to an all-time high, surpassing its dot-com era record. The stock gained approximately 50% across April alone.\n- Nvidia rose more than 4% on the same day, pushing its market capitalisation above $5 trillion for the first time.\n- AMD also reached a new all-time high during the rally period.\n\nThe scale of the run builds a reasonable case for genuine institutional conviction in AI infrastructure demand. When chips move this consistently for this long, markets are pricing in a sustained spending cycle, not a single earnings beat.\n\n### Is the streak pricing in earnings beats or sentiment overshoot?\n\nThe case for durability rests on hyperscaler capex commitments and cloud revenue growth, both of which are about to be tested by this week’s reports. The case for caution is structural timing: the streak concludes directly before the Magnificent Seven begin reporting, creating conditions for a \”buy the rumour, sell the news\” reversal if actual results fall short of the expectations now embedded in semiconductor valuations. What the hyperscalers say about forward capital expenditure plans will determine which interpretation holds.\n\n## What inflation data and the Fed chair transition mean for rate policy this week\n\nThe Federal Reserve’s dual mandate requires balancing maximum employment against price stability. The current inflation profile makes the price stability side of that mandate difficult to satisfy. Consumer prices (CPI) rose 3.3% year-over-year as of March 2026. Producer prices (PPI) rose 4.0% over the same period, the highest reading since February 2023. Both figures sit well above the Fed’s 2% target, and energy costs linked to the Hormuz disruption are a contributing factor.\n\n> The probability of a 25 basis point rate cut at the 29 April meeting stands at approximately 0.4%. The market has effectively removed any near-term cut from its expectations.\n\nThat means the decision itself carries little suspense. A hold is fully priced in. What matters is the tone. This is expected to be Jerome Powell’s final press conference as Fed chair; his term expires on 15 May 2026. Kevin Warsh, a former Fed governor nominated as his successor, is advancing through the Senate Banking Committee, with a vote scheduled for Wednesday, 30 April.\n\nThree signals in Powell’s press conference warrant close attention:\n\n- Whether the statement’s inflation language acknowledges energy-driven price pressures as transitory or persistent\n- Any explicit framing of oil price effects as separable from core inflation trends\n- Any shift in the implied timeline for future rate cuts, particularly toward late 2026\n\n\”Holding rates steady while signalling patience\” means, in practical terms, that borrowing costs remain elevated and equity valuations stay under pressure from discount rates. The Personal Consumption Expenditures (PCE) inflation index, the Fed’s preferred inflation gauge, is scheduled for release on Thursday, 1 May, providing the next data point immediately after the decision.\n\n## Three scenarios for where markets go after this week’s data clears\n\nMarkets do not move on whether news is good or bad in absolute terms. They move on how outcomes compare to what is already priced in. The S&P 500 traded at 7,165 on 24 April, approximately 0.2% below its all-time high. The Dow Jones fell 79.61 points to 49,230.71 on the same day, underperforming broader indices. Industrial production dipped 0.5% in March 2026, a softness indicator that could complicate the growth narrative if earnings disappoint.\n\nSector positioning heading into the week shows technology, communication services, and consumer discretionary leading, while utilities, energy, and consumer staples lag.\n\n
| Scenario | Trigger conditions | Likely market reaction | Key sectors affected |
|---|---|---|---|
| Bullish | Earnings beats across Magnificent Seven; dovish Fed language; oil holds below $95 | S&P 500 extends above 7,177; semiconductor rally continues | Technology, communication services, consumer discretionary accelerate |
| Bearish | Earnings misses or capex downgrades; hawkish Fed tone; Hormuz tensions resurface | Broad risk-off rotation; S&P 500 pulls back toward 6,900-7,000 range | Technology sells off; defensive sectors (utilities, staples) outperform |
| Split (most likely) | Strong tech earnings offset by hawkish Fed or sticky PCE data on 1 May | Narrow range; tech holds gains while broader index churns | Mega-cap tech diverges from cyclicals; Dow underperforms Nasdaq |
\n
\n\nThe split scenario is the most probable given current conditions. Strong tech results may be partially offset by Fed caution on inflation, producing a week where mega-cap names hold or advance while the broader market trades sideways. The PCE release on Thursday is the final input that could shift the framing even after the Fed decision.\n\n## Conclusion\n\nThis is not a routine week of earnings or a standard Fed meeting. The simultaneous convergence of Magnificent Seven reports, the FOMC decision, a Fed chair transition, and residual geopolitical risk from the Strait of Hormuz creates a compressed window where multiple independent variables resolve at once. The sequence is specific: earnings reports begin immediately, Powell speaks on Wednesday, and PCE data lands on Thursday. Each data point reshapes the probability set for what follows it.\n\nThe investors best positioned for this week are those who have identified, in advance, which specific numbers and phrases will change their view, rather than those waiting to see which direction the market moves before reacting.\n\n> This article is for informational purposes only and should not be considered financial advice. Investors should conduct their own research and consult with financial professionals before making investment decisions. Past performance does not guarantee future results. Financial projections are subject to market conditions and various risk factors.\n\n—” } “`
For investors wanting a structured framework for positioning across these scenarios rather than reacting to headlines, our dedicated guide to investing during market volatility in 2026 walks through sector rotation strategies, the case for energy and safe-haven exposure, and why disciplined rebalancing consistently outperforms panic selling during geopolitically driven drawdowns.
Fed balance sheet reduction accelerating under Warsh is a separate but compounding risk that the rate decision itself will not address: a recently published Fed research paper outlined the potential for up to $2.1 trillion in additional holdings reduction, and Warsh’s known preference for aggressive quantitative tightening means his confirmation could materially extend the liquidity withdrawal path beyond what current market pricing implies.
The durability case for the semiconductor rally also depends on whether hyperscaler capex commitments can translate into operational capacity on schedule, and physical constraints on AI infrastructure delivery, from HBM3e memory scarcity extending beyond 2026 to grid interconnection queues exceeding 2,100 GW, mean that announced spending does not automatically convert to deployed compute at the pace chip valuations currently imply.
AI capital expenditure ROI sustainability is precisely the question this earnings season is being asked to answer: consensus hyperscaler capex for 2026 has reached $527 billion, yet no major provider has publicly mapped a path to proportionate returns, and a KPMG survey found 75% of large-company CEOs believe generative AI has been overhyped even as they continue to allocate capital to it.
The Council on Foreign Relations analysis of the Iran ceasefire extension and stalled peace talks noted that commercial traffic disruptions persisted well after the formal ceasefire announcement, a finding consistent with oil markets continuing to price a re-closure risk premium rather than treating the Strait’s reopening as a resolved event.
The week of 28 April 2026 presents an unusually compressed set of market-moving events: all five Magnificent Seven companies report Q1 2026 earnings, the Federal Reserve delivers its rate decision on 29 April, and oil markets remain elevated above $92 per barrel despite the Strait of Hormuz reopening on 17 April with no formal peace agreement in place.
Oil markets continue to price a re-closure risk premium because no diplomatic resolution has been reached, keeping WTI crude above $92 per barrel and contributing to a 4.0% year-over-year PPI reading in March 2026, which limits the Federal Reserve's room to signal near-term rate cuts.
Microsoft, Alphabet, Meta Platforms, Amazon, and Apple collectively represent approximately one-quarter of the S&P 500's total market capitalisation, meaning their Q1 2026 results will either validate the AI spending thesis supporting current index levels or introduce doubt into the narrative underpinning those valuations.
The split scenario is considered most probable: strong tech earnings may be partially offset by a cautious Federal Reserve tone on inflation or sticky PCE data due Thursday 1 May, resulting in mega-cap tech holding gains while the broader index trades sideways.
Key signals to monitor include whether the Fed characterises energy-driven inflation as transitory or persistent, any explicit framing of oil price effects as separable from core inflation trends, and any shift in the implied timeline for rate cuts toward late 2026.


