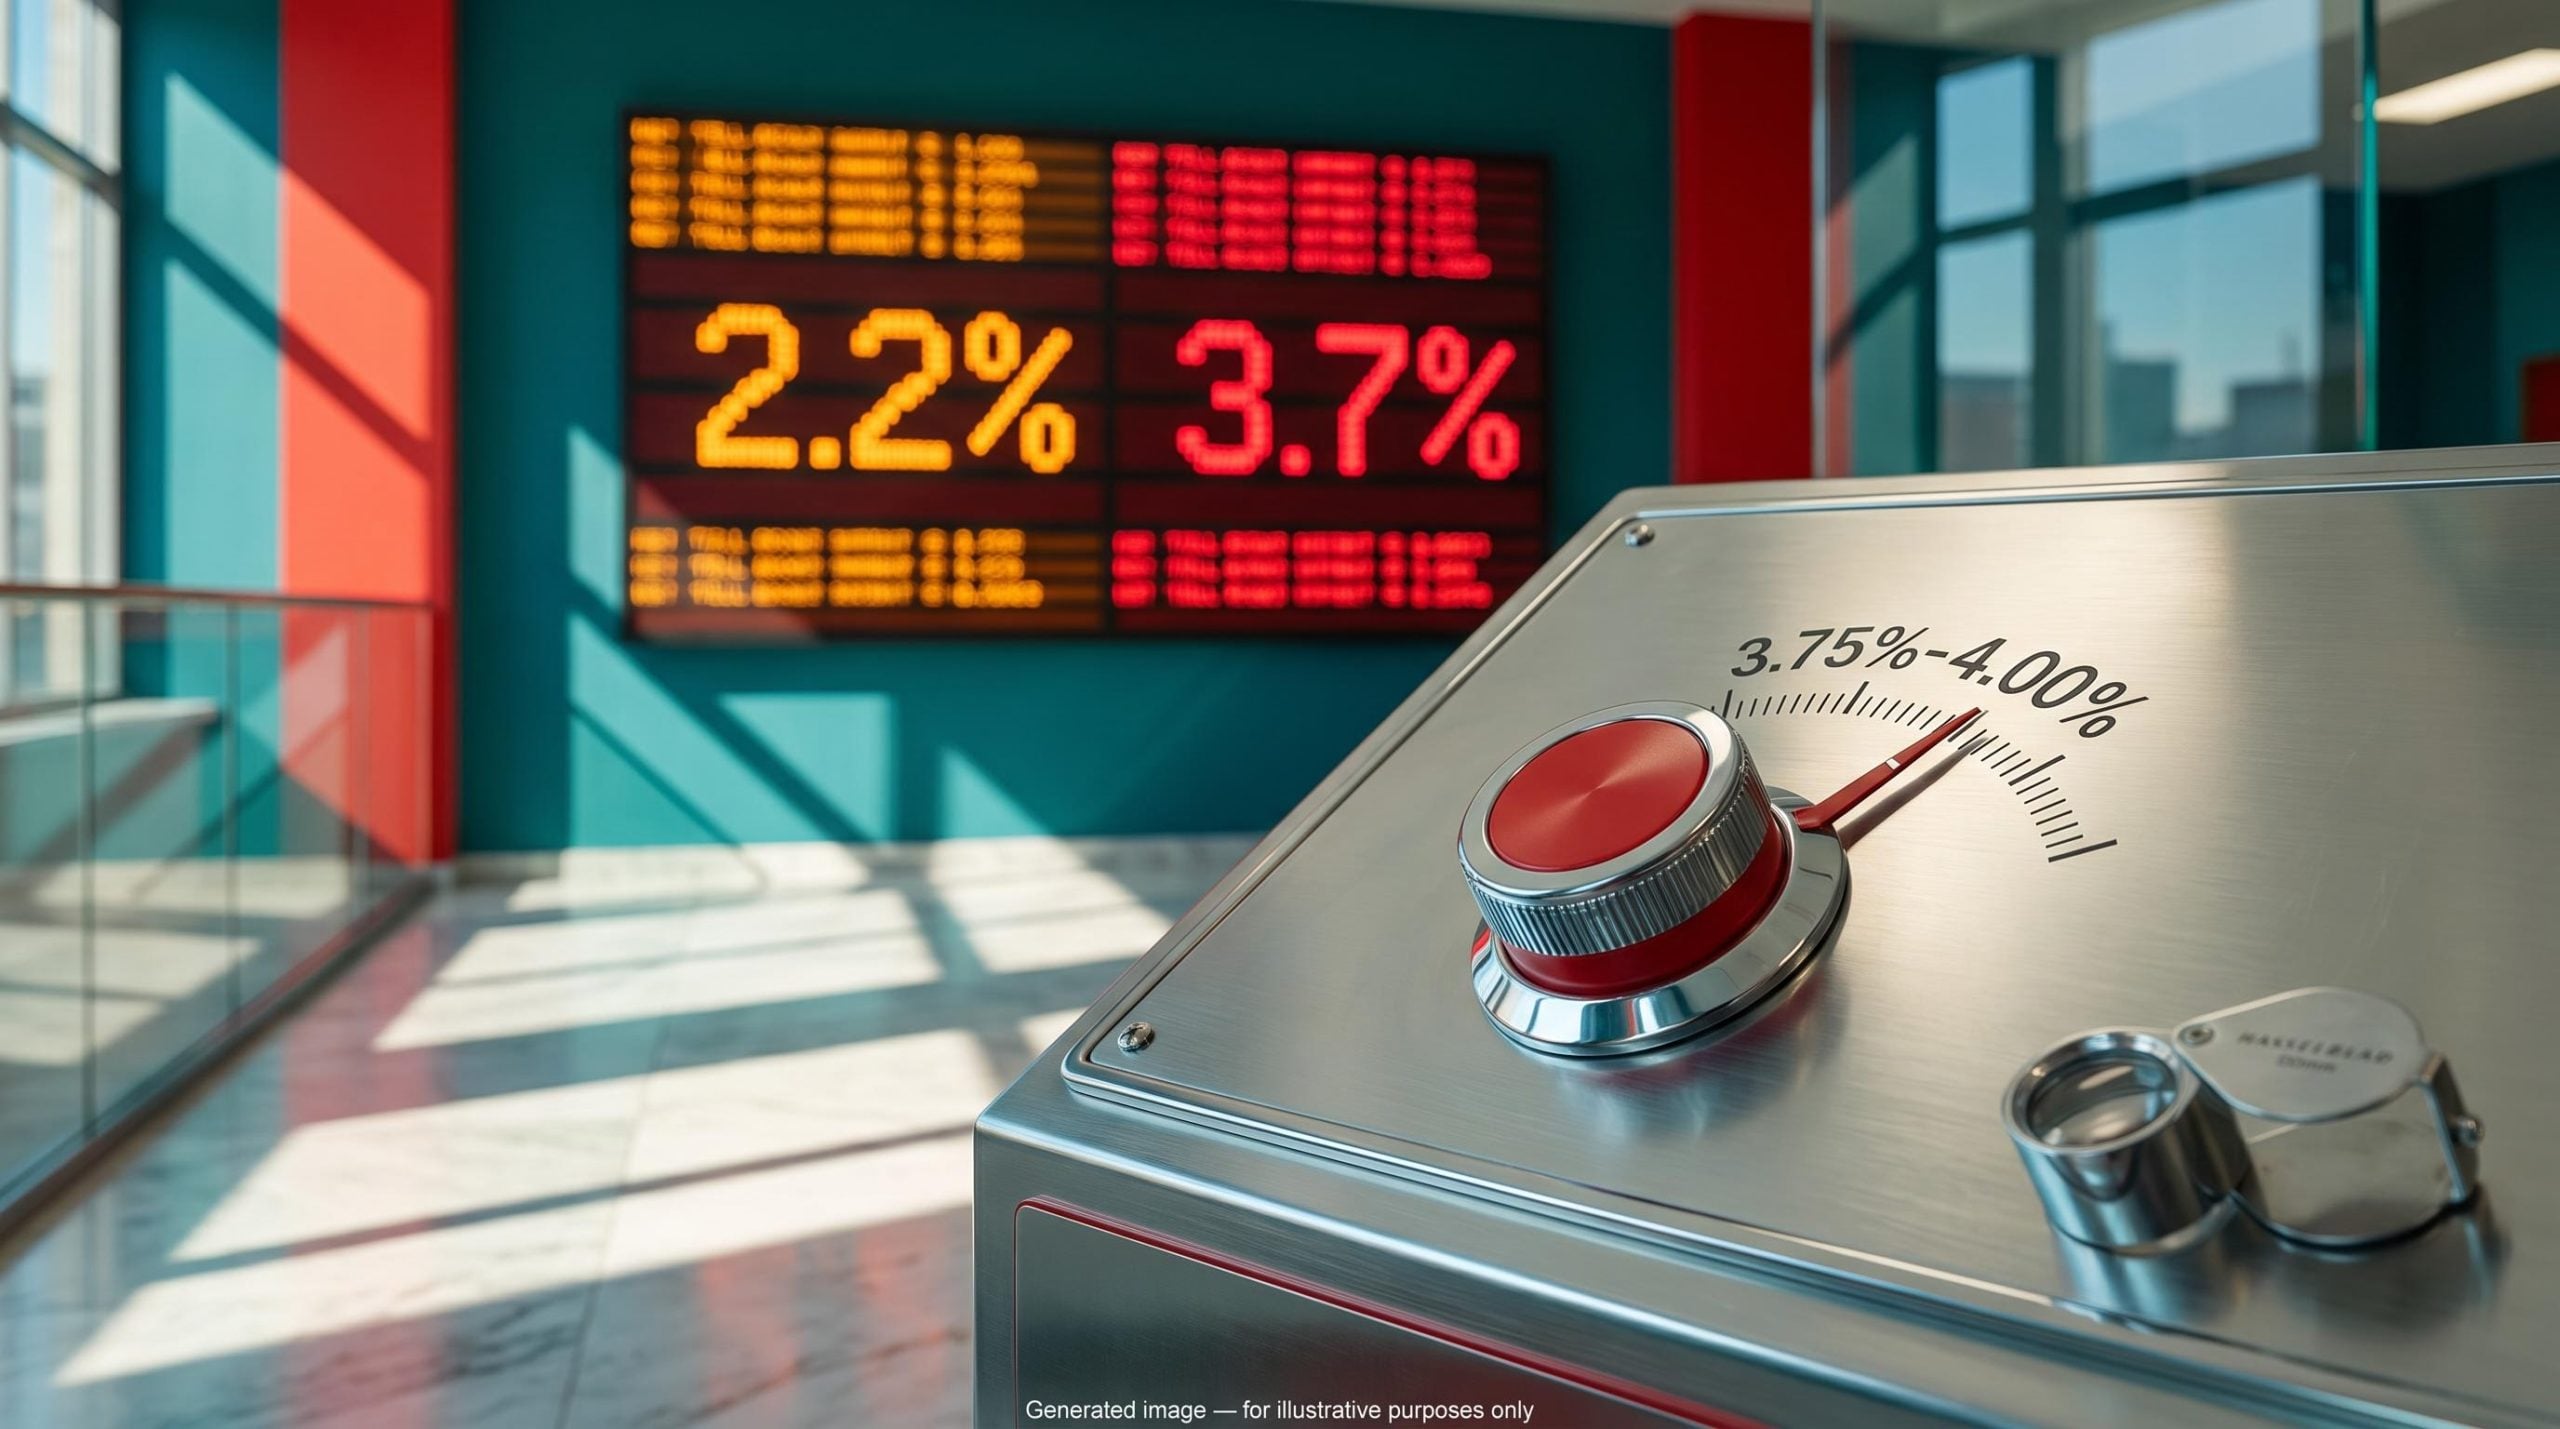
The S&P 500 sits near record highs, yet Rosenberg argues that the average and median US stock are down almost 20%. If he is right, the headline number may be hiding a stock market bubble in which a handful of giants carry an index that most companies are no longer helping to lift.
Rosenberg says he has not seen this many imbalances and extremes in his 40-year career. Ray Dalio and Paul Tudor Jones share parts of his concern. Howard Marks of Oaktree does not.
The question for you is what you risk by trusting the index level alone. Data as of mid-to-late October 2026 suggest the risk is larger than the headline implies.
This piece gives you a working method for reading breadth, valuation and household-exposure signals. It also shows where the 1990s comparison holds, and where it breaks.
Why does the index look healthy while the typical stock does not?
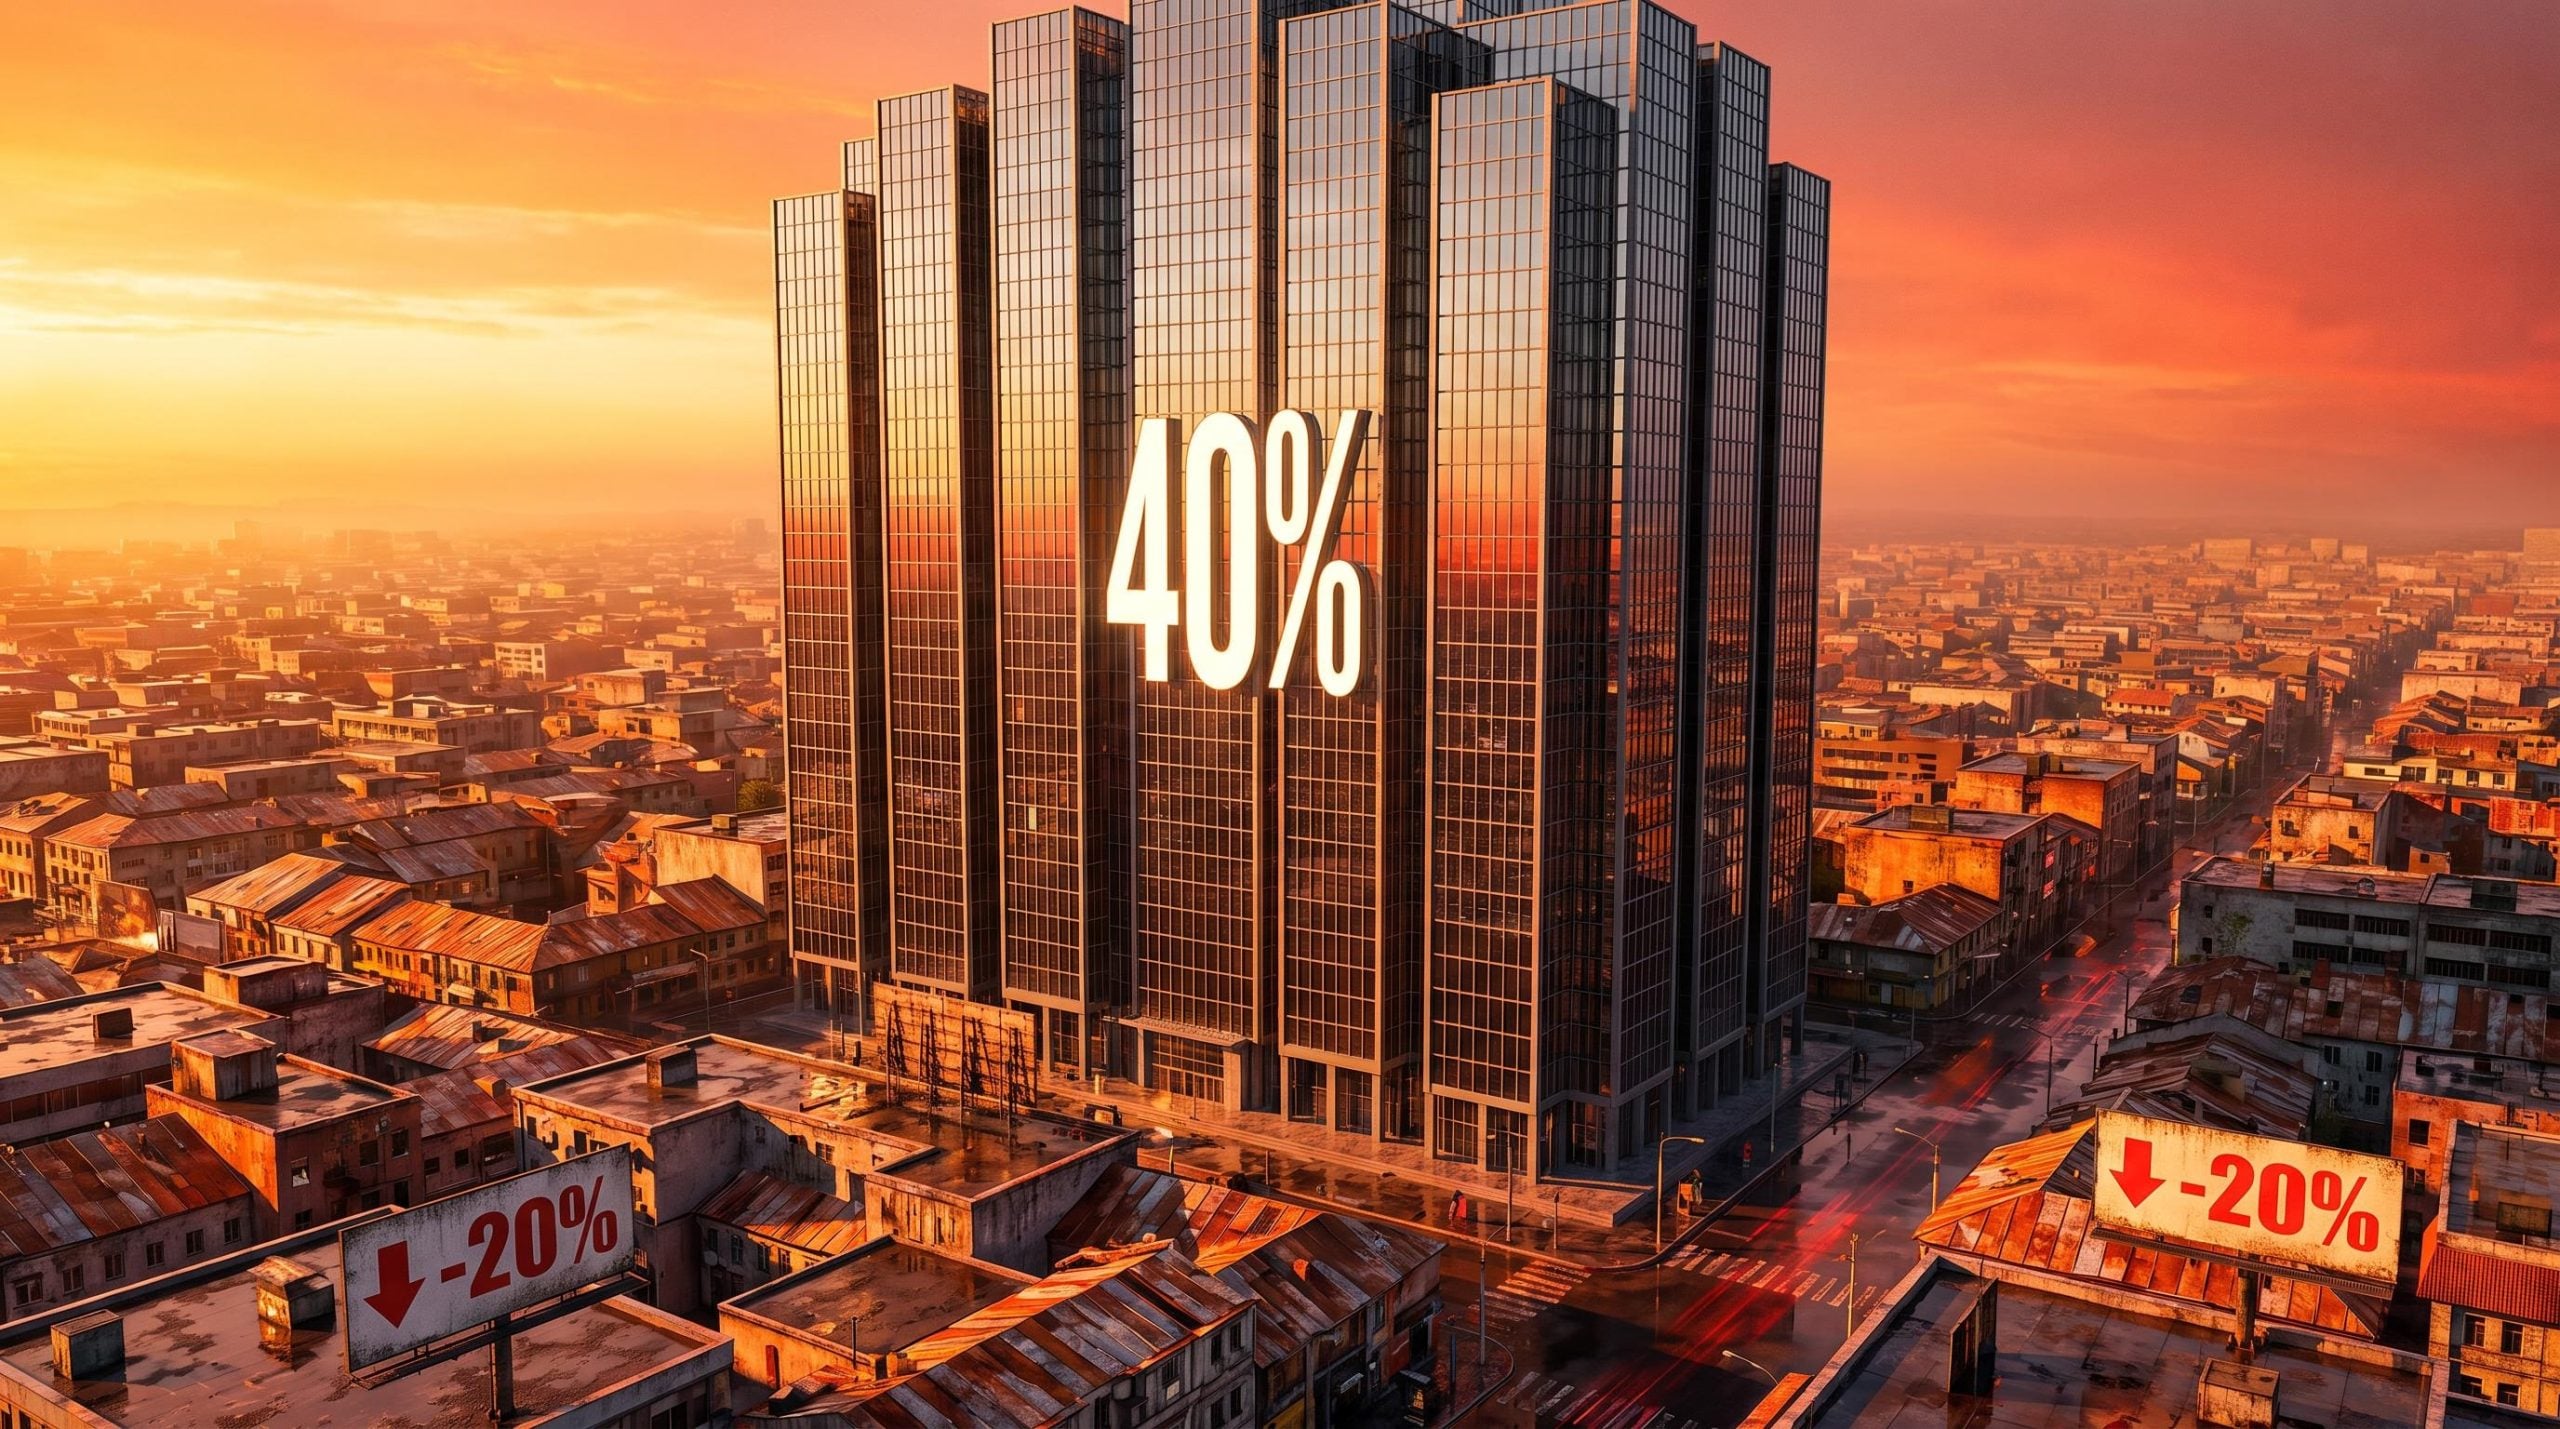
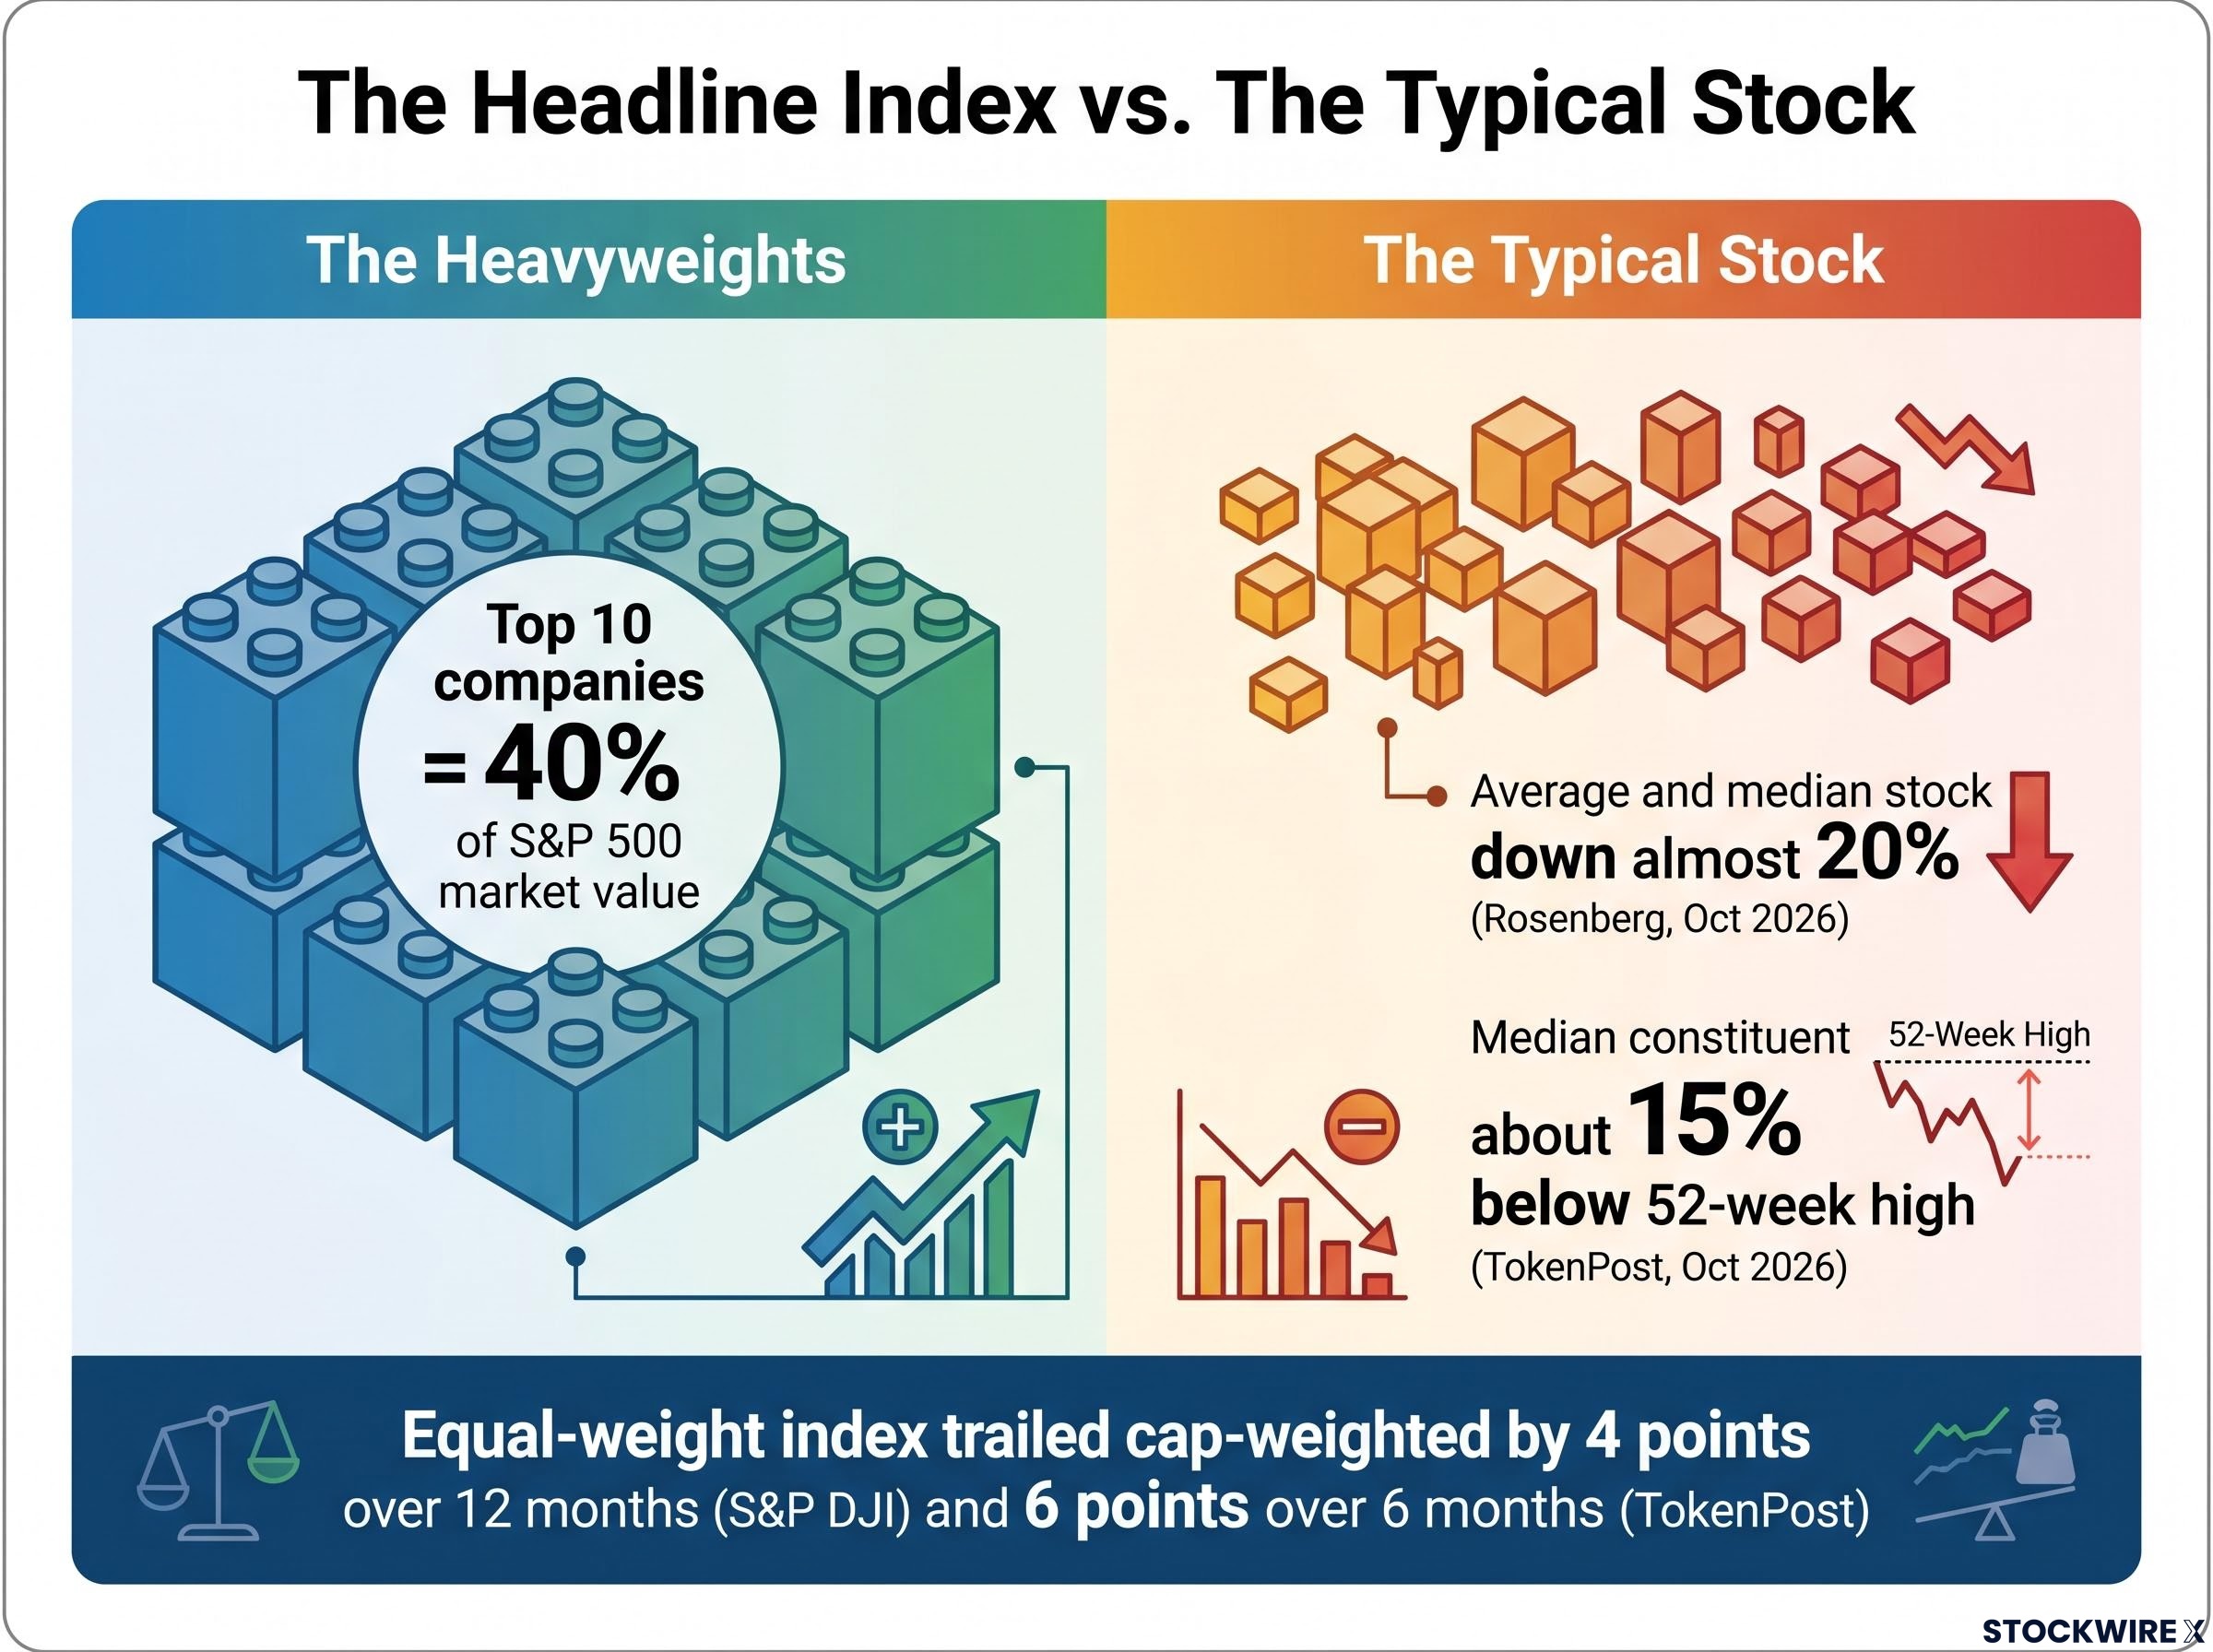
Start with the weighting. Ten companies now account for roughly 40% of the S&P 500’s market value, according to Bloomberg and S&P Dow Jones Indices data cited by The Daily Economy.
Then look at what happens when every stock counts equally. The equal-weight S&P 500 trailed the cap-weighted version by about 4 percentage points over the 12 months through September 2026, S&P DJI reports. TokenPost puts the gap at about 6 points over six months. S&P DJI adds that sector composition played a part, because the equal-weight index holds less technology and more small communications names.
The typical stock tells a weaker story still:
- Average and median stock: down almost 20% (Rosenberg, October 2026)
- Median constituent: about 15% below its 52-week high (TokenPost, 17 October 2026)
- New lows versus new highs: more constituents making new lows (CNBC, 15 October 2026)
- Constituents in a bear market: about 40%
The two declines differ because they measure different things, so treat them as a range, not a contradiction.
Rosenberg on the current cycle He says he has not seen so many imbalances, divergences and extremes in markets and the economy across his 40-year career.
CNBC reports that Goldman Sachs sees breadth as the weakest since the dot-com era. Weak breadth warns about participation, though; it does not prove a bubble on its own. If you own an S&P 500 index fund, your result leans heavily on a few AI-linked names, so the headline return tells you little about how the typical company is faring.
Weak participation shows up in more than one gauge: only about a quarter of index members sit above their 50-day average, a market breadth breakdown that has repeatedly failed as a timing tool even while it flags fragile leadership.
When big ASX news breaks, our subscribers know first
How to read CAPE, the equity risk premium and the rate backdrop (educational)
Narrow leadership raises an obvious follow-up: are the leaders, and the market, simply too expensive? Two gauges carry most of Rosenberg’s valuation case.
| Indicator | Current reading | What it signals | Key caveat |
|---|---|---|---|
| Shiller CAPE | 40.7 (October) | Lower long-horizon returns | Not a timing tool |
| Forward P/E | 19.0× (FactSet) to 19.4× (Carson Group) | Price paid for expected earnings | Forecasts can run optimistic in a boom |
| 10-year Treasury yield | About 5.07% (19 October close) | The competing safe return | Hit 5.27%-5.29% earlier in October |
| Equity risk premium | Negative, per Rosenberg | Little reward for owning stocks over bonds | Depends on inputs chosen |
What CAPE can and cannot tell you
The cyclically adjusted price-to-earnings ratio (CAPE) divides the index price by the average of ten years of inflation-adjusted earnings. Because it smooths a decade of profits, it moves slowly and shifts with accounting changes, buybacks and sector mix.
Robert Shiller’s October reading was 40.7, and the ratio has held above 40 since May 2026. The November 1999 peak was about 44.2. Rosenberg recalls that in 2001 the Nasdaq fell about 60% and the broader market about 40% despite a very mild recession.
Yet CAPE has stayed above 40 for months without marking a top. For you, a reading this high is a reason to expect weaker returns over the next decade, not a signal to time an exit.
The CAPE ratio was built to frame decade-ahead returns, and investors who treated it as an exit signal in the late 1990s missed years of gains before the March 2000 peak.
Why the equity risk premium depends on your inputs
The equity risk premium (ERP) is the earnings yield on stocks minus a Treasury yield. It shows how much extra return you are paid for taking equity risk.
Rosenberg sets an implied earnings yield of about 2.5% against a real long Treasury yield above 3%, giving a negative premium, after calling it zero in April 2026. Swap in a nominal 10-year yield or a duration-matched rate, or rely on optimistic forward earnings, and the result moves. His conclusion stands or falls on those choices.
Are households and consumers the weak link under the market?
Valuation alone does not damage an economy. Ownership does, and here the reassuring picture comes first: rising paper wealth has helped American households keep spending.
The scale of that ownership depends on which number you trust.
| Source | Figure | What it measures | Caveat |
|---|---|---|---|
| Rosenberg, citing Fed flow-of-funds | 73% equities, about 7% bonds | Record equity share of household financial assets | Likely a narrower definition |
| Fed Z.1 (released 11 September 2026) | 48.23% in Q2 2026 | Direct and indirect equities: $74.0 trillion of about $153.5 trillion | Measures exposure, not leverage |
Do not treat the two as the same statistic. Either way, the exposure is large, and Rosenberg says boomers hold about 55% in equities against the roughly 35% he thinks suits their age.
The turn comes in how that wealth feeds spending. High-income households own most equities and drive discretionary purchases, and Rosenberg argues they are funding it through portfolio gains and lower saving rather than income growth:
- Saving rate: Rosenberg says near 4%; the BEA shows 3.0% in July 2026, against a pre-Covid norm of about 8%
- Income versus spending: real disposable income has barely grown over 12 months while spending runs about 2.5%
- Labour income: real labour income fell about 0.5% month over month in September
- Job security: the University of Michigan survey shows fear of job loss near a record
That support can reverse. A falling market could cut spending without a large rise in unemployment first.
Still, hold this loosely. Exposure is not leverage, and a low saving rate does not prove spending is financed by stock sales or borrowing. Rosenberg flagged surging margin debt and low cash in a September Wealthion appearance, but gave no figures. If you are near retirement, check how much of your plan depends on equity prices holding, because the same drawdown could weaken the economy around you.
What happens if AI spending and credit give way?
If households lean on stocks, the economy leans on AI. Rosenberg traces a chain of fragility:
- Concentration: about 40% of the index sits in ten companies
- Wealth effect: those gains support affluent spending
- AI capex: data centre building carries business investment
- Debt: much of that building is borrowed
- Interest rates: high yields raise financing costs and the discount on distant AI profits
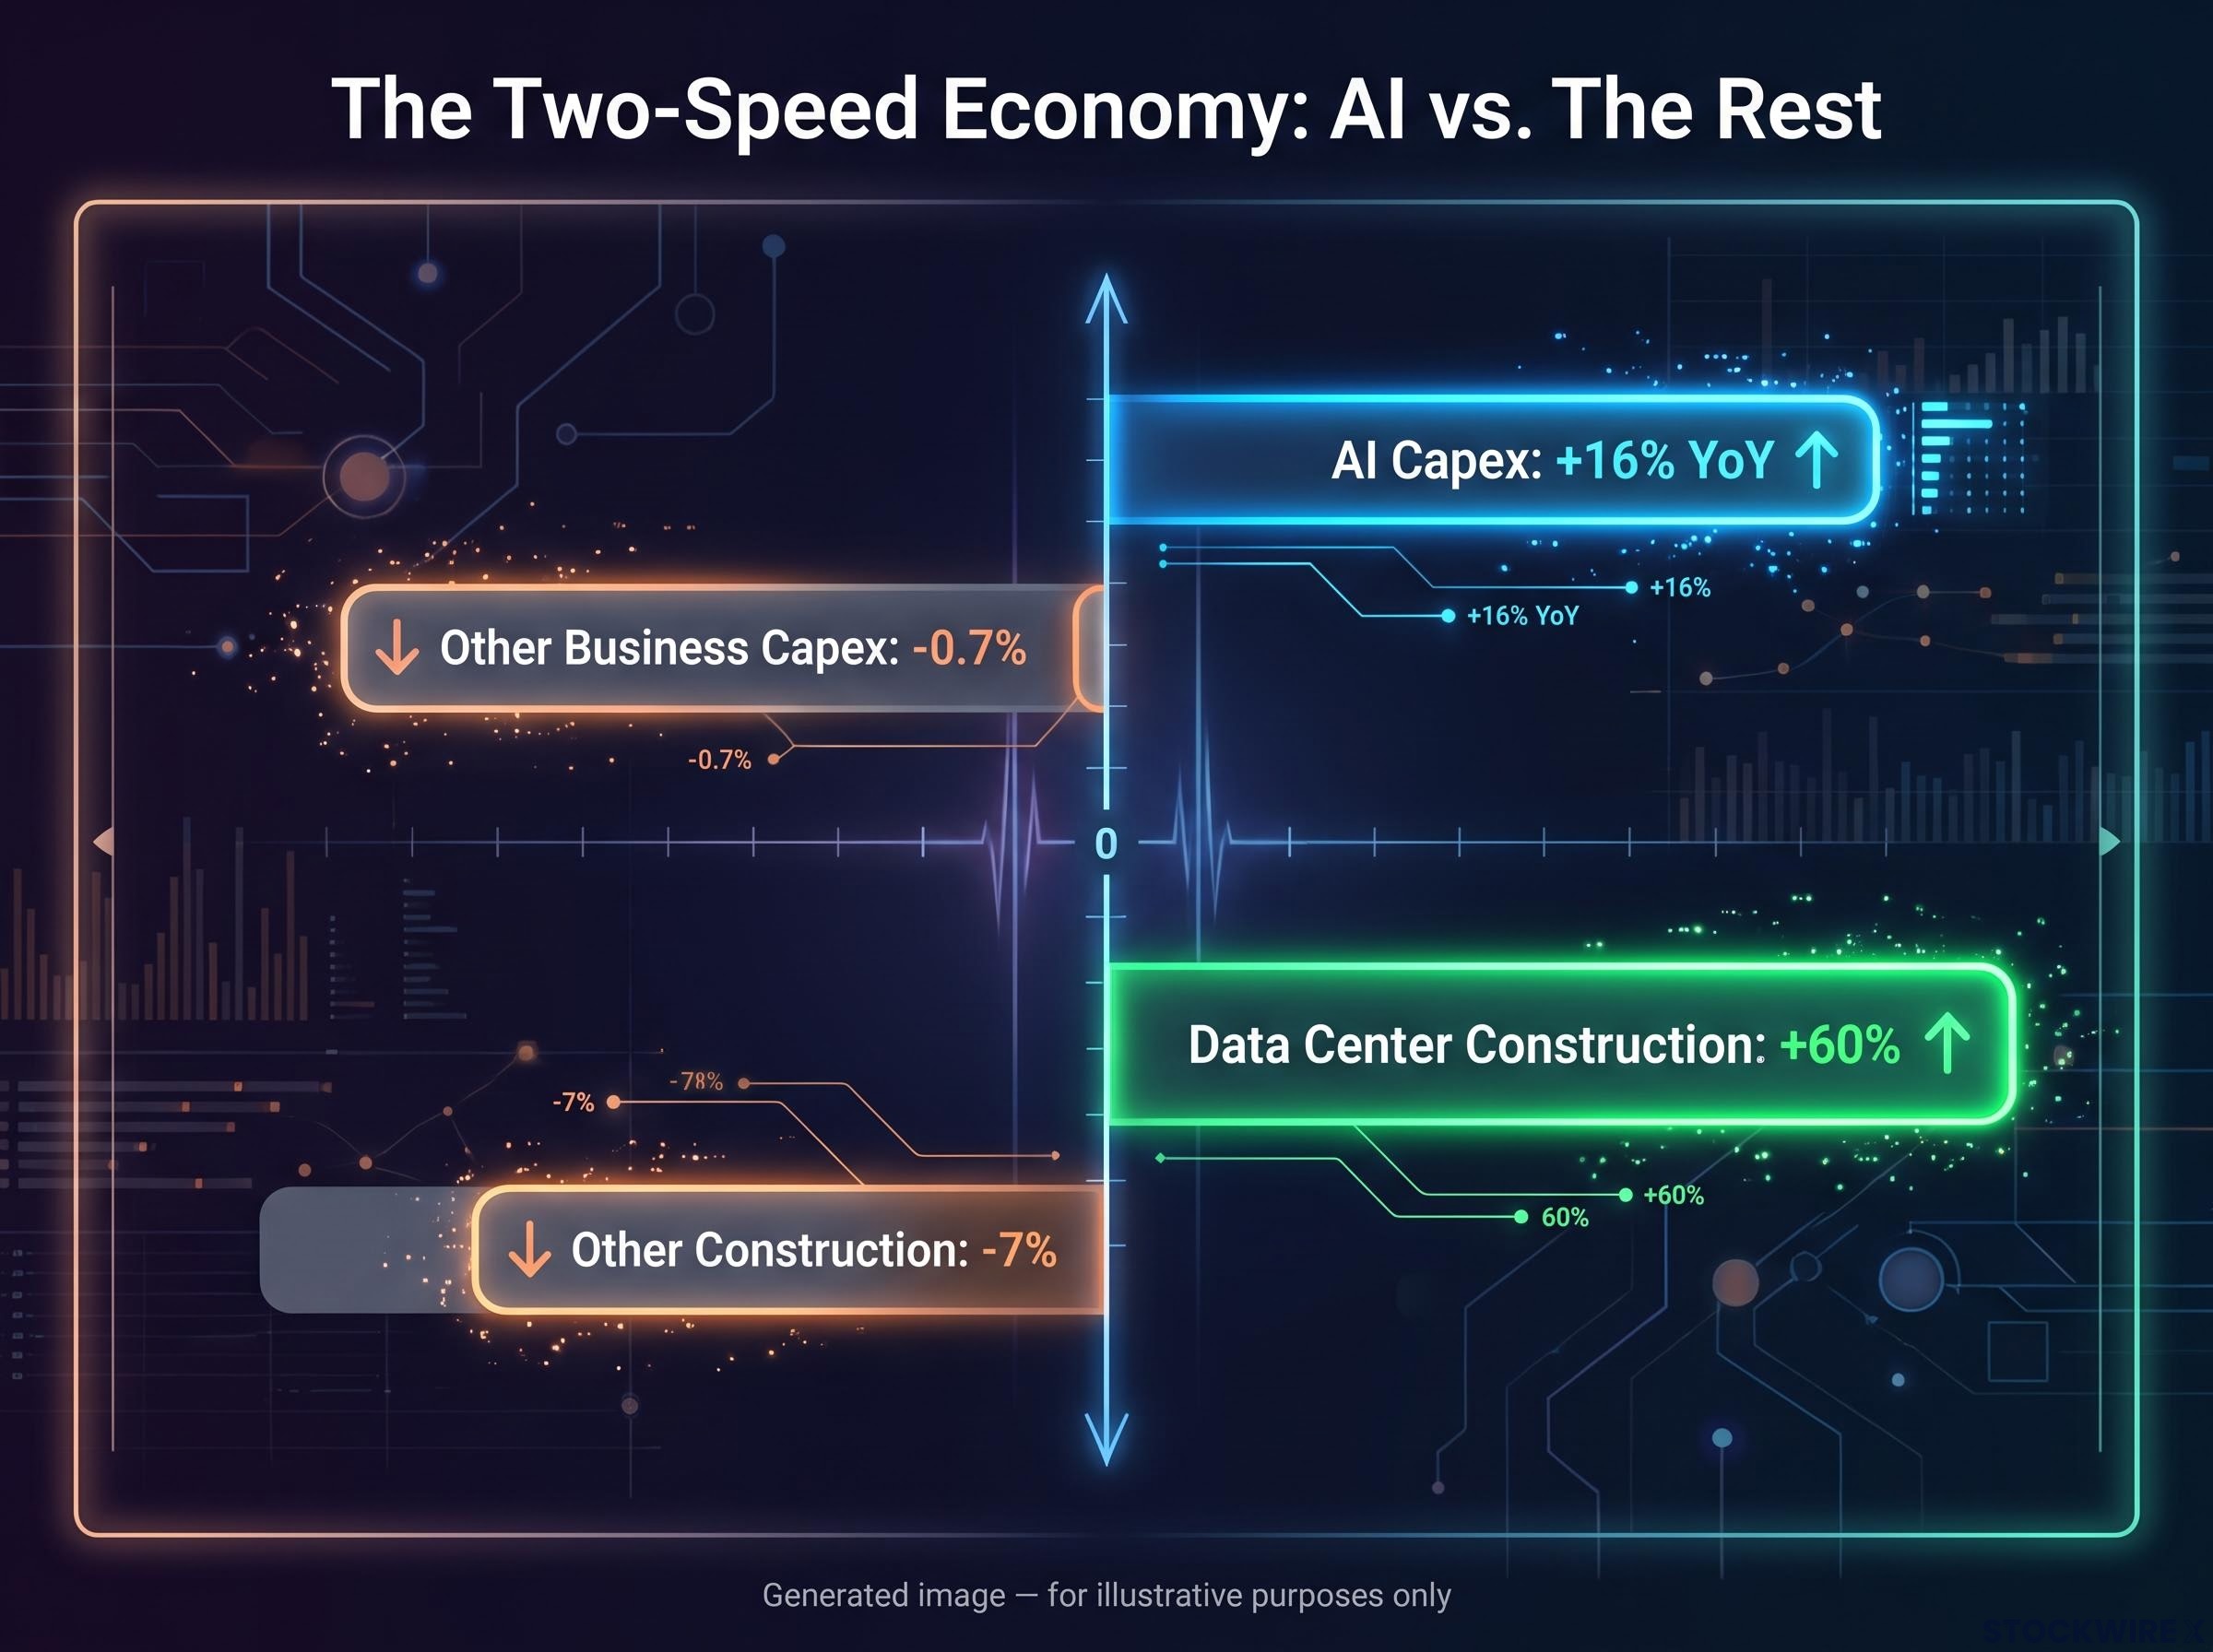
He calls it a one-trick-pony economy. By his figures, AI capex is up over 16% year over year while other business capex is down about 0.7%, and data centre construction is up over 60% while other construction fell 7%. No independent official totals confirm these splits. Real GDP runs barely above 2% with employment growth near 0.4%, against about 5% and 2.5% in the late 1990s.
The debt link is where stress has surfaced. Reuters reported on 15 October 2026 that Oracle’s five-year credit default swaps (CDS), the cost of insuring its debt against default, widened to a record 288 basis points. Oracle has reportedly issued about $118 billion of long-term debt plus $39 billion of other obligations.
Reported borrowing may understate the strain, since hyperscalers carry roughly $700 billion of debt but more than $2.6 trillion in binding off-balance-sheet obligations, a gap that matters as free cash flow turns negative.
CoreWeave’s default pricing CDS above 1,000 basis points on nearly $50 billion of debt (LSEG) implied roughly a 63% five-year default probability, up from about 30% a year earlier, per Reuters.
Later reporting put CoreWeave CDS near 1,200 basis points, with some bonds yielding 15%-16%. Rosenberg likens these signals to New Century Financial in 2007.
Why credit stress is not yet a sector verdict
Widening spreads show financing strain. They do not show that Nvidia, Microsoft, Alphabet or the broader index carry similar default risk.
Rosenberg expects 2027 props to fade: a one-off fiscal boost, gridlock after the 3 November midterms and data centre cancellations, for a drag of about 1.3 points as he put it. He told CNBC on 14 October that recession odds are 50/50. Whether you own AI leaders directly or through a fund, watch whether funding costs for AI infrastructure keep rising, since that is where a slowdown would show first.
Does the 1990s comparison hold up?
The fragility chain invites the obvious analogy. The strongest case for it is real, but it fractures in both directions.
| Comparison | Where it holds | Where it breaks |
|---|---|---|
| 1995-2000 | CAPE above 40, narrow leadership, breadth at dot-com lows, extreme positioning | Leaders have real profits and cash flow; growth today is narrow, with weak hiring and negative housing |
| 2007 | Leverage worries; credit risk that looks contained but could spread | 2007 centred on mortgages and banks; today’s risk is corporate and infrastructure debt |
| 2000-2001 outcome | Nasdaq down about 60%, market down about 40% | CAPE above 40 is not a timing rule and can persist |
Rosenberg himself draws a distinction. The 1990s boom was broad across technology, with Microsoft the largest company, plus strong housing and hiring. He also concedes the S&P rose 17% in the year after Jamie Dimon’s bubble remark.
The chart shape matches, but the 1997-2000 parallel weakens on magnitude and multiples: the Nasdaq 100 trades near 25x forward earnings against roughly 58x at the dot-com peak, while S&P top-10 weight already exceeds 1999 levels.
Dalio calls AI a bubble in the traditional sense and warns that borrowing leaves markets vulnerable if rates stay high. Jones, speaking on 13 October, flagged government and AI debt and a potentially hard 2027.
The case against calling it a bubble
Howard Marks, Oaktree Marks says the evidence does not yet establish a bubble, because leading AI firms already have substantial users, revenues, earnings and cash flow, unlike many dot-com companies.
He adds that expensive assets can coexist with genuine progress. The honest reading is that valuation and concentration look like 1999 while the earnings do not, so plan for lower returns and a possible drawdown without assuming an identical collapse.
What a stock market bubble call does and does not change for your portfolio
Rosenberg’s best evidence is a stack: 40% top-ten concentration, an equal-weight deficit, CAPE above 40, heavy household exposure, a thin saving rate and credit stress in AI infrastructure. The best counter is that the leaders earn real money.
That balance justifies a check-up, not a wholesale exit. Review how concentrated your holdings are, how much of your wealth sits in equities and how long you can wait out a drawdown.
Four signals deserve your attention from here:
- Breadth and the equal-weight gap
- Earnings revisions for the largest companies
- AI-linked credit spreads, led by Oracle and CoreWeave
- The household saving rate
This article is for informational purposes only and should not be considered financial advice. Investors should conduct their own research and consult with financial professionals before making investment decisions. Past performance does not guarantee future results, and forward-looking views cited here are speculative and subject to change.