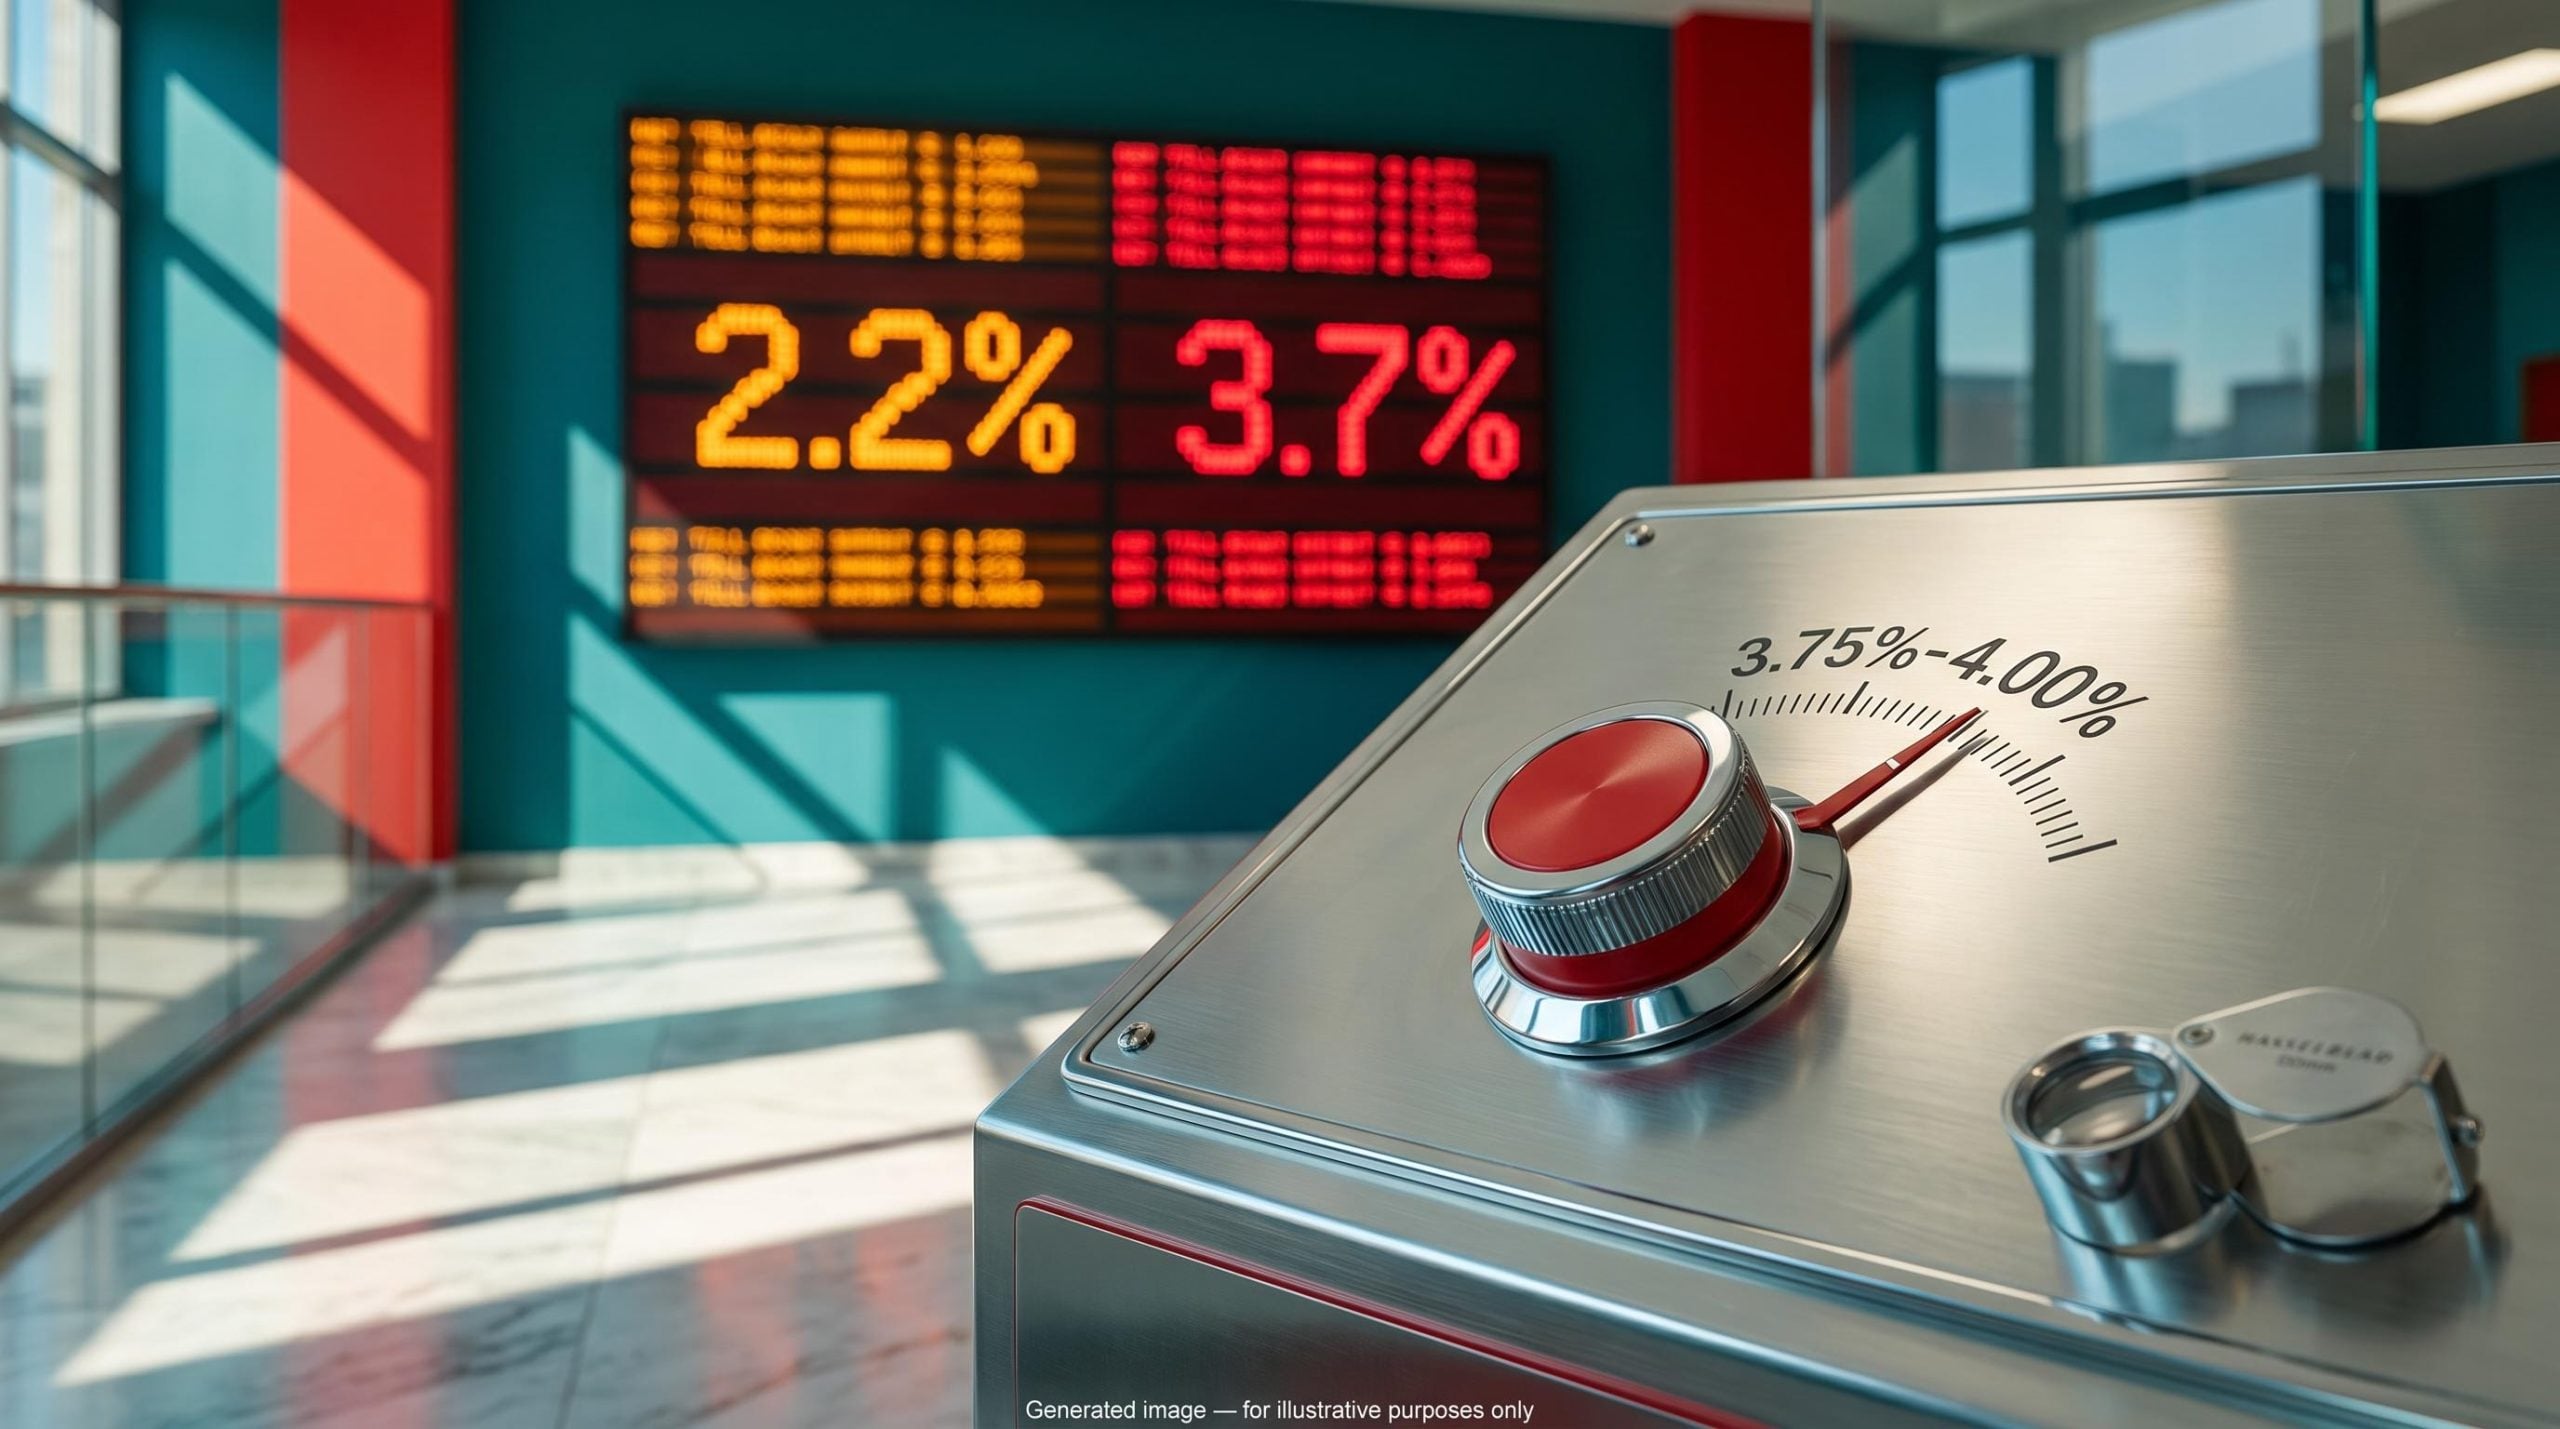
The Federal Reserve under Kevin Warsh has lifted its target range to 3.75%-4.00%, while the Dallas Fed trimmed-mean PCE inflation measure sits at 2.2%. Headline CPI is running at 3.7%. Those numbers tell two different stories about inflation, and the Fed rate hike under Warsh only makes sense if you believe the second one.
The September 2026 hike was Warsh’s first as chair and the first Fed increase since 2023. The next Federal Open Market Committee (FOMC) meeting runs 27-28 October, a week from now.
David Rosenberg, president of Rosenberg Research, argues the Fed is hiking into a supply shock with a flat yield curve and weak growth. If he is right, investors who have built bond and equity positions around a demand-inflation story could be holding the wrong assets at the wrong moment.
This piece gives you three tools: a way to tell supply inflation from demand inflation, the duration arithmetic behind a Treasury tilt, and the strongest case against Rosenberg’s trade.
Why Rosenberg thinks the Fed is hiking into the wrong kind of inflation
Start with the headline numbers. PCE inflation ran at 3.4% year on year through August. PCE stands for personal consumption expenditures, the Fed’s preferred price gauge. September CPI came in at 3.7%, up from 3.4% in August.
Now strip out the volatile items. Core PCE drops to 3.0% and core CPI to 2.6%. The Dallas Fed trimmed mean removes the most extreme price moves at both ends each month, and it falls further to 2.2%, down from 2.9% a year earlier.
| Measure | Latest reading |
|---|---|
| Headline CPI (September) | 3.7% y/y |
| Headline PCE (August) | 3.4% y/y |
| Core PCE (August) | 3.0% y/y |
| Core CPI (September) | 2.6% y/y |
| Dallas Fed trimmed-mean PCE (August) | 2.2% y/y |
The deeper you look, the cooler inflation gets.
The August PCE data showed core prices rising just 0.2% on the month against a 0.3% forecast, yet the Fed’s own projections still do not see a return to 2% until 2029, which explains why one soft print has not changed the direction.
Rosenberg adds detail. He puts core goods inflation at about 0.7% and attributes the rest to four supply shocks: Covid supply chains, Russia-Ukraine, tariffs and the US-Iran war. He cites a tariff rate of about 13%. Penn Wharton measured an effective collected rate of 7.1% for August, but the two figures rest on different measures.
Then there is Warsh’s own record. In May he described the trimmed-average trend as “quite favorable.” He also said this:
Kevin Warsh, Federal Reserve Chair “Inflation is a choice, and the Fed must take responsibility for it.”
Rosenberg argues Warsh now sets aside the trimmed mean he once favoured. The backdrop is what makes that risky. Rosenberg says the gap between two-year and ten-year yields (the 2s10s spread) was barely over 30 basis points when hikes began, against a typical 120. He also puts the GDP run rate near 2%, against a typical 4%.
He points to a pattern with new chairs: they tend to hike first and face a crisis within 12-18 months, as Alan Greenspan did in 1987. In 2008, inflation neared 6% with oil around $150, then fell to roughly -2% a year later.
Pricing remains split. CME FedWatch implied about a 15% chance of an October hike and about 89.5% for December. Rosenberg says markets price roughly four hikes in total. Warsh, at an IMF event on 16 October, offered no clues: “I don’t prejudge meetings.”
If the trimmed mean is the truer read, the Fed is tightening against inflation it cannot reach. Rate hikes cannot lower tariffs or oil prices. That is why Rosenberg treats growth, not prices, as the variable to position around.
What Rosenberg admits he got wrong before
Rosenberg was in the transitory camp in 2021-2023 and misjudged how far price rises would feed into wages. He now argues that surge was half fiscal policy and wage response. This time, he says, a softer labour market limited tariff pass-through to about 25%. Whether that distinction holds is the whole bet.
When big ASX news breaks, our subscribers know first
Supply shock or demand inflation: the framework and the duration math behind it
Every inflation print raises the same question: what is pushing prices up, and can interest rates do anything about it?
Three ways a price shock can behave
- Pure supply shock. Tariffs or an oil disruption raise prices and cut real household income. Hikes cannot produce oil or remove a tariff. Implication for you: this setting tends to favour duration and defensives.
- Supply shock with second-round effects. Higher prices spark wage demands and broader increases. Tighter policy can break that loop. Implication: long bonds are riskier.
- Demand plus supply. Strong fiscal spending, credit or hiring coincides with the shock. Implication: this is the strongest case for more hikes and shorter duration.
Rosenberg and Jeffrey Gundlach of DoubleLine emphasise the first case. Warsh and the more hawkish voices lean towards the second and third.
The duration math in one example
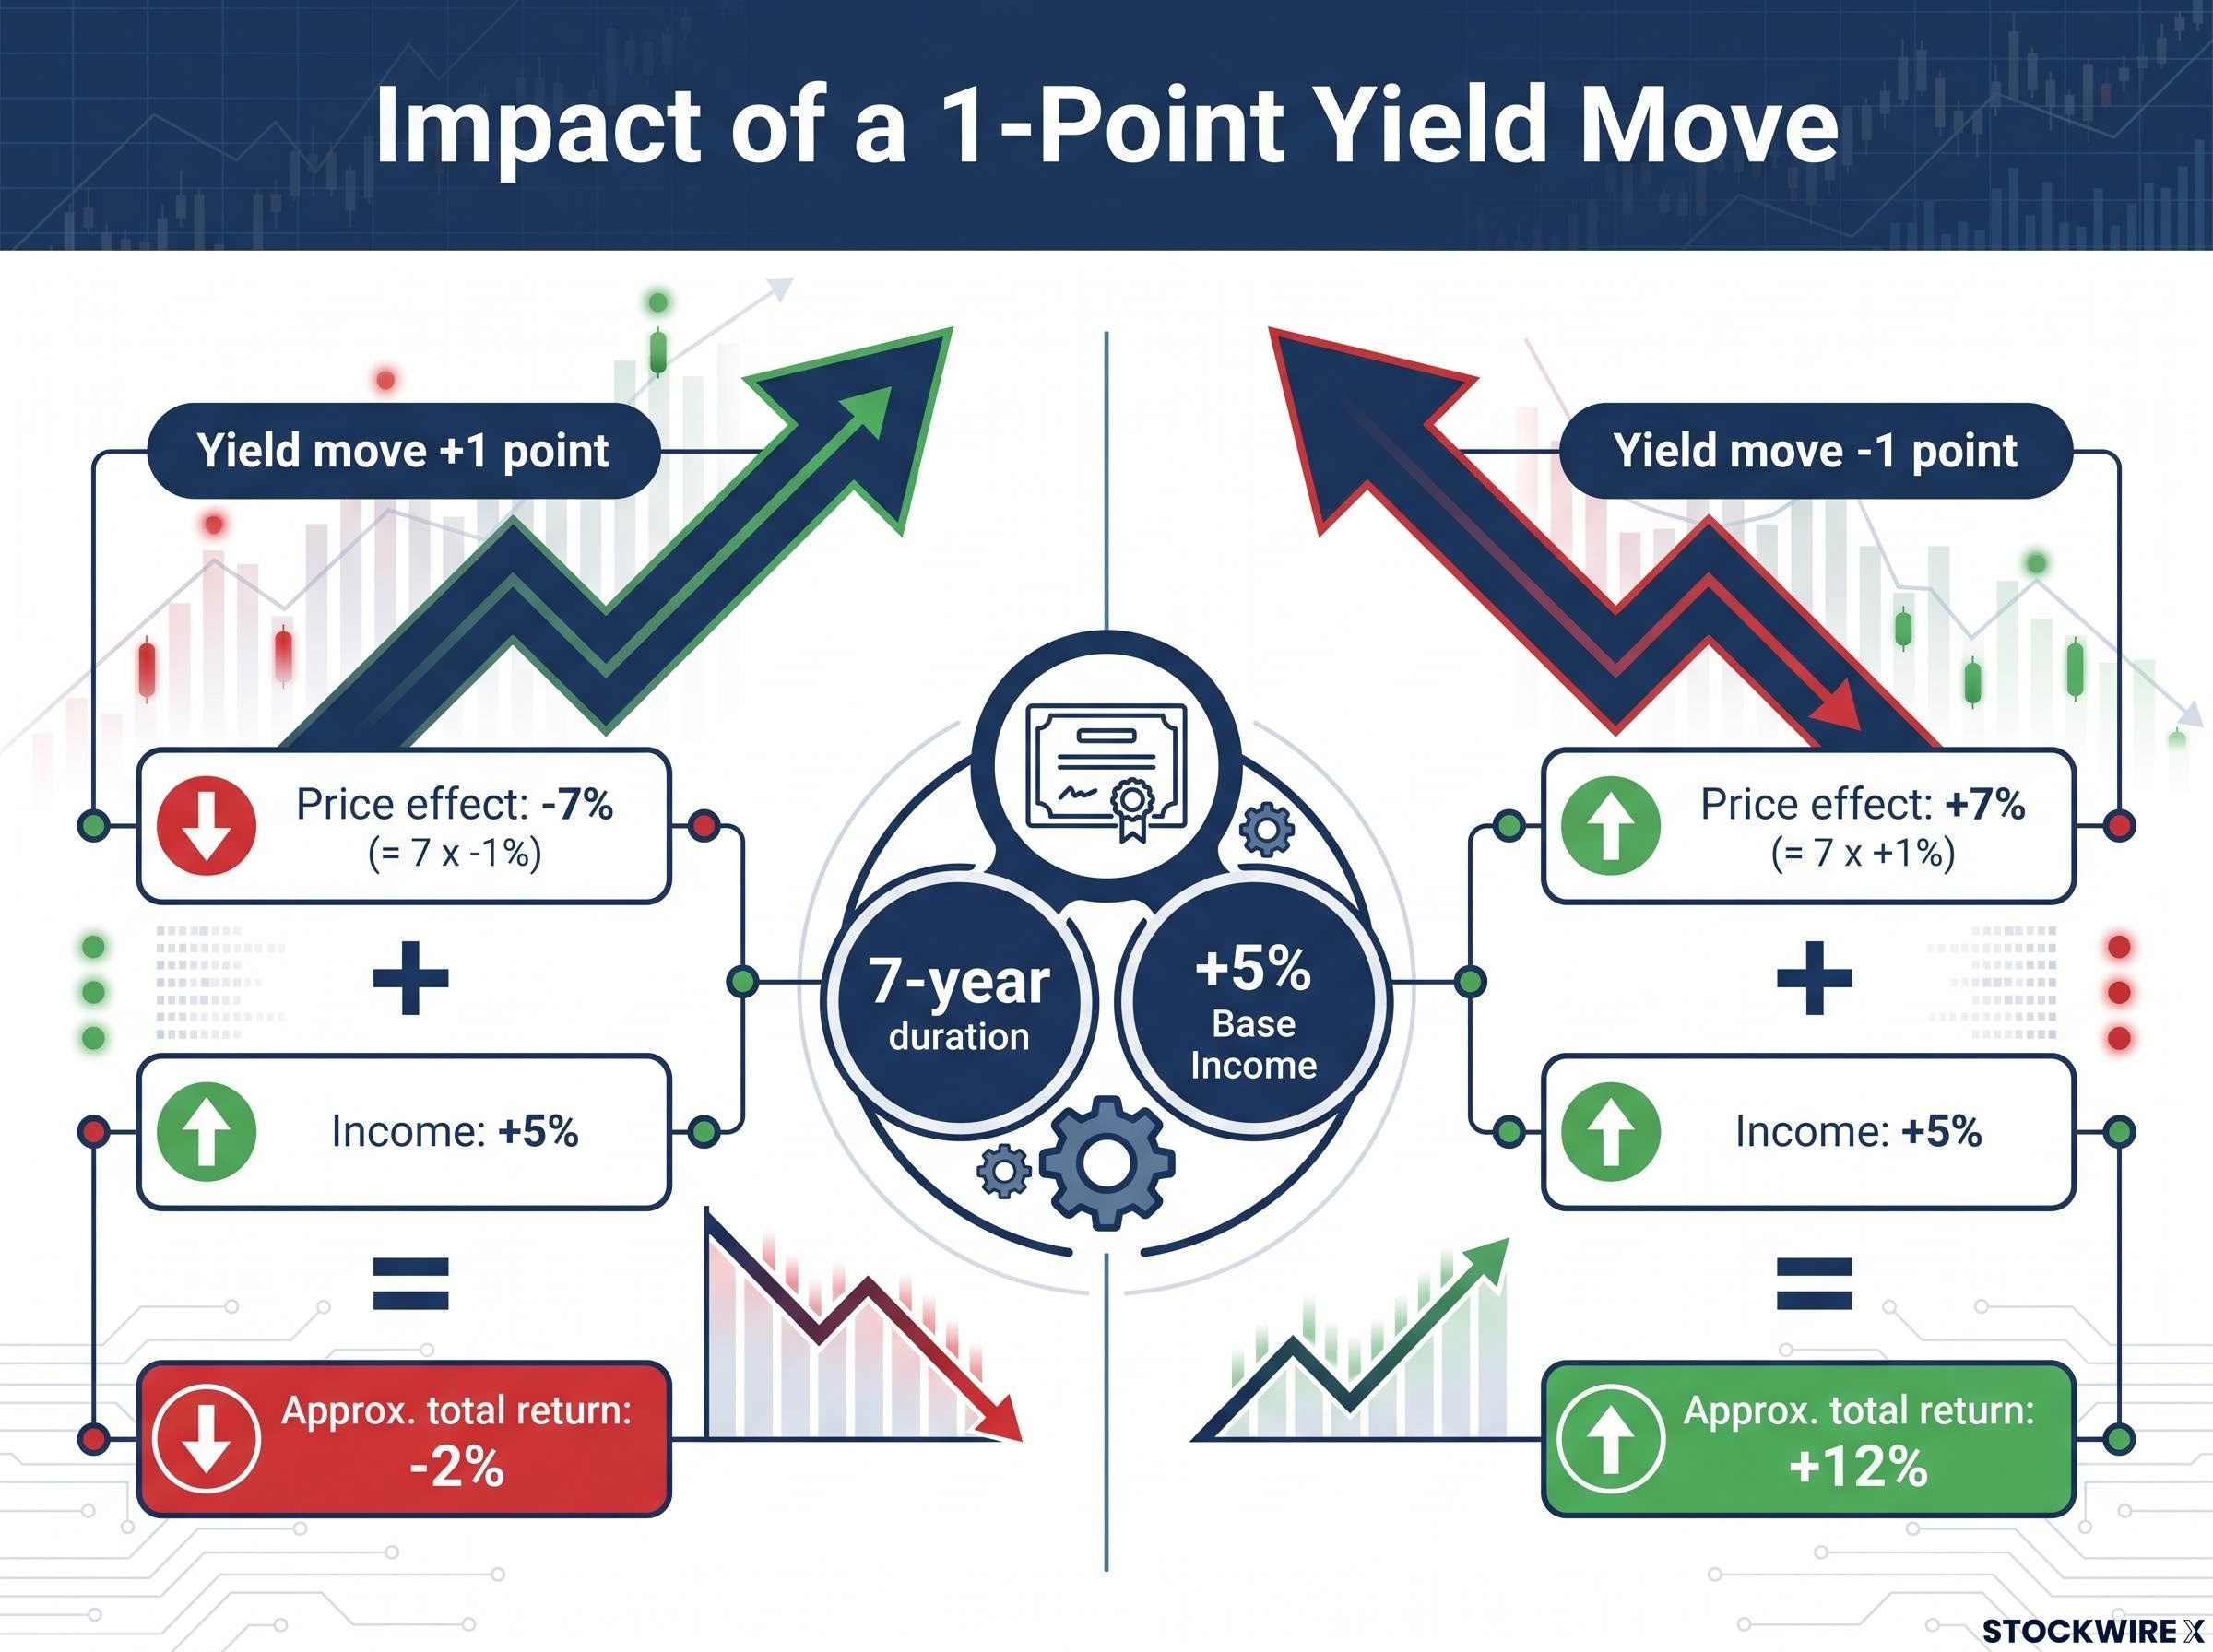
Modified duration measures how sensitive a bond’s price is to a change in yield. In plain terms, the price change roughly equals negative duration times the yield change. A bond with a duration of seven years loses about 7% if yields rise one percentage point and gains about 7% if they fall one point.
Modified duration is the single fund-sheet figure that converts a yield forecast into a dollar loss, which is why the same ten-year position can look like a hedge to one investor and a liability to another.
Add income at a 5% yield and the payoff is lopsided:
| Yield move | Price effect | Income | Approx. total return |
|---|---|---|---|
| +1 point | -7% | +5% | -2% |
| -1 point | +7% | +5% | +12% |
These figures exclude convexity, the effect that slightly cushions losses and boosts gains. Rosenberg runs the same logic on the ten-year Treasury. By his estimate, yields would need to reach about 6% for a zero total return over 12 months. He also argues more than 60% of the rise in yields reflects reset Fed expectations rather than inflation or debt.
BlackRock reached a similar conclusion in July. Its analysis found that even a 100 basis point hike could leave one-year broad bond returns modestly positive, with yields needing to climb another 75-80 basis points before returns turned negative.
A high starting yield cushions losses, but it does not remove mark-to-market risk. That means the same Treasury position can be a sound hedge or a painful bet, depending on which of the three mechanisms is actually operating.
How Rosenberg is positioning: Treasuries, a bull steepener, defensives, gold and cash
Rosenberg’s core move is to reduce exposure to the S&P 500’s swings in favour of Treasuries and defensives. He is not selling everything. He says one hike is survivable, but four or five could break the economy.
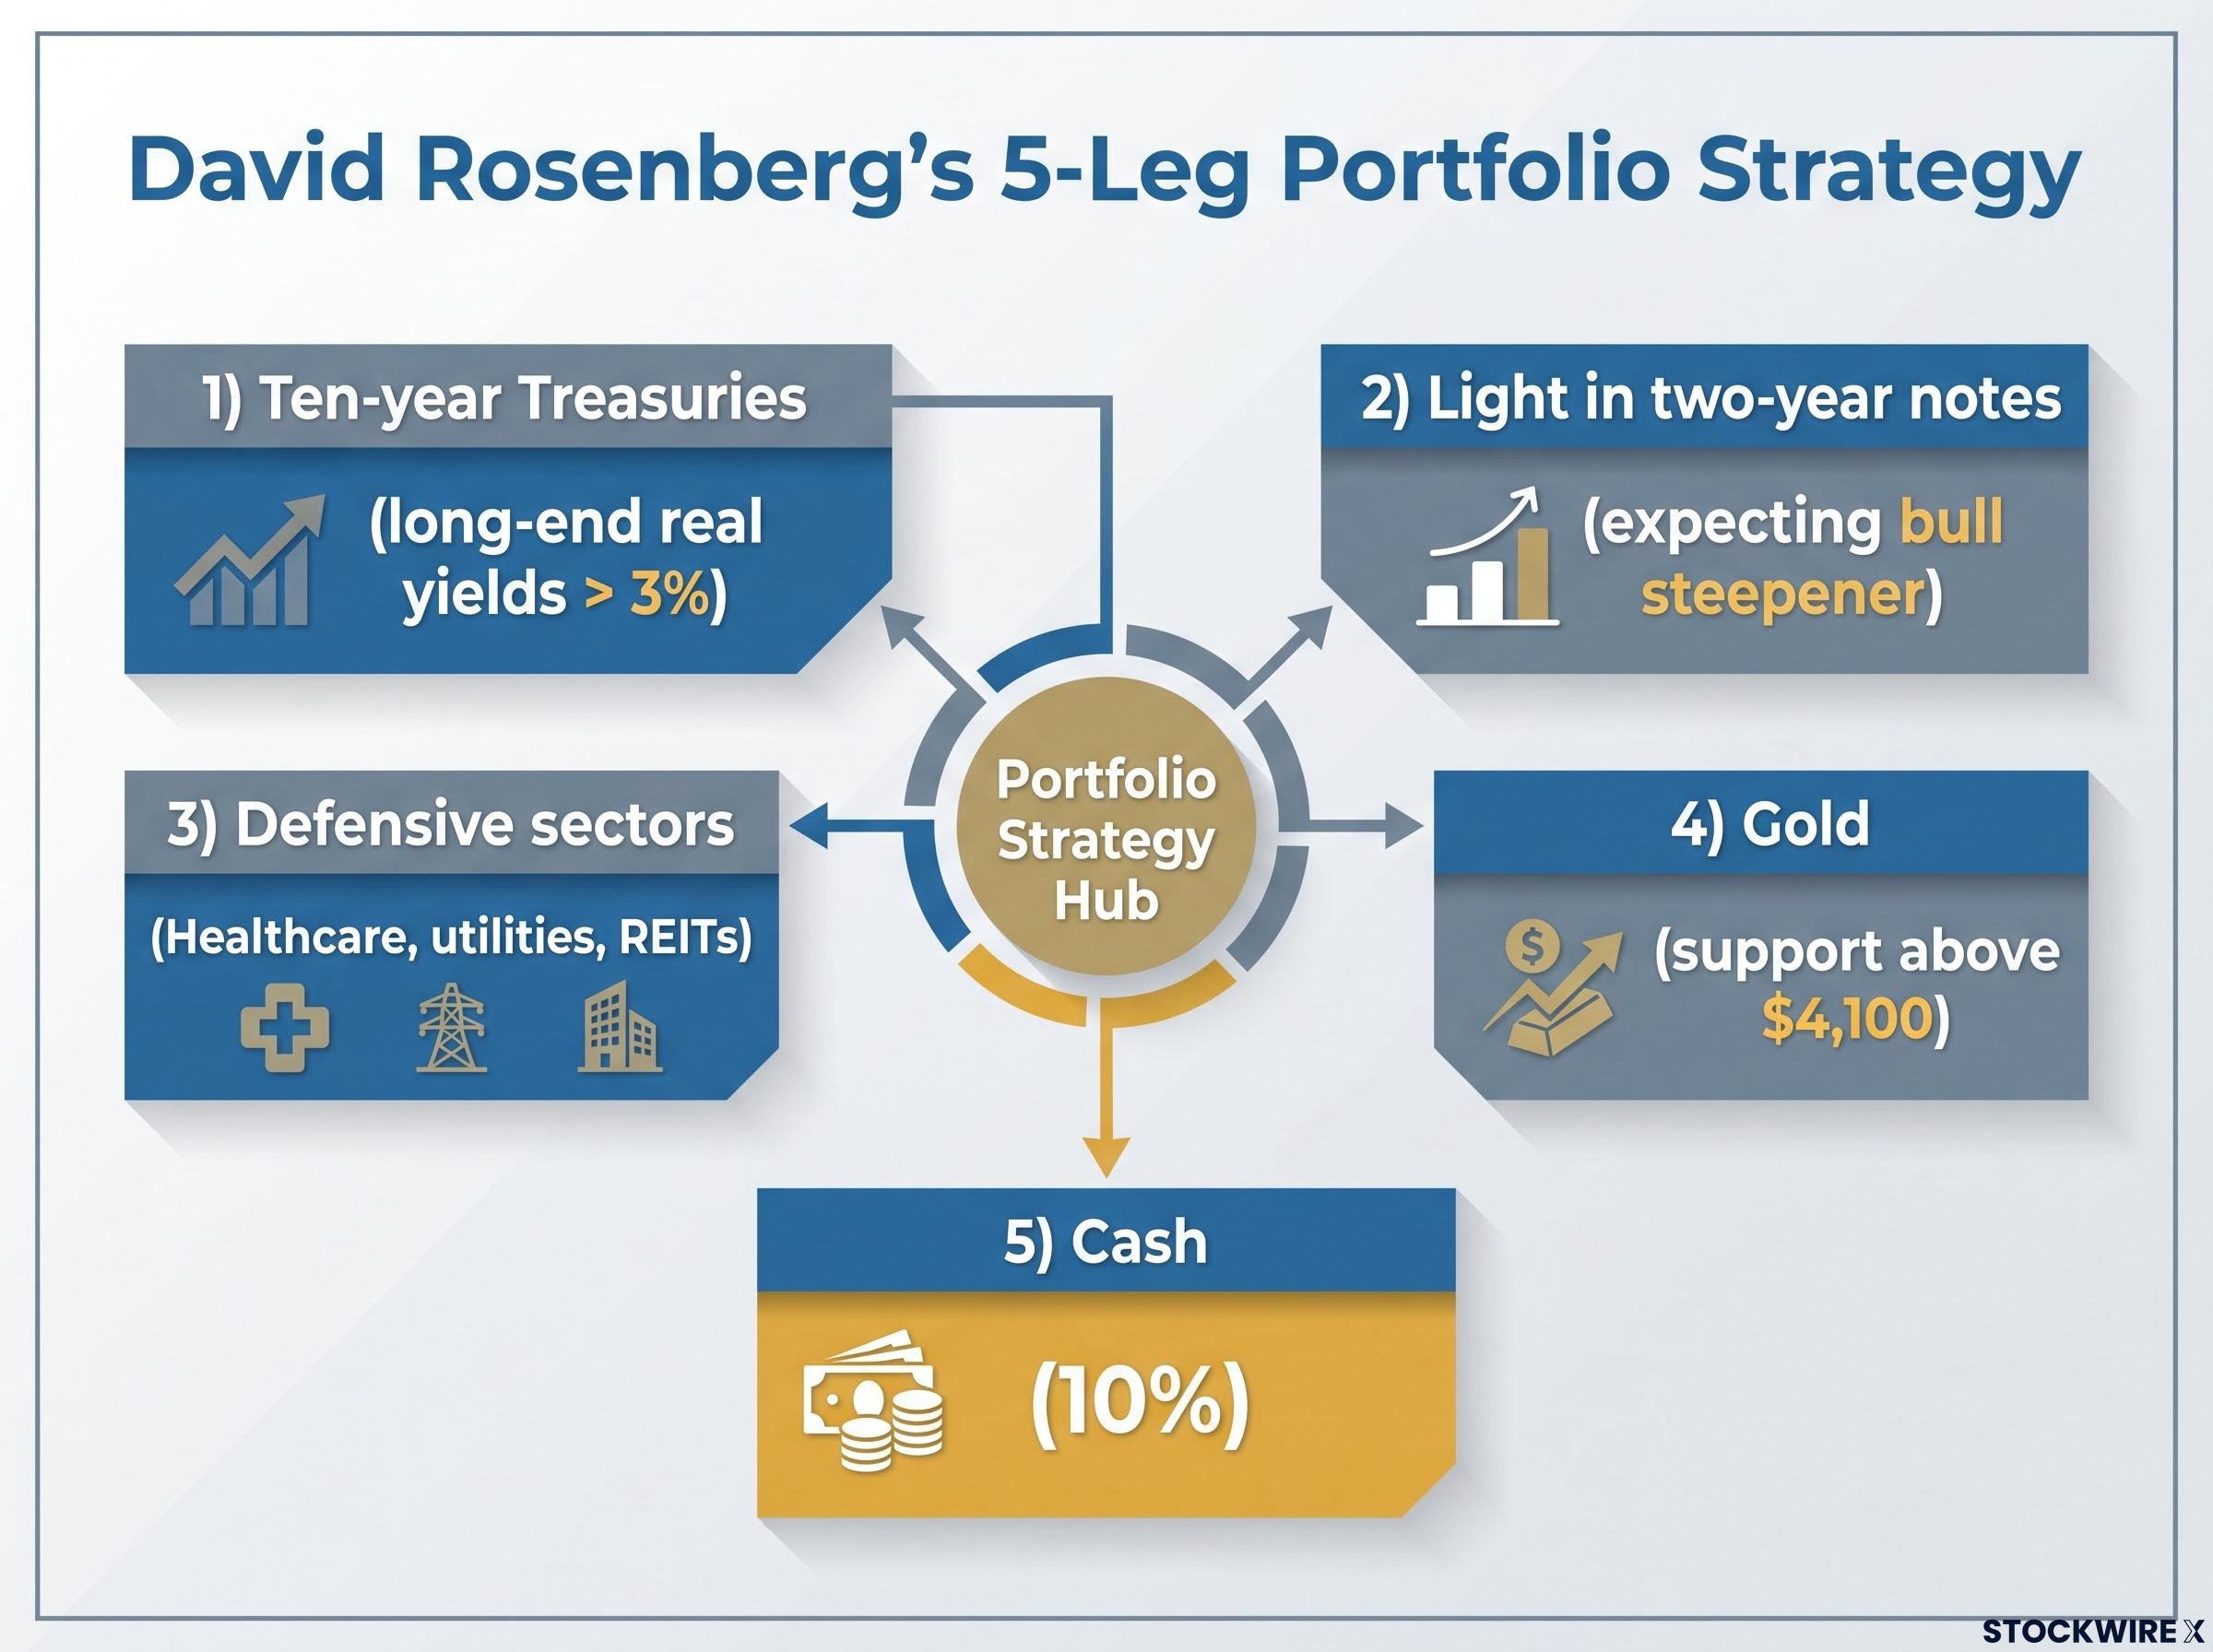
His portfolio has five legs:
- Ten-year Treasuries: Rosenberg points to a known payoff at maturity, a default probability he calls essentially zero, and long-end real yields above 3%.
- Light in two-year notes: He expects a bull steepener, where front-end yields fall faster than long-end yields as the Fed eventually cuts.
- Defensive sectors: Healthcare, utilities and REITs (real estate investment trusts) tend to benefit when rates fall.
- Gold: He is bullish and says the metal has found support above about $4,100.
- Cash at 10%: He has raised cash from nothing for liquidity, so he can buy assets when weaker hands are forced to sell.
The ten-year reportedly traded above 5% in mid-September, according to Fortune. No authoritative current level was available at the time of writing, so treat the following arithmetic as a framework rather than a quote.
Rosenberg’s 12-month breakeven The ten-year needs to reach about 6% for a zero total return. A fall to 4.5% would deliver about 14%.
Large asset managers overlap with parts of this view but stop short of the full call.
| Voice | Duration view | Notable nuance |
|---|---|---|
| Rosenberg | Long tens, light twos | Expects a recession-driven bull steepener |
| PIMCO | Finds 5-7 year Treasuries attractive | Growing more constructive on longer maturities as yields rise |
| Goldman Sachs Asset Management | Flexible bond strategies | Prefers this to an unconditional long-duration bet |
This is a recession-hedge portfolio. It pays off if growth slows and the Fed reverses course, and it lags if the economy re-accelerates. It fits only if you share the growth-slowdown view.
Where Gundlach disagrees, and what could break the trade
Gundlach agrees the Fed is making a mistake. On 18 October he accused Warsh of preparing to hike into a supply shock while focusing on headline rather than core inflation. Yet he draws a different lesson for bonds.
| Dimension | Rosenberg | Gundlach |
|---|---|---|
| Core frame | Growth and recession | Credibility and inflation regime |
| Treasuries | Owns tens | Worries about structural market disorder |
| Gold | Long-term hedge | Very bullish on central-bank reserve diversification |
The bond-bear case rests on three mechanisms. The first is term premium, the extra yield investors demand to hold long bonds when inflation and fiscal risk are elevated. The second is deficits and heavy issuance, with federal debt at about $40 trillion according to Rosenberg (a figure not independently confirmed). The third, cited by GSAM, is AI investment competing for capital.
Goldman Sachs economists expect an October pause and a December hike. They cite persistent inflation, stronger nominal growth and fiscal concerns.
The main risks to Rosenberg’s positioning:
- Inflation re-acceleration: Tariffs and oil could feed into wages and services, lifting the 2.2% trimmed mean.
- Equity upside: A soft landing could let the S&P 500 outrun defensives.
- Oil persistence: A prolonged Iran-related disruption could keep the Fed restrictive.
- Real rates staying high: Warsh’s price-stability emphasis may hold real rates above what Rosenberg expects, and cash holders face reinvestment risk if short rates fall.
Why a bear steepener is the real threat
A bear steepener means the Fed holds or raises short rates while deficits, oil and issuance push long yields higher. Rosenberg’s bull-steepener thesis would fail even if growth slows.
A bear steepener driven by Treasury issuance and roughly $220 billion of AI hyperscaler bond supply competing for long-duration capital would be a supply story, not a recession signal, and it is the main reason Rosenberg’s curve call could fail.
History frames the risk but does not settle it. Greenspan in 1987, energy shocks in the 1970s, 2008 and the European Central Bank’s 2011 hikes each offer lessons. No study isolating new-chair first moves against Treasuries was found.
Being right about a Fed mistake does not guarantee Treasuries pay off. That is why intermediate maturities and gold sit beside duration in the more defensive versions of this trade.
What the Warsh hike changes for your portfolio, and what it does not
The hike is a fact. The diagnosis is still open, and Rosenberg’s positioning works only if the supply-shock reading holds.
Three signals will tell you which way it is breaking:
- Trimmed-mean and core readings: Are they staying low or creeping up?
- The 2s10s spread and long-end term premium: Is the curve steepening the bull way or the bear way?
- Oil and wage data: Are second-round effects appearing?
The 27-28 October meeting and a possible December hike are the next markers. Remember that Rosenberg himself does not advocate selling all equities. Size any tilt to your own view on growth.
For readers wanting to size a Treasury tilt, our dedicated guide to managing bond portfolio duration shows how the 1-5 year curve balances yield against rate sensitivity.
This article is for informational purposes only and should not be considered financial advice. Investors should conduct their own research and consult with financial professionals before making investment decisions. Past performance does not guarantee future results. Financial projections are subject to market conditions and various risk factors, and forward-looking statements are speculative and subject to change.