
SEC Moves to End Mandatory Quarterly Reporting After 50 Years
Apr 24, 2026

The US economy expanded at just 0.1% on a quarterly basis in Q4 2025, revised down from prior estimates, while March 2026 inflation jumped to 3.3%, the highest reading since May 2024. This combination of near-stagnation in output paired with inflation 1.3 percentage points above the Federal Reserve’s target meets the technical definition of stagflation, a regime that has triggered dramatic portfolio repositioning among leading institutional investors.
The implications are immediate. Ray Dalio’s Bridgewater Associates posted a 33% return in 2025, its best year in five decades, by structuring portfolios around hard assets rather than conventional equity-bond allocations. Berenberg eliminated bond exposure entirely, shifting 45% of assets into precious metals and cryptocurrencies. The strategic logic is consistent: when central banks cannot cut rates without reigniting inflation or tighten without triggering recession, the policy paralysis creates conditions where real assets preserve purchasing power and nominal bonds erode it.
This analysis examines the documented stagflation indicators, the magnitude of asset class divergence, the structural drivers underpinning precious metals demand, the institutional case for zero bond exposure, specific allocation frameworks from Berenberg and Bridgewater, and the risk scenarios that could alter the thesis. The question is not whether stagflation conditions are present. The data confirms they are. The question is whether current institutional positioning represents rational response or late-cycle risk.
The numbers tell the story sequentially. US GDP grew 0.1% in Q4 2025 on a quarterly basis, down from a 4.4% annualised rate in Q3. That contraction in momentum paired with March 2026 CPI at 3.3% creates the classic stagflation squeeze: growth too weak to generate employment gains, inflation too high to justify rate cuts.
This is not a US anomaly. Euro area inflation climbed to 2.6% in March, up sharply from 1.9% in February. The European Union broadly reported 2.8%, with the European Commission attributing the jump to energy price pressures. UK CPI held at 3.0% for consecutive months, a full percentage point above the Bank of England’s target. The pattern is synchronised across developed markets.
The European Commission attributed the March inflation jump to energy price pressures driving inflation across both headline and core measures, with gasoline prices up 18.9% and fuel oil surging 44.2% year-over-year in the United States alone.
The energy component drives the inflation leg. Gasoline prices rose 18.9% year-over-year in the US, fuel oil surged 44.2%. These spikes trace directly to geopolitical disruptions surrounding the Iran conflict and Strait of Hormuz shipping constraints. Brent crude traded at $96 per barrel in late April, up 44.6% from the prior year, despite a ceasefire extension that has failed to fully reopen the strait or remove the US naval blockade.
| Region | GDP Growth (Q4 2025) | Inflation Rate (March 2026) | Central Bank Target | Policy Stance |
|---|---|---|---|---|
| United States | 0.1% quarterly | 3.3% | 2.0% | Paused after three cuts |
| Euro Area | 0.9% projected 2026 | 2.6% | 2.0% | Rates unchanged, data-dependent |
| United Kingdom | Below trend | 3.0% | 2.0% | Cautious, cuts not expected until 2027 |
The policy dilemma is structural. Central banks cannot cut aggressively without fuelling inflation further. They cannot tighten without risking recession. The result is paralysis. The Federal Reserve implemented three 25-basis-point cuts between September and December 2025, bringing the federal funds rate to 3.75%, then paused. Apollo’s chief economist Torsten Slok stated publicly that the Federal Reserve itself identifies stagflation as its biggest risk for 2026.
Federal Reserve Risk Assessment “The Federal Reserve itself identifies stagflation as its biggest risk for 2026.” — Torsten Slok, Chief Economist, Apollo
Gold returned 65% in 2025, the best annual performance since 1979. Year-to-date through April 2026, gold added another 40.3%, reaching $4,804 per ounce. Silver surged 147% in 2025 and currently trades at $79.52, up 143% year-over-year. The S&P 500 returned 18% in 2025 but has declined 4.33% year-to-date in 2026.
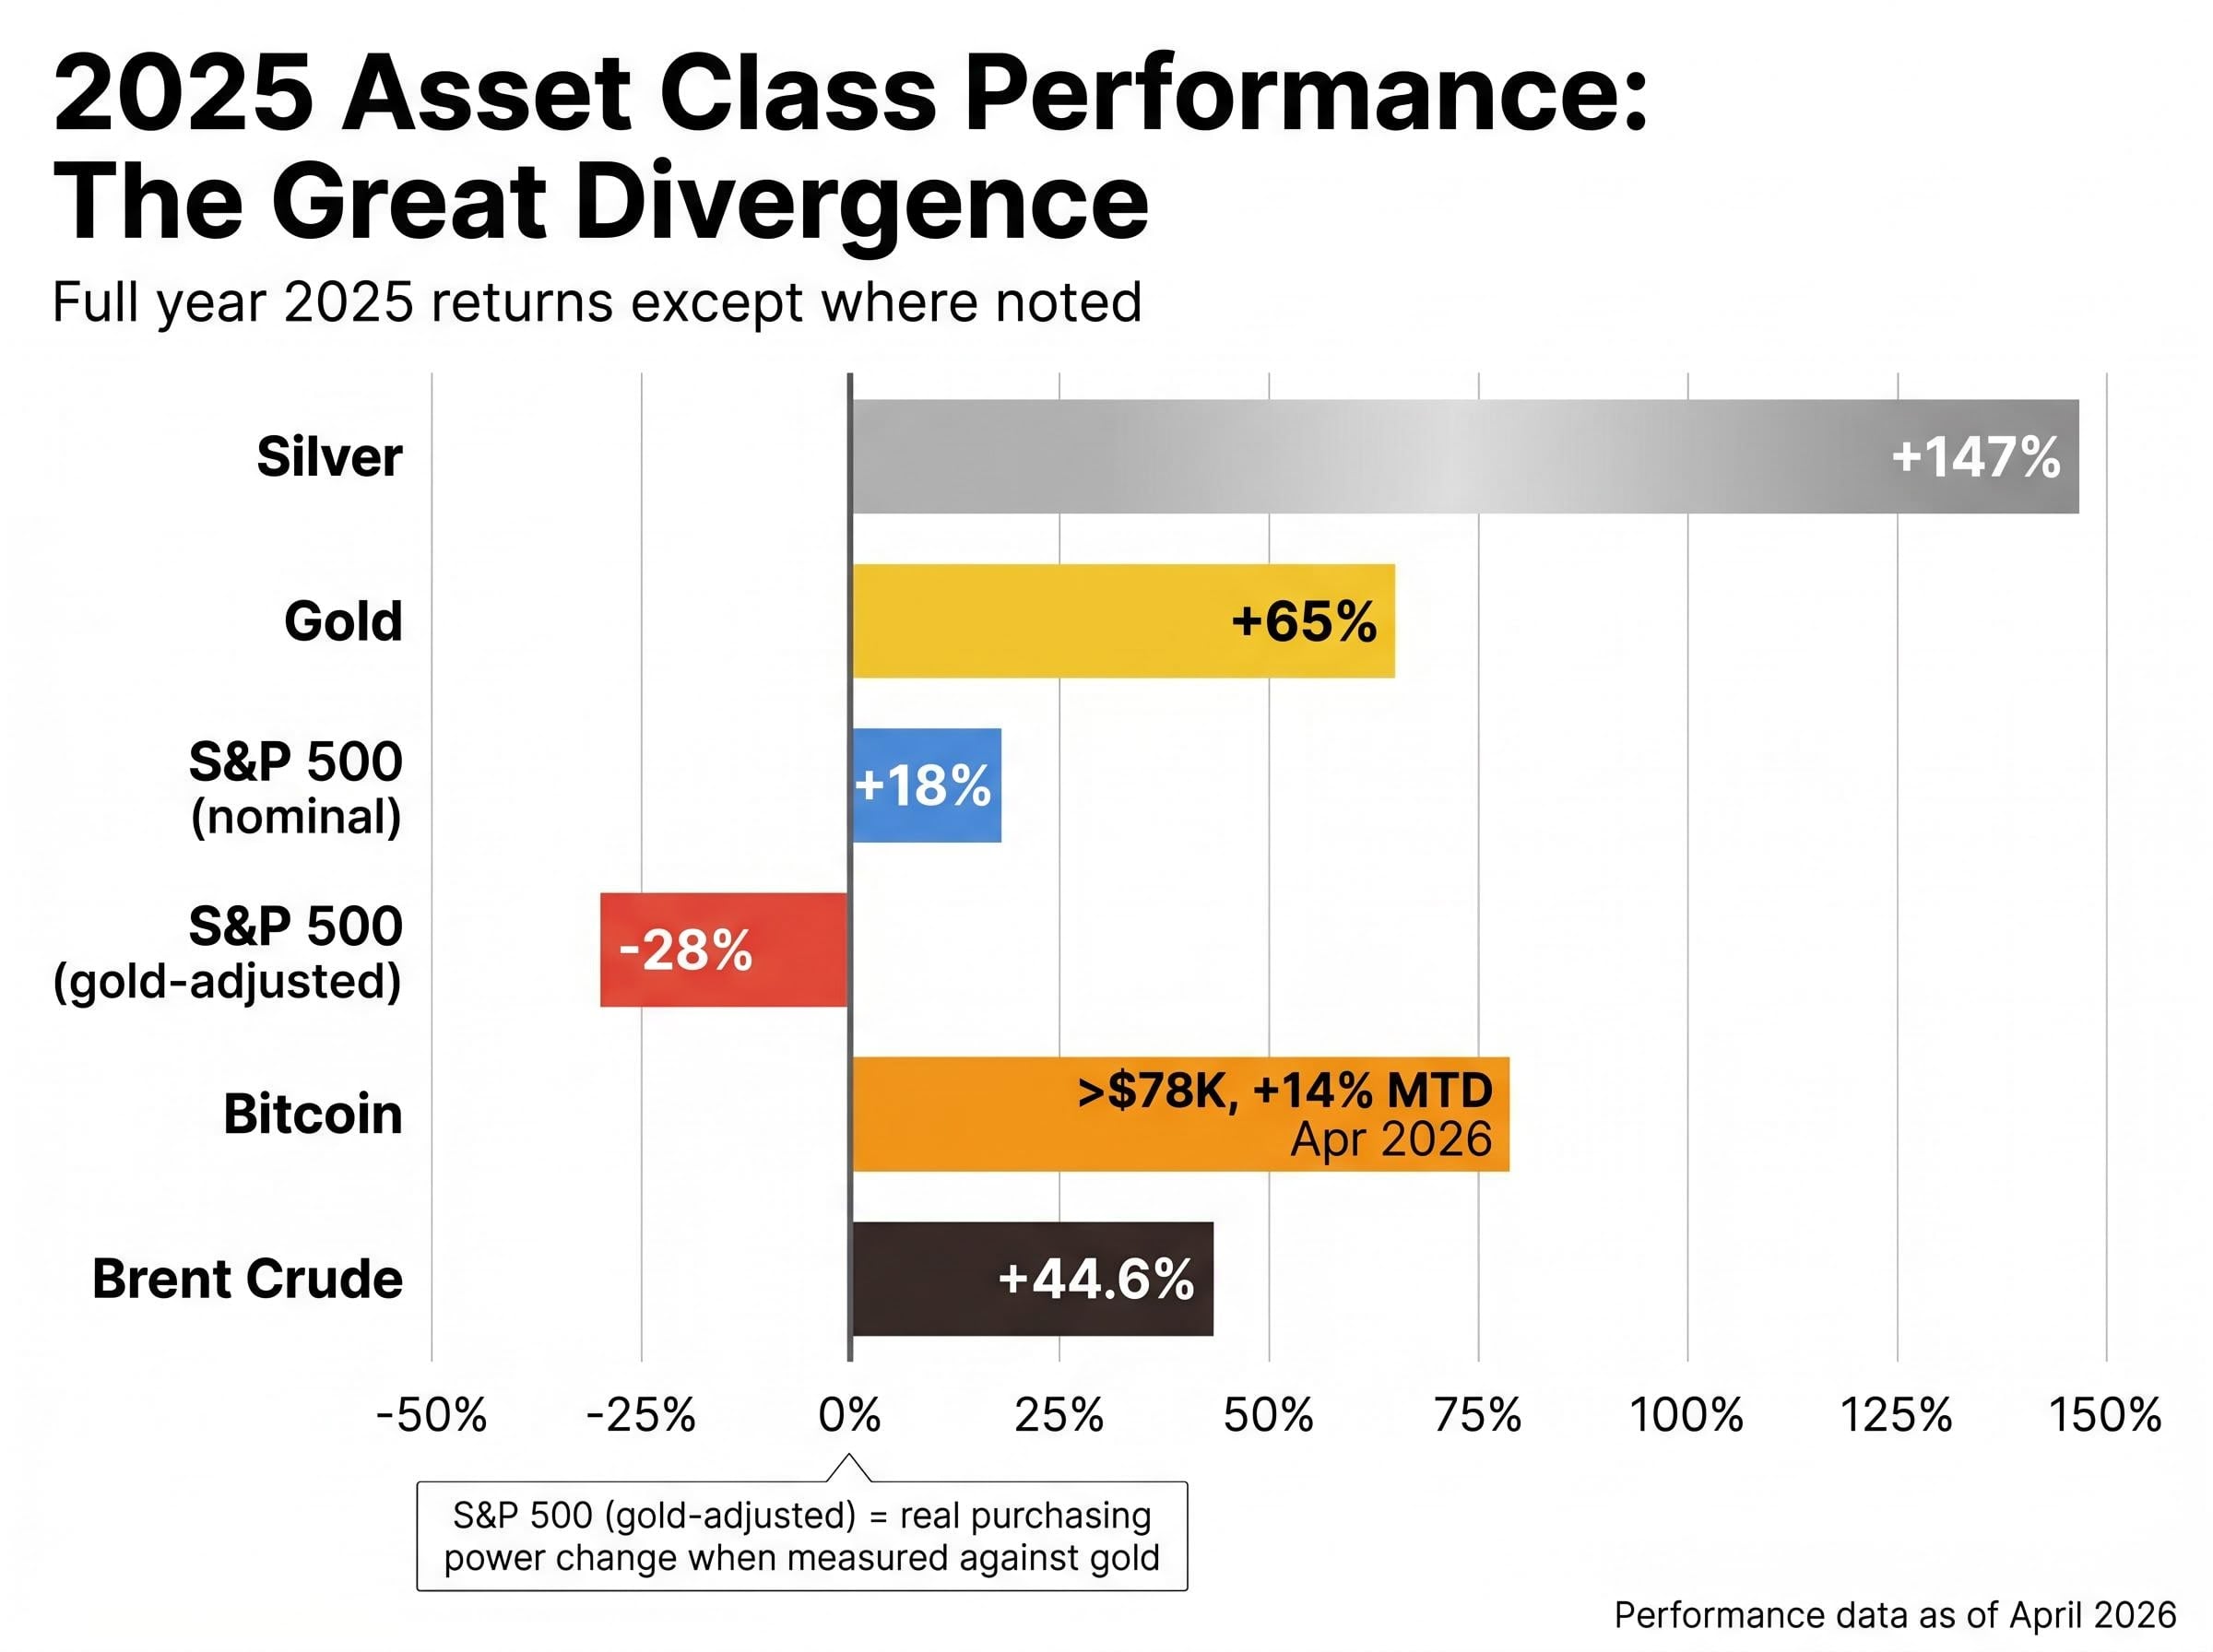
Ray Dalio reframed the equity gains in purchasing power terms. Measured in gold rather than nominal dollars, the S&P 500 declined 28% during 2025. Headline returns masked real wealth erosion. A portfolio that appeared to gain 18% actually lost more than a quarter of its purchasing power against hard assets.
The S&P 500’s 18% return in 2025 exemplifies the phenomenon of nominal equity gains masking real wealth erosion, where headline index performance occurred simultaneously with inflation nowcasts hitting 3.58% and purchasing power declining 28% when measured against gold appreciation.
Bitcoin demonstrated similar dynamics. Trading above $78,000 in April 2026, up approximately 14% month-to-date, Bitcoin attracted significant institutional flows. BlackRock purchased $900 million through its iShares Bitcoin Trust (IBIT) ETF in late April. The purchase moved market probability for Bitcoin reaching $80,000 by month-end from 44% to 71.5% in a 24-hour window.
Purchasing Power Context “When measured in gold terms rather than nominal dollars, the S&P 500 declined 28% during 2025. Headline market gains don’t represent improvements in real wealth if occurring with currency debasement and hard asset appreciation.” — Ray Dalio, Bridgewater Associates
The divergence is not speculative froth. It reflects structural repositioning. Institutional investors are pricing in the likelihood that central bank policy remains constrained by the inflation-growth trade-off, keeping real returns on nominal assets suppressed while hard assets benefit from scarcity and debasement concerns.
Central banks purchased 27 tonnes of gold in February 2026, with Poland acquiring 20 tonnes in a single month. Year-to-date through February, net purchases totalled 31 tonnes. Poland’s National Bank now holds 570 tonnes with an explicit target of 700 tonnes, representing 31% of total reserves. China extended its buying streak to 16 consecutive months, reaching 2,308 tonnes or approximately 10% of total reserves.
The World Gold Council Q4 2025 central bank demand report confirms that Poland’s National Bank was the largest sovereign buyer for the full year, with geographically diverse accumulation continuing across emerging markets despite the moderation from 2022-2023 record purchasing levels.
This is not price-sensitive tactical positioning. Poland’s 20-tonne February purchase came after January saw only 5 tonnes of global net buying, suggesting central banks pulled back when prices spiked but resumed accumulation as soon as valuations moderated. Uzbekistan acquired 8 tonnes in February, its 16th consecutive month of purchases, with gold now representing 88% of total reserves.
The pattern reflects deliberate de-dollarisation strategy. Central banks in Poland, China, Uzbekistan, and across Africa are diversifying away from dollar-denominated assets toward hard assets that cannot be devalued by monetary policy decisions made in Washington. Uganda launched a domestic gold buying programme in March targeting at least 100 kilograms from local producers through June. Kenya’s central bank Governor signalled intentions toward expanded accumulation.
India’s 76.5% domestic gold price surge in 2025 triggered a structural shift toward investment-grade gold products, with ETFs and digital gold now capturing 40-45% of total demand compared to 30-35% historically, demonstrating how price appreciation changes household asset allocation behavior even in culturally gold-centric markets.
| Country | Total Gold Reserves | % of Total Reserves | Consecutive Months Buying |
|---|---|---|---|
| Poland | 570 tonnes | 31% | Ongoing (20t in Feb 2026) |
| China | 2,308 tonnes | 10% | 16 |
| Uzbekistan | 407 tonnes | 88% | 16 |
| Czech Republic | Not disclosed | Not disclosed | 36 |
Silver carries both monetary and industrial demand. The gold-to-silver ratio compressed from 105:1 in April 2025 to approximately 59-61:1 in April 2026, below the modern long-term average of 70:1. This compression suggests silver is no longer deeply cheap by historical measures, despite extraordinary year-over-year gains.
The bear case anticipates potential pullback to $60-65 per ounce if speculative positioning unwinds. LBMA analyst surveys project an average of $79.57 for 2026, with ranges from $42 to $165 reflecting substantial disagreement. Industrial demand tied to energy transition and electronics provides support, but the ratio compression means silver’s valuation advantage has narrowed.
Financial repression is the deliberate suppression of real returns through policy settings that keep yields below nominal economic growth rates. Investors receive positive nominal interest but negative real returns after inflation. This is not accidental. It is a policy mechanism designed to erode the real burden of elevated government debt without requiring explicit default or restructuring.
The US national debt surpassed $39 trillion in late March 2026. The government borrowed $308 billion in February alone. The Congressional Budget Office projects annual interest payments will exceed $2 trillion by 2036, equivalent to approximately 5% of GDP. The Committee for a Responsible Federal Budget stated there is “no silver lining in this trajectory” and warned the nation’s fiscal position is “increasingly unstable.”
The Committee for a Responsible Federal Budget analysis of CBO March 2025 projections shows debt rising to 156% of GDP by 2055, with interest costs alone reaching 5.4% of GDP, triple the pre-pandemic level and consuming a larger share of the budget than defense or non-defense discretionary spending combined.
Central banks maintain this regime by keeping policy rates below inflation. The 10-year Treasury yields approximately 4.35%, below the 3.3% headline CPI but only marginally above when energy volatility is stripped out. The federal funds rate sits at 3.75%. Real returns are either negative or negligible. Bonds provide no inflation hedge and little diversification benefit when the inflation itself stems from policy choices rather than demand overheating.
Berenberg Investment Rationale “In an environment of exploding government debt and structurally higher inflation, real assets should be preferred over nominal government bonds.” — Berenberg Multi-Asset Outlook 2026
The three conditions enabling financial repression are present simultaneously:
Berenberg and similar allocators conclude that bonds function as a liability in this regime rather than a portfolio stabiliser. The erosion is gradual but cumulative. A 4.35% nominal yield against 3.3% inflation delivers 1.05% real return before taxes and fees. Over a decade, purchasing power barely keeps pace. Against hard assets appreciating 40-65% annually, the opportunity cost is severe.
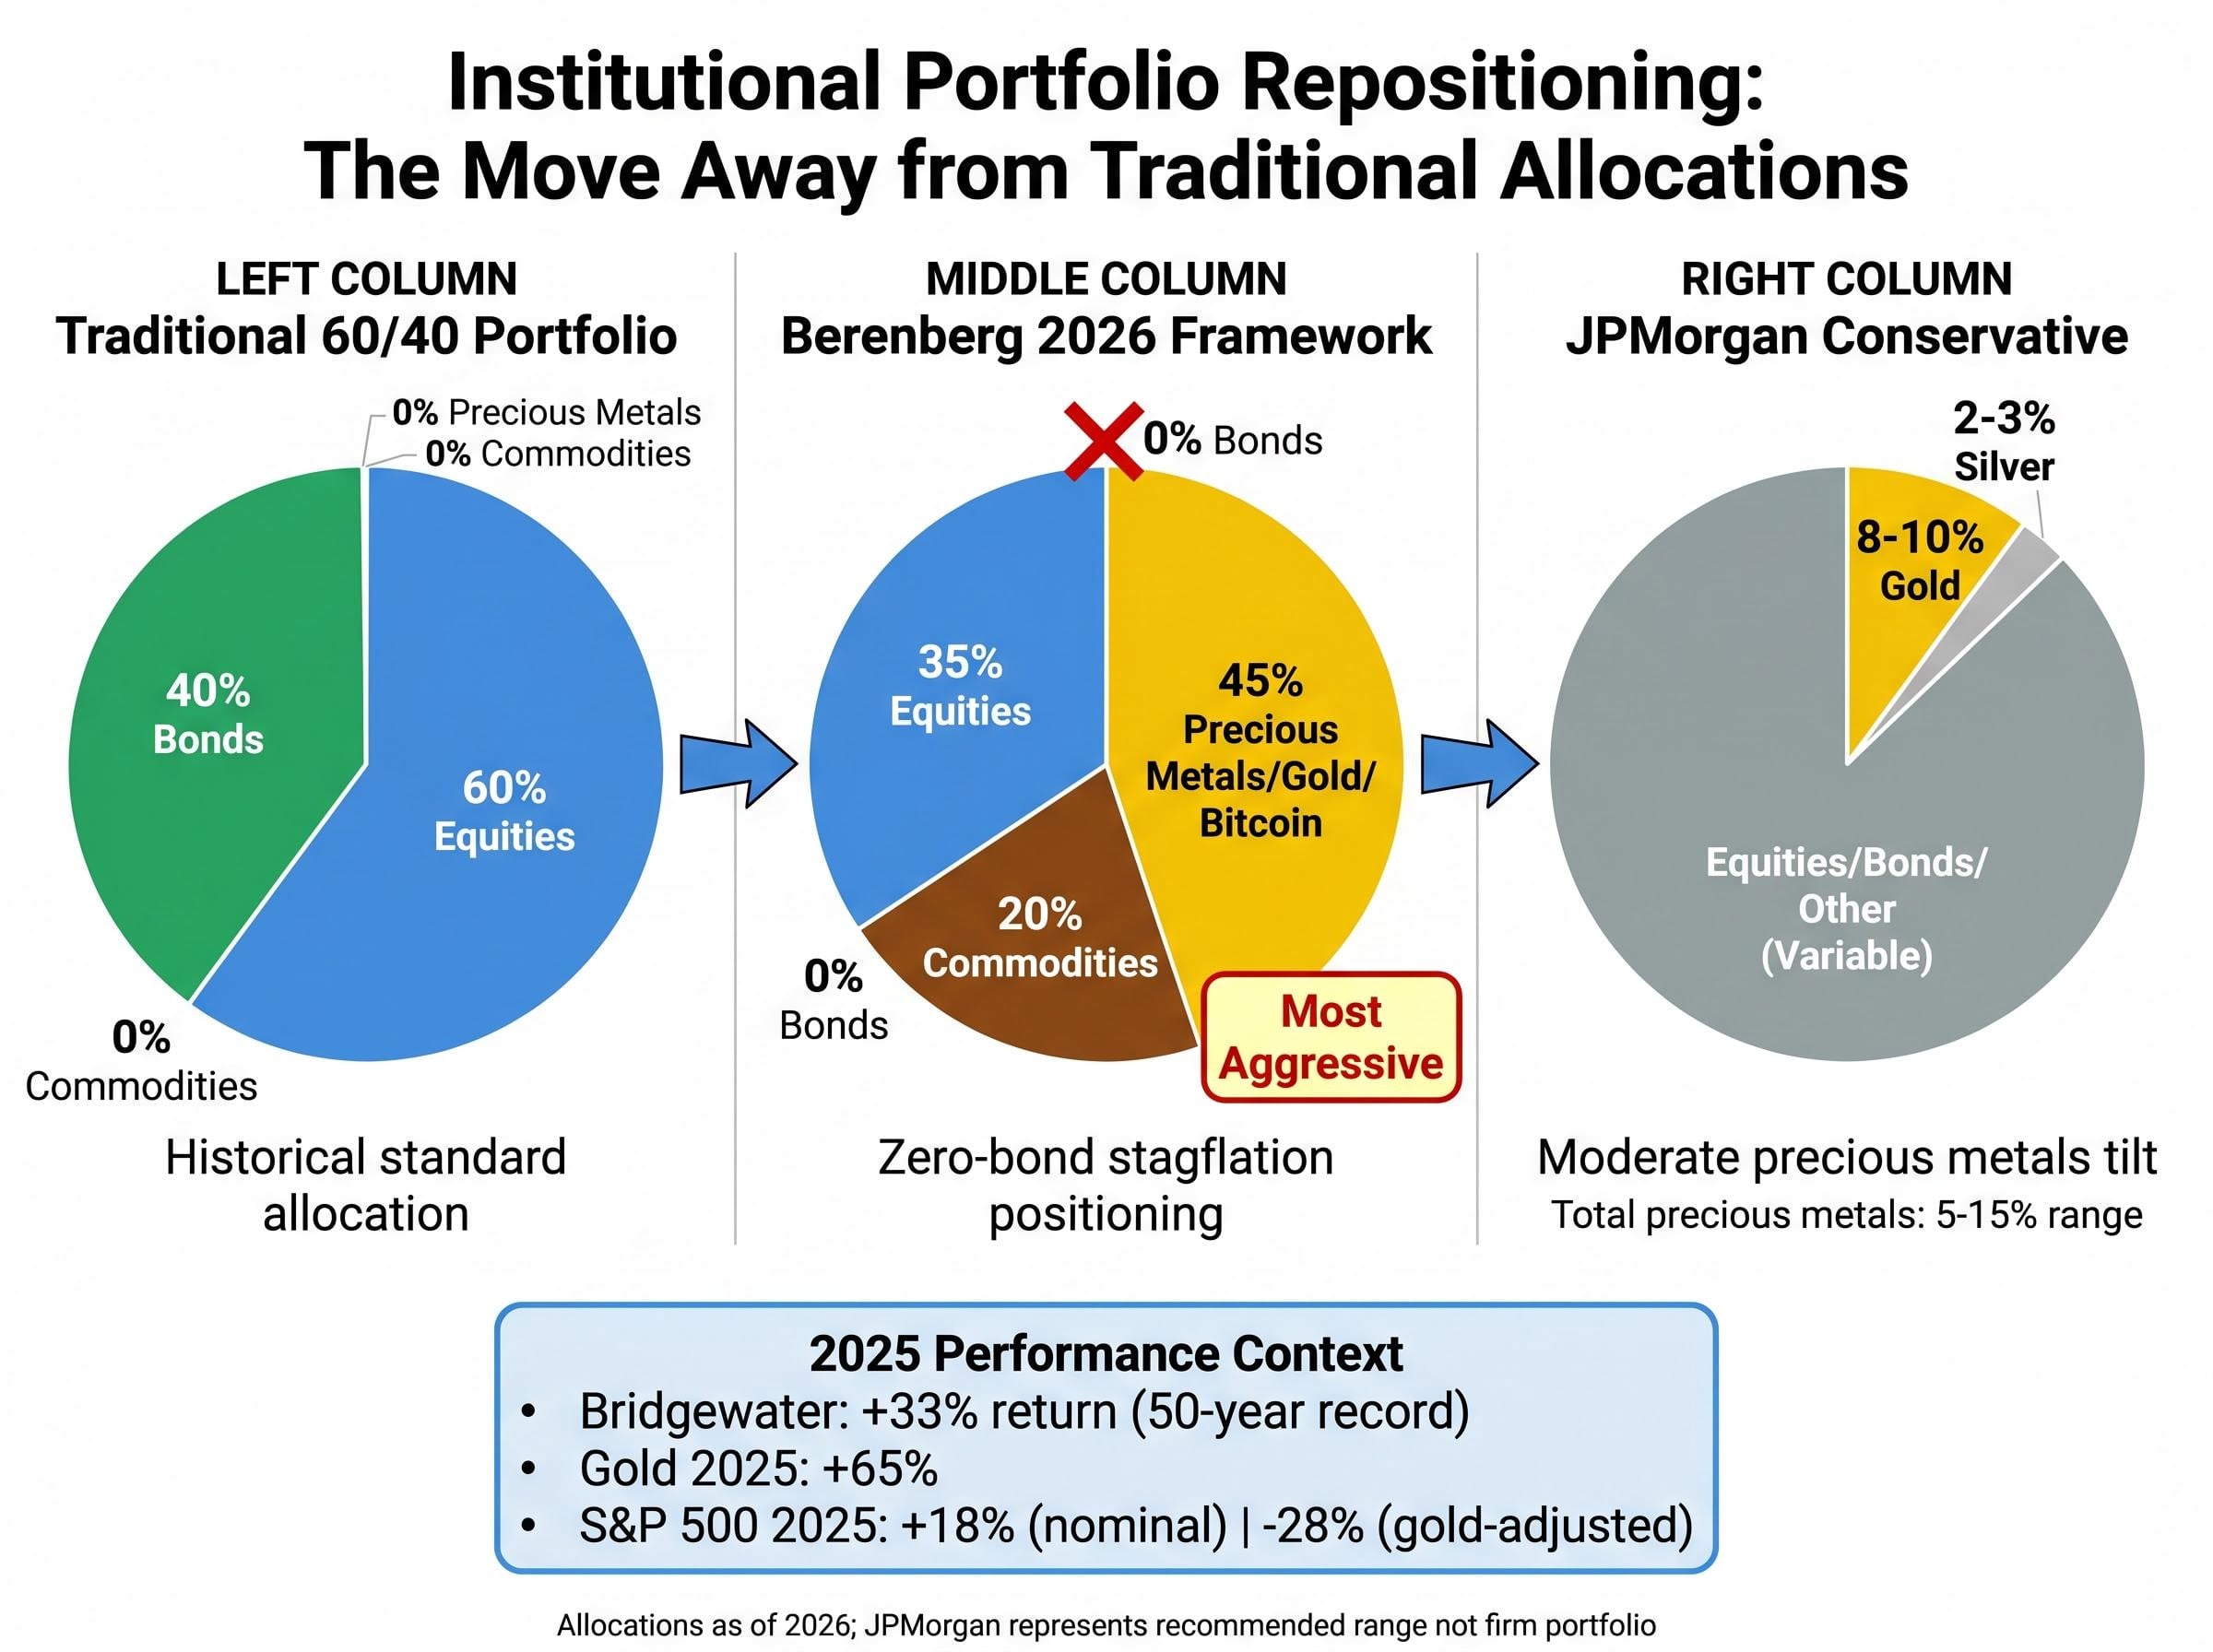
Berenberg’s 2026 allocation framework eliminates bonds entirely, shifting 45% of assets into “gold plus” (gold, silver, precious metals, and Bitcoin), 20% into commodities, and 35% into equities. This is the most aggressive expression of the stagflation thesis among major European asset managers. The zero-bond allocation reflects conviction that financial repression makes fixed income structurally unattractive.
Bridgewater delivered a 33% return in 2025, the best year in the firm’s 50-year history, by rotating from passive gold exposure into leveraged positions through gold-mining equities. Newmont became a major conviction holding. The firm captured both the precious metals rally and the operational leverage that mining companies provide when gold prices rise faster than extraction costs.
JPMorgan Asset Management suggests total precious metals exposure of 5-15% depending on risk tolerance. Conservative wealth preservation portfolios should hold 8-10% in gold with smaller 2-3% silver positions. This is notably more restrained than Berenberg’s 45% allocation but still represents meaningful departure from traditional 60/40 equity-bond frameworks.
| Framework | Precious Metals | Commodities | Equities | Bonds |
|---|---|---|---|---|
| Berenberg 2026 | 45% (gold, silver, Bitcoin) | 20% | 35% | 0% |
| JPMorgan Conservative | 8-10% gold, 2-3% silver | Variable | Variable | Variable |
| Traditional 60/40 | 0% | 0% | 60% | 40% |
Goldman Sachs projects gold reaching $5,400 by end-2026, representing 12.4% upside from April levels. JPMorgan’s base case targets $6,300, with upside scenarios extending to $8,000-$8,500 if household allocations expand from approximately 3% to 4.6% of assets. These forecasts assume structural demand persists rather than cyclical speculation.
Both Berenberg and Bridgewater retain meaningful equity exposure despite stagflation concerns. The rationale is straightforward: corporate earnings can remain resilient even with sluggish GDP growth. Goldman Sachs forecasts 12% earnings per share growth for 2026, driven by AI adoption, fiscal tailwinds, and corporate re-leveraging.
Equities provide inflation-adjusted pricing power that bonds cannot deliver. Companies raise prices in response to input cost inflation, maintaining margins. Bondholders receive fixed nominal coupons that erode in real terms. The S&P 500’s 4.33% year-to-date decline reflects valuation compression and concentration risk (the “Magnificent 7” accounted for 53% of 2025 returns), not fundamental earnings collapse.
The allocation logic balances hard asset inflation protection with equity exposure to capture corporate profit growth. Pure precious metals portfolios forgo the earnings component. Pure equity portfolios suffer purchasing power erosion if inflation persists. The hybrid approach seeks both.
For readers evaluating geographic equity allocation within their portfolios, our comprehensive walkthrough of capital allocation shifts following geopolitical events examines the $28 billion US equity fund inflows triggered by the April 7 ceasefire, the structural factors favoring American markets during energy crises, and how regional positioning fits within stagflation-oriented frameworks that retain equity exposure.
The stagflation thesis rests on three pillars: persistent inflation from energy disruption, central bank policy paralysis, and structural government debt dynamics forcing financial repression. Each pillar has identifiable breaking points.
China represents the largest wildcard. President Trump’s planned visit to China in April 2026 offers the best opportunity for a longer-term trade deal given Trump’s preference for interpersonal diplomacy. If China implements substantial monetary or fiscal stimulus in response to property sector weakness, global growth could reaccelerate. Commodity demand would rise, supporting energy and industrial metals, but the growth leg would weaken the stagflation case for precious metals.
Silver’s 143% year-over-year gain and compression of the gold-to-silver ratio below historical averages suggest potential overextension. The bear case targets $60-65 per ounce if speculative positioning unwinds. LBMA survey ranges extending from $42 to $165 reflect genuine uncertainty about whether current prices represent fair value or late-cycle excess.
Geopolitical duration is the third variable. The ceasefire extension announced 22 April masks continued underlying tensions, according to the Atlantic Council. Iran denies requesting the extension and maintains the Strait of Hormuz will not fully reopen while the US naval blockade persists. If diplomatic progress produces genuine de-escalation, Brent could decline toward Goldman’s baseline target of $80 by year-end. Energy normalisation would remove the primary inflation driver, allowing central banks to cut rates and weakening the case for zero-bond allocations.
Geopolitical Uncertainty Persists “The ceasefire masks continued underlying tensions. Iran retains capability to create regional disruptions, and the US naval blockade remains in place.” — Atlantic Council Scenario Framework
The empirical case for stagflation is documented. US GDP grew 0.1% quarterly in Q4 2025 while March 2026 inflation reached 3.3%, meeting the technical definition. Hard assets outperformed dramatically: gold up 65% in 2025 and 40.3% year-to-date, silver up 147% and 143% respectively, while the S&P 500 declined 4.33% in 2026 after an 18% gain that evaporated in purchasing power terms.
Central bank demand provides structural support. Poland, China, Uzbekistan, and emerging African buyers purchased 31 tonnes year-to-date through February, reflecting deliberate de-dollarisation rather than tactical positioning. Institutional allocators responded with extreme frameworks: Berenberg eliminated bonds entirely, Bridgewater posted its best year in five decades, and JPMorgan recommended 8-10% gold allocations for conservative portfolios.
The investment implication is straightforward. Investors should evaluate whether current fixed-income exposure delivers adequate real returns in a financial repression regime where 10-year Treasuries yield 4.35% against 3.3% inflation. Precious metals allocations merit reassessment against the documented divergence between hard assets and nominal bonds.
The coming months will test whether the ceasefire holds, whether China implements stimulus, and whether inflation moderates as energy pressures ease. Each outcome shifts the probability distribution. China stimulus strengthens the growth case and weakens precious metals. Energy normalisation removes the inflation leg. Continued policy paralysis extends the conditions that produced 2025’s extraordinary hard asset returns. Ongoing monitoring is essential.
This article is for informational purposes only and should not be considered financial advice. Investors should conduct their own research and consult with financial professionals before making investment decisions.
Past performance does not guarantee future results. Financial projections are subject to market conditions and various risk factors.
A stagflation investment strategy involves repositioning a portfolio away from nominal bonds and toward hard assets like gold, silver, and commodities when economic growth stagnates while inflation remains elevated. In 2026, with US GDP growing just 0.1% quarterly and inflation at 3.3%, institutional investors are actively deploying such strategies to preserve purchasing power.
Bridgewater posted a 33% return in 2025 by rotating into hard assets including leveraged gold-mining equities, while Berenberg eliminated bond exposure entirely and shifted 45% of assets into precious metals and cryptocurrencies alongside a 35% equity and 20% commodity allocation.
During stagflation, bonds deliver negative or negligible real returns because policy rates are kept below inflation to avoid triggering recession, a dynamic known as financial repression. With the 10-year Treasury yielding approximately 4.35% against 3.3% inflation, real returns barely cover purchasing power losses.
Gold rose 65% in 2025 and added another 40.3% year-to-date in 2026, driven by central bank accumulation (31 tonnes net purchased through February 2026), deliberate de-dollarisation by countries including Poland and China, and institutional demand tied to inflation hedging and currency debasement concerns.
Three key risks could weaken the case for hard assets: a major Chinese fiscal stimulus package that reignites global growth, a sustained ceasefire and reopening of the Strait of Hormuz that normalises energy prices, and an unwinding of speculative positioning in silver that analysts warn could push prices back toward $60-65 per ounce.